OPEN-SOURCE SCRIPT
Price Percentage Shaded Candles
Description:
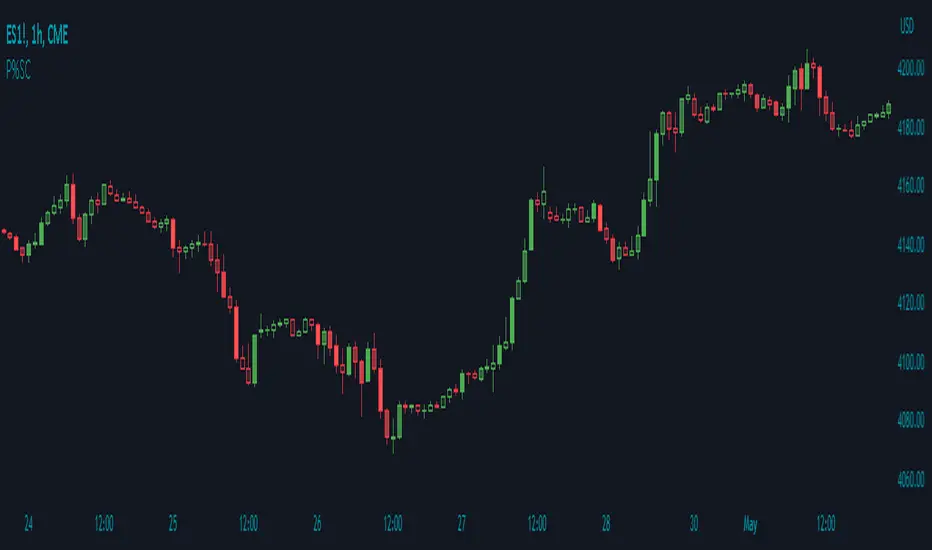
The Price Percentage Shaded Candles indicator (P%SC) is a technical analysis tool designed to represent price candles on a chart with shading intensity based on the percentage change between the open and close prices. This overlay indicator enhances visual analysis by providing a visual representation of price movement intensity.
How it Works:
The P%SC indicator calculates the percentage change between the open and close prices of each candle. It then determines the shading intensity of the price candles based on this percentage change. Higher percentage changes result in darker shading, while lower percentage changes result in lighter shading.
Usage:
To effectively utilize the Price Percentage Shaded Candles indicator, follow these steps:
1. Apply the Price Percentage Shaded Candles indicator to your chart by adding it from the available indicators.
2. Configure the indicator's inputs:
- Specify the color for bullish candles using the "Bullish Color" input.
- Specify the color for bearish candles using the "Bearish Color" input.
3. Observe the shaded candles on the chart:
- Bullish candles are colored with the specified bullish color and shaded according to the percentage change.
- Bearish candles are colored with the specified bearish color and shaded according to the percentage change.
4. Interpret the shaded candles:
- Darker shading indicates a higher percentage change and stronger price movement during the corresponding candle.
- Lighter shading indicates a lower percentage change and weaker price movement during the corresponding candle.
5. Combine the analysis of shaded candles with other technical analysis tools, such as trend lines, support and resistance levels, or candlestick patterns, to identify potential trade setups.
6. Implement appropriate risk management strategies, including setting stop-loss orders and position sizing, to manage your trades effectively and protect your capital.
Note: The Price Percentage Shaded Candles indicator provides insights into the shading intensity of price candles based on percentage changes. However, it is recommended to use this indicator in conjunction with other technical analysis tools and perform thorough analysis before making trading decisions.
Skrip sumber terbuka
Dalam semangat sebenar TradingView, pencipta skrip ini telah menjadikannya sumber terbuka supaya pedagang dapat menilai dan mengesahkan kefungsiannya. Terima kasih kepada penulis! Walaupun anda boleh menggunakannya secara percuma, ingat bahawa menerbitkan semula kod ini adalah tertakluk kepada Peraturan Dalaman kami.
Penafian
Maklumat dan penerbitan adalah tidak dimaksudkan untuk menjadi, dan tidak membentuk, nasihat untuk kewangan, pelaburan, perdagangan dan jenis-jenis lain atau cadangan yang dibekalkan atau disahkan oleh TradingView. Baca dengan lebih lanjut di Terma Penggunaan.