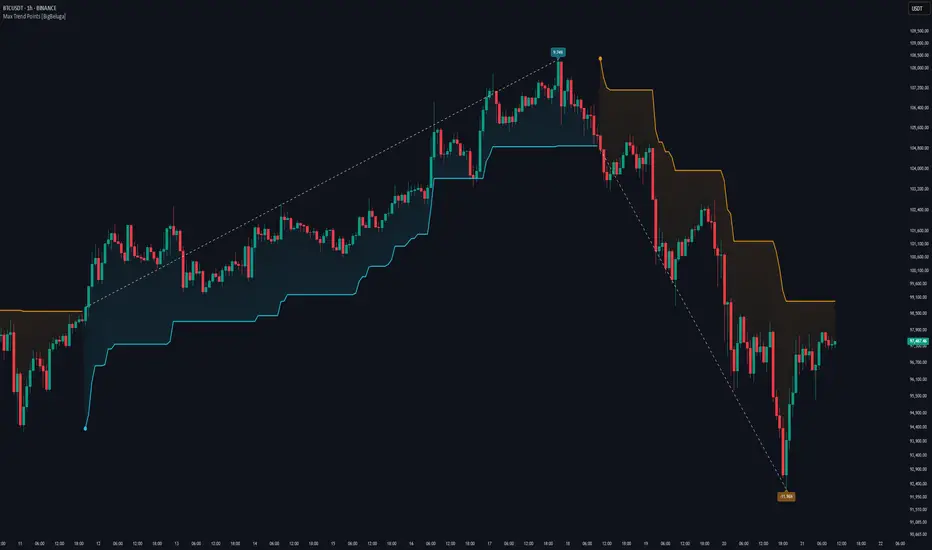
Max Trend Points [BigBeluga]🔵 OVERVIEW
A clean and powerful tool for identifying major trend shifts and quantifying the strength of each move using dynamically calculated price extremes.
This indicator helps traders visualize the most significant trend changes by plotting trend direction lines and dynamically tracking the highest or lowest point within each trend leg. It’s ideal for identifying key price impulses and measuring their magnitude in real time.
🔵 CONCEPTS
Uses an adaptive trend-following logic based on volatility envelopes created from HMA of the price range (high - low).
Identifies trend direction and flips when price breaks above or below these dynamic envelopes.
Tracks swing highs and lows within the current trend leg to highlight trend extremes.
Calculates and displays the percentage gain or drop from trend start to trend peak/valley.
🔵 FEATURES
Trend Shift Detection:
Plots a colored trend line (uptrend or downtrend) that updates based on price action volatility.
Impulse Mapping:
Draws a dashed line between the point of trend change (close) and the current trend leg's extreme (highest high or lowest low).
Percentage Labeling:
Displays a floating label showing the exact percent change from the trend start to the current extreme.
Real-Time Adjustments:
As the trend progresses, the extreme point and the percent label update automatically to reflect new highs/lows.
🔵 HOW TO USE
Look for the trend color shift and circular marker to identify a new potential trend direction.
Use the dashed lines and percent label to evaluate the strength and potential maturity of each move.
Combine this tool with support/resistance levels or other indicators to identify confluence zones.
Adjust the "Factor" input to make the trend detection more or less sensitive depending on your timeframe.
🔵 CONCLUSION
Max Trend Points is an efficient visual indicator for understanding the structure and magnitude of trending moves. It provides essential feedback on how far a trend has traveled, where momentum may be peaking, and when a shift may be underway—all with real-time adaptability and clean presentation.
Percentagechange
ADR & ATR OverlayADR & ATR Overlay
This indicator will display the following as an overlay on your chart:
ADR
% of ADR
ADR % of Price
ATR
% of ATR
ATR % of Price
Description:
ADR : Average Day Range
% of ADR : Percentage that the current price move has covered its average.
ADR % of Price : The percentage move implied by the average range.
ATR : Average True Range
% of ATR : Percentage that the current price move has covered its average.
ATR % of Price : The percentage move implied by the average true range.
Options:
Time Frame
Length
Smoothing
Enable or Disable each value
Text Color
Background Color
How to use this indicator:
The ADR and ATR can be used to provide information about average price moves to help set targets, stop losses, entries and exits based on the potential average moves.
Example: If the "% of ADR" is reading 100%, then 100% of the asset's average price range has been covered, suggesting that an additional move beyond the range has a lower probability.
Example: "ADR % of Price" provides potential price movement in percentage which can be used to asses R/R for asset.
Example: ADR (D) reading is 100% at market close but ATR (D) is at 70% at close. This suggests that there is a potential move of 30% in Pre/Post market as suggested by averages.
Notes:
These indicators are available as oscillators to place under your chart through trading view but this indicator will place them on the chart in numerical only format.
Please feel free to modify this script if you like but please acknowledge me, I am only a hobby coder so this takes some time & effort.

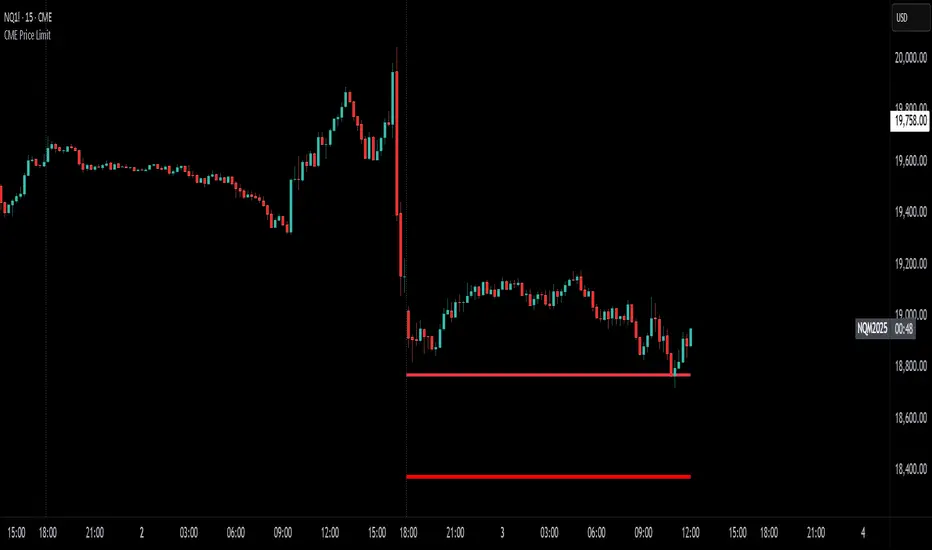
CME Price LimitCalculates the CME Price Limit
The reference price is obtained from the previous day's closing settlement price
(data pulled from the asset's daily chart with settlement enabled)
Percentage limit can be modified in settings
Buffer can be enabled (for example, 2% buffer on a 7% limit, so a line gets drawn at 5% too)
Alert can be enabled for price crossing a certain percentage from reference on the day
You can choose to plot the historical lines on every day, or the current day only
The reference price output can be found in the data window, or in the indicator status line if enabled in the settings.
Before placing real trades with this, you should compare the indicator's reference price to what's shown on CME's website, to double check that TradingView's data matches for your contract.
www.cmegroup.com
rate_of_changeLibrary "rate_of_change"
// @description: Applies ROC algorithm to any pair of values.
// This library function is used to scale change of value (price, volume) to a percentage value, just as the ROC indicator would do. It is good practice to scale arbitrary ranges to set boundaries when you try to train statistical model.
rateOfChange(value, base, hardlimit)
This function is a helper to scale a value change to its percentage value.
Parameters:
value (float)
base (float)
hardlimit (int)
Returns: per: A float comprised between 0 and 100

Custom Index CompositeCustom Index Composite calculates an unweighted composite index by averaging the daily returns of multiple stock tickers. Instead of using price-level weighting, it focuses solely on percentage change, allowing you to compare diverse market themes side by side on a common basis.
Why Use a Custom Index Composite?
Unlike traditional indices that often lean on market capitalization or price-level data, a custom composite based solely on returns strips out the bias inherent to high-priced stocks. This provides several benefits:
Objective Cross-Comparison:
When stocks or market themes trade at very different price levels, it can be difficult to assess performance objectively. Using percentage returns, the composite creates an even playing field, enabling a clear comparison between different assets or themes.
Tailored Benchmarking:
By selecting and combining specific tickers, you can create benchmarks that better represent the segments or strategies you’re interested in. This is particularly useful when standard indices do not capture the nuances of your investment approach.
Performance Normalization:
Converting raw price data into daily percentage returns minimizes distortions that arise from price differences. This normalization helps in understanding true performance trends across the chosen tickers, making the composite index a more reliable gauge of relative market movement.
Custom Analysis Framework:
The indicator offers flexibility to adjust the lookback period (defaulting to about 3 months) so you can fine-tune the sensitivity of the index to recent market behavior. This enables you to either smooth out volatility or capture a more immediate trend, depending on your analytical needs.
Key Features:
Configurable Appearance:
You can easily configure the line color, line width, index name, and index name color via the options panel.
Ticker Configuration:
By default, you can enter up to 15 different tickers into the composite index. Technically, the indicator supports up to 40 tickers (these additional inputs are commented out by default to maintain performance), and you may enable them individually if required.
Calculated Bars Length:
The indicator uses a “Calculated bars length” setting, which is set by default to 63 days (approximately 3 months). This value can be adjusted, and it is recommended to use the greatest common denominator for consistent analysis.
How To Configure Your Chart:
Add the Indicator:
Place the Custom Index Composite on your chart.
Disable Main Symbol Visibility:
Hide the primary symbol’s plot and set its scale to “None” to prevent interference with the composite display.
Pin to Right Scale:
Set the scale of the first composite indicator to “Pinned to right scale.” This helps maintain consistency across different composite indicators.
Add Multiple Composites:
You can add additional composite indicators and set their scales to “Pinned to right scale” (or alternatively to “A”) for convenient comparison.
Limitations:
If a ticker symbol is set once in the options, it cannot be cleared to an empty value later. As a result, the symbol will continue to appear in the indicator’s title on the chart. The only way to remove an unwanted symbol is to completely reset the settings and re-enter your desired tickers.

Percent Trend Change [BigBeluga]The Percent Trend Change indicator is a trend-following tool that provides real-time percentage changes during trends based on entry prices. Using John Ehlers’ Ultimate Smoother filter, it detects trend direction, identifies uptrends and downtrends, and tracks percentage changes during the trend. Additionally, it has a channel that can be toggled on or off, and the width can be customized, adding an extra visual layer to assess trend strength and direction.
NIFTY50:
META:
🔵 IDEA
The Percent Trend Change indicator helps traders visualize the progression of a trend with percentage changes from entry points. It identifies trends and marks percentage changes during the trend, making it easier to assess the strength and sustainability of the ongoing trend.
The use of John Ehlers' Ultimate Smoother filter helps detect trend changes based on consecutive price movements over five bars, making it highly responsive to short- and medium-term trends.
🔵 KEY FEATURES & USAGE
◉ Ultimate Smoother Filter for Trend Detection:
The trend is detected using the Ultimate Smoother filter. If the smoothed line rises five times in a row, the indicator identifies an uptrend. If it falls five times in a row, it identifies a downtrend.
◉ Trend Entry with Price Labels:
The indicator marks trend entry points with up (green) and down (red) triangles. These triangles are labeled with the entry price, allowing traders to track the starting price of the trend.
◉ Percentage Change Labels During Trends:
During a trend, the indicator periodically plots percentage change labels based on the bar period set in the settings.
In an uptrend, positive changes are marked in green, while negative changes are marked in orange. In a downtrend, negative changes are marked in red, while positive changes are marked in orange.
Each plotted percentage label also includes a count of the trend points, allowing traders to track how many times the percentage labels have been plotted during the current trend.
These percentage labels help traders understand how much the price has changed since the trend began and can be used to define potential take-profit targets.
◉ Channel Toggle and Width Customization:
The indicator includes a channel that visually highlights the trend. Traders can toggle this channel on or off, and the width of the channel can be adjusted to match individual preferences. The channel helps visualize the overall trend direction and the range within which price fluctuations occur.
🔵 CUSTOMIZATION
Smoother Length: Adjusts the length of the Ultimate Smoother filter, affecting how responsive the indicator is to price fluctuations.
Bars Percent: Defines how many bars must pass before a new percentage label is plotted. A smaller value plots labels more frequently, while a higher value shows fewer labels.
Channel Width & Show Channel: The width of the channel can be customized, and traders can toggle the channel on or off depending on their preferences.
Color Customization: Traders can customize the colors for the uptrend, downtrend, and percentage labels, providing flexibility in how the indicator is displayed on the chart.
By combining trend-following capabilities with percentage change tracking, the Percent Trend Change indicator offers a powerful tool for identifying trend direction and setting potential take-profit targets. The ability to customize the channel and percentage labels makes it adaptable to various trading strategies.

Outlier changes alertAn indicator that calculates click (price change), percentage change, and Z-score changes while displaying outliers based on defined ranges.
Outlier Detection:
Mark outliers (for price, percentage, Z-score) based on user-defined thresholds. For example, any price movement exceeding a certain Z-score or percentage change could be marked as an outlier and displayed on chart.
Indicator Overview:
1. Click (Price Change):
Calculate the absolute price change from one period to another (e.g., from the current closing price to the previous closing price).
2. Percentage Change:
Calculate the percentage price change over a specific period, showing how much the price has changed in relative terms compared to the previous price.
3. Z-Score:
Compute the Z-score to standardize the price change relative to its historical average and standard deviation. The Z-score helps in detecting whether a price movement is an outlier or falls within a normal range of volatility.

Advanced Dynamic Threshold RSI [Elysian_Mind]Advanced Dynamic Threshold RSI Indicator
Overview
The Advanced Dynamic Threshold RSI Indicator is a powerful tool designed for traders seeking a unique approach to RSI-based signals. This indicator combines traditional RSI analysis with dynamic threshold calculation and optional Bollinger Bands to generate weighted buy and sell signals.
Features
Dynamic Thresholds: The indicator calculates dynamic thresholds based on market volatility, providing more adaptive signal generation.
Performance Analysis: Users can evaluate recent price performance to further refine signals. The script calculates the percentage change over a specified lookback period.
Bollinger Bands Integration: Optional integration of Bollinger Bands for additional confirmation and visualization of potential overbought or oversold conditions.
Customizable Settings: Traders can easily customize key parameters, including RSI length, SMA length, lookback bars, threshold multiplier, and Bollinger Bands parameters.
Weighted Signals: The script introduces a unique weighting mechanism for signals, reducing false positives and improving overall reliability.
Underlying Calculations and Methods
1. Dynamic Threshold Calculation:
The heart of the Advanced Dynamic Threshold RSI Indicator lies in its ability to dynamically calculate thresholds based on multiple timeframes. Let's delve into the technical details:
RSI Calculation:
For each specified timeframe (1-hour, 4-hour, 1-day, 1-week), the Relative Strength Index (RSI) is calculated using the standard 14-period formula.
SMA of RSI:
The Simple Moving Average (SMA) is applied to each RSI, resulting in the smoothing of RSI values. This smoothed RSI becomes the basis for dynamic threshold calculations.
Dynamic Adjustment:
The dynamically adjusted threshold for each timeframe is computed by adding a constant value (5 in this case) to the respective SMA of RSI. This dynamic adjustment ensures that the threshold reflects changing market conditions.
2. Weighted Signal System:
To enhance the precision of buy and sell signals, the script introduces a weighted signal system. Here's how it works technically:
Signal Weighting:
The script assigns weights to buy and sell signals based on the crossover and crossunder events between RSI and the dynamically adjusted thresholds. If a crossover event occurs, the weight is set to 2; otherwise, it remains at 1.
Signal Combination:
The weighted buy and sell signals from different timeframes are combined using logical operations. A buy signal is generated if the product of weights from all timeframes is equal to 2, indicating alignment across timeframe.
3. Experimental Enhancements:
The Advanced Dynamic Threshold RSI Indicator incorporates experimental features for educational exploration. While not intended as proven strategies, these features aim to offer users a glimpse into unconventional analysis. Some of these features include Performance Calculation, Volatility Calculation, Dynamic Threshold Calculation Using Volatility, Bollinger Bands Module, Weighted Signal System Incorporating New Features.
3.1 Performance Calculation:
The script calculates the percentage change in the price over a specified lookback period (variable lookbackBars). This provides a measure of recent performance.
pctChange(src, length) =>
change = src - src
pctChange = (change / src ) * 100
recentPerformance1H = pctChange(close, lookbackBars)
recentPerformance4H = pctChange(request.security(syminfo.tickerid, "240", close), lookbackBars)
recentPerformance1D = pctChange(request.security(syminfo.tickerid, "1D", close), lookbackBars)
3.2 Volatility Calculation:
The script computes the standard deviation of the closing price to measure volatility.
volatility1H = ta.stdev(close, 20)
volatility4H = ta.stdev(request.security(syminfo.tickerid, "240", close), 20)
volatility1D = ta.stdev(request.security(syminfo.tickerid, "1D", close), 20)
3.3 Dynamic Threshold Calculation Using Volatility:
The dynamic thresholds for RSI are calculated by adding a multiplier of volatility to 50.
dynamicThreshold1H = 50 + thresholdMultiplier * volatility1H
dynamicThreshold4H = 50 + thresholdMultiplier * volatility4H
dynamicThreshold1D = 50 + thresholdMultiplier * volatility1D
3.4 Bollinger Bands Module:
An additional module for Bollinger Bands is introduced, providing an option to enable or disable it.
// Additional Module: Bollinger Bands
bbLength = input(20, title="Bollinger Bands Length")
bbMultiplier = input(2.0, title="Bollinger Bands Multiplier")
upperBand = ta.sma(close, bbLength) + bbMultiplier * ta.stdev(close, bbLength)
lowerBand = ta.sma(close, bbLength) - bbMultiplier * ta.stdev(close, bbLength)
3.5 Weighted Signal System Incorporating New Features:
Buy and sell signals are generated based on the dynamic threshold, recent performance, and Bollinger Bands.
weightedBuySignal = rsi1H > dynamicThreshold1H and rsi4H > dynamicThreshold4H and rsi1D > dynamicThreshold1D and crossOver1H
weightedSellSignal = rsi1H < dynamicThreshold1H and rsi4H < dynamicThreshold4H and rsi1D < dynamicThreshold1D and crossUnder1H
These features collectively aim to provide users with a more comprehensive view of market dynamics by incorporating recent performance and volatility considerations into the RSI analysis. Users can experiment with these features to explore their impact on signal accuracy and overall indicator performance.
Indicator Placement for Enhanced Visibility
Overview
The design choice to position the "Advanced Dynamic Threshold RSI" indicator both on the main chart and beneath it has been carefully considered to address specific challenges related to visibility and scaling, providing users with an improved analytical experience.
Challenges Faced
1. Differing Scaling of RSI Results:
RSI values for different timeframes (1-hour, 4-hour, and 1-day) often exhibit different scales, especially in markets like gold.
Attempting to display these RSIs on the same chart can lead to visibility issues, as the scaling differences may cause certain RSI lines to appear compressed or nearly invisible.
2. Candlestick Visibility vs. RSI Scaling:
Balancing the visibility of candlestick patterns with that of RSI values posed a unique challenge.
A single pane for both candlesticks and RSIs may compromise the clarity of either, particularly when dealing with assets that exhibit distinct volatility patterns.
Design Solution
Placing the buy/sell signals above/below the candles helps to maintain a clear association between the signals and price movements.
By allocating RSIs beneath the main chart, users can better distinguish and analyze the RSI values without interference from candlestick scaling.
Doubling the scaling of the 1-hour RSI (displayed in blue) addresses visibility concerns and ensures that it remains discernible even when compared to the other two RSIs: 4-hour RSI (orange) and 1-day RSI (green).
Bollinger Bands Module is optional, but is turned on as default. When the module is turned on, the users can see the upper Bollinger Band (green) and lower Bollinger Band (red) on the main chart to gain more insight into price actions of the candles.
User Flexibility
This dual-placement approach offers users the flexibility to choose their preferred visualization:
The main chart provides a comprehensive view of buy/sell signals in relation to candlestick patterns.
The area beneath the chart accommodates a detailed examination of RSI values, each in its own timeframe, without compromising visibility.
The chosen design optimizes visibility and usability, addressing the unique challenges posed by differing RSI scales and ensuring users can make informed decisions based on both price action and RSI dynamics.
Usage
Installation
To ensure you receive updates and enhancements seamlessly, follow these steps:
Open the TradingView platform.
Navigate to the "Indicators" tab in the top menu.
Click on "Community Scripts" and search for "Advanced Dynamic Threshold RSI Indicator."
Select the indicator from the search results and click on it to add to your chart.
This ensures that any future updates to the indicator can be easily applied, keeping you up-to-date with the latest features and improvements.
Review Code
Open TradingView and navigate to the Pine Editor.
Copy the provided script.
Paste the script into the Pine Editor.
Click "Add to Chart."
Configuration
The indicator offers several customizable settings:
RSI Length: Defines the length of the RSI calculation.
SMA Length: Sets the length of the SMA applied to the RSI.
Lookback Bars: Determines the number of bars used for recent performance analysis.
Threshold Multiplier: Adjusts the multiplier for dynamic threshold calculation.
Enable Bollinger Bands: Allows users to enable or disable Bollinger Bands integration.
Interpreting Signals
Buy Signal: Generated when RSI values are above dynamic thresholds and a crossover occurs.
Sell Signal: Generated when RSI values are below dynamic thresholds and a crossunder occurs.
Additional Information
The indicator plots scaled RSI lines for 1-hour, 4-hour, and 1-day timeframes.
Users can experiment with additional modules, such as machine-learning simulation, dynamic real-life improvements, or experimental signal filtering, depending on personal preferences.
Conclusion
The Advanced Dynamic Threshold RSI Indicator provides traders with a sophisticated tool for RSI-based analysis, offering a unique combination of dynamic thresholds, performance analysis, and optional Bollinger Bands integration. Traders can customize settings and experiment with additional modules to tailor the indicator to their trading strategy.
Disclaimer: Use of the Advanced Dynamic Threshold RSI Indicator
The Advanced Dynamic Threshold RSI Indicator is provided for educational and experimental purposes only. The indicator is not intended to be used as financial or investment advice. Trading and investing in financial markets involve risk, and past performance is not indicative of future results.
The creator of this indicator is not a financial advisor, and the use of this indicator does not guarantee profitability or specific trading outcomes. Users are encouraged to conduct their own research and analysis and, if necessary, consult with a qualified financial professional before making any investment decisions.
It is important to recognize that all trading involves risk, and users should only trade with capital that they can afford to lose. The Advanced Dynamic Threshold RSI Indicator is an experimental tool that may not be suitable for all individuals, and its effectiveness may vary under different market conditions.
By using this indicator, you acknowledge that you are doing so at your own risk and discretion. The creator of this indicator shall not be held responsible for any financial losses or damages incurred as a result of using the indicator.
Kind regards,
Ely

% Chg LinesThis indicator is designed to visually represent percentage changes from the previous day's close.
1. Percentage Change Lines : The core function of the script is to apply lines to the chart that represent specific percentage changes from the previous day's closing price. It can display up to five different percentage levels, ranging from 0.50% to 2.50% by default but the user can set any value that they wish. This feature allows users to quickly gauge how the current price is performing relative to the previous day's close.
2. Customizable Inputs : Users have the flexibility to customize the script through various inputs. This includes the option to display lines only for the current trading day (`todayonly`), and to select which specific percentage change levels to plot (`show_pct1` to `show_pct5`).
3. Dynamic Calculation : The script dynamically calculates the previous day's closing price by making a request security call and uses it as a baseline to determine the percentage change levels.
% Change = (y2-y1)/y1*100
4. Positive and Negative Changes : It plots both positive and negative percentage changes, allowing users to see areas of potential resistance and support based on historical closing data.
This script is can be used by all traders for any market. The trader might have to adjust the %Chg input amount, but most financial instruments do see "reactions" at certain % intervals.

Candle Color OverlayDescription:
The Candle Color Overlay (CCO) indicator is a powerful tool for visualizing price movements on a chart. It overlays the chart with customizable colors, highlighting bullish and bearish candles based on their open and close values. This indicator helps traders quickly identify the direction of price movements and assess market sentiment.
How it Works:
The Candle Color Overlay indicator performs the following steps:
1. Calculation of the OHLC (Open, High, Low, Close) values for each candle based on the selected timeframe.
2. Classification of each candle as bullish or bearish:
- A bullish candle is when the closing price is greater than or equal to the opening price.
- A bearish candle is when the closing price is lower than the opening price.
3. Overlaying colors on the chart:
- The indicator applies a bullish color to the background when candles are classified as bullish and a bearish color to the background when candles classified as bearish. This overlay provides a visual representation of price movements.
4. Optional display of price movement labels:
- If enabled, the indicator shows a text label at the bottom of the current candle, indicating the percentage increase or decrease in price during a bullish or bearish background period.
Usage:
To effectively use the Candle Color Overlay indicator, follow these steps:
1. Add the indicator to your chart from the list of available indicators.
2. Configure the indicator's inputs:
- Choose the desired color for bullish candles using the "Bullish Color" input.
- Select the preferred color for bearish candles using the "Bearish Color" input.
- Specify the timeframe for analysis using the "Time Frame" input (default is 1 hour).
- Optionally enable the "Show Background Price Movement" input to display the percentage increase or decrease in price during each background period.
3. Analyze the colored overlay:
- Bullish colors represent candles where the closing price is greater than or equal to the opening price, indicating bullish sentiment.
- Bearish colors represent candles where the closing price is lower than the opening price, indicating bearish sentiment.
4. If enabled, observe the price movement labels
5. Combine the insights from the colored overlay and the price movement labels with other technical analysis tools, such as trend lines, support and resistance levels, or candlestick patterns, to make well-informed trading decisions.

Price Percentage Shaded CandlesDescription:
The Price Percentage Shaded Candles indicator (P%SC) is a technical analysis tool designed to represent price candles on a chart with shading intensity based on the percentage change between the open and close prices. This overlay indicator enhances visual analysis by providing a visual representation of price movement intensity.
How it Works:
The P%SC indicator calculates the percentage change between the open and close prices of each candle. It then determines the shading intensity of the price candles based on this percentage change. Higher percentage changes result in darker shading, while lower percentage changes result in lighter shading.
Usage:
To effectively utilize the Price Percentage Shaded Candles indicator, follow these steps:
1. Apply the Price Percentage Shaded Candles indicator to your chart by adding it from the available indicators.
2. Configure the indicator's inputs:
- Specify the color for bullish candles using the "Bullish Color" input.
- Specify the color for bearish candles using the "Bearish Color" input.
3. Observe the shaded candles on the chart:
- Bullish candles are colored with the specified bullish color and shaded according to the percentage change.
- Bearish candles are colored with the specified bearish color and shaded according to the percentage change.
4. Interpret the shaded candles:
- Darker shading indicates a higher percentage change and stronger price movement during the corresponding candle.
- Lighter shading indicates a lower percentage change and weaker price movement during the corresponding candle.
5. Combine the analysis of shaded candles with other technical analysis tools, such as trend lines, support and resistance levels, or candlestick patterns, to identify potential trade setups.
6. Implement appropriate risk management strategies, including setting stop-loss orders and position sizing, to manage your trades effectively and protect your capital.
Note: The Price Percentage Shaded Candles indicator provides insights into the shading intensity of price candles based on percentage changes. However, it is recommended to use this indicator in conjunction with other technical analysis tools and perform thorough analysis before making trading decisions.
Price Percentage Breakout by Time PeriodDescription:
The Price Percentage Breakout by Time Period (P%BTP) indicator is a technical analysis tool designed to identify potential breakout signals based on the percentage change in price over a specified lookback period. It helps traders identify significant price movements that exceed a user-defined threshold, indicating potential trading opportunities.
How it Works:
The P%BTP indicator calculates the percentage change between the open and close prices of each candle. It compares this percentage change to the highest percentage change observed over the specified lookback period. When the percentage change exceeds or equals this highest value, it indicates a potential breakout signal. The indicator colors the bars on the chart based on whether it's a bullish or bearish breakout.
Usage:
To effectively utilize the Price Percentage Breakout by Time Period indicator, follow these steps:
1. Apply the P%BTP indicator to your chart by adding it from the available indicators.
2. Customize the input settings to suit your preferences. You can define the lookback period, which determines the number of bars used for calculating the percentage change, as well as choose colors for bullish and bearish breakouts.
3. Observe the bars on the chart:
- Bars highlighted in the bullish color indicate potential bullish breakout signals.
- Bars highlighted in the bearish color indicate potential bearish breakout signals.
4. Interpret the breakout signals:
- A bullish breakout signal occurs when the percentage change in price exceeds or equals the highest percentage change observed over the lookback period, indicating a potential upward movement.
- A bearish breakout signal occurs when the percentage change in price exceeds or equals the highest percentage change observed over the lookback period, indicating a potential downward movement.
5. Consider additional analysis:
- Combine the breakout signals from the P%BTP indicator with other technical analysis tools, such as support and resistance levels, trend lines, or candlestick patterns, to confirm potential trade setups.
6. Implement appropriate risk management strategies, including setting stop-loss orders and position sizing, to manage your trades effectively and protect your capital.
Note: The Price Percentage Breakout by Time Period indicator provides insights into potential breakout signals based on the percentage change in price over a specified lookback period. However, it is recommended to use this indicator in conjunction with other technical analysis tools and perform thorough analysis before making trading decisions.

Price Percentage Breakout by Chosen PercentageDescription:
The Price Percentage Breakout indicator (P%B) is a technical analysis tool designed to identify potential breakout signals based on percentage changes in price. It helps traders identify significant price movements that exceed a specified threshold, indicating potential trading opportunities.
How it Works:
The Price Percentage Breakout indicator calculates the percentage change between the open and close prices of each candle. It compares this percentage change to a user-defined threshold to determine if a breakout has occurred. When the percentage change exceeds the threshold, indicating a significant price movement, the indicator highlights the breakout on the chart. Additionally alerts can be created by the user that display the percentage of the breakout.
Usage:
To effectively utilize the Price Percentage Breakout indicator, follow these steps:
1. Apply the P%B indicator to your chart by adding it from the available indicators.
2. Customize the input settings to suit your preferences. You can choose the color for highlighting the breakout and set the percentage threshold for detecting breakouts.
3. Observe the bars on the chart:
- Bars highlighted in the chosen color indicate potential breakout signals.
4. Interpret the breakout signals:
- A breakout signal occurs when the percentage change in price exceeds the specified threshold. This suggests a significant price movement.
5. Consider additional analysis:
- Combine the breakout signals from the Price Percentage Breakout indicator with other technical analysis tools, such as support and resistance levels, trend lines, or candlestick patterns, to confirm potential trade setups.
6. Implement appropriate risk management strategies, including setting stop-loss orders and position sizing, to manage your trades effectively and protect your capital.
Note: The Price Percentage Breakout indicator provides insights into potential breakout signals based on percentage changes in price. However, it is recommended to use this indicator in conjunction with other technical analysis tools and perform thorough analysis before making trading decisions.
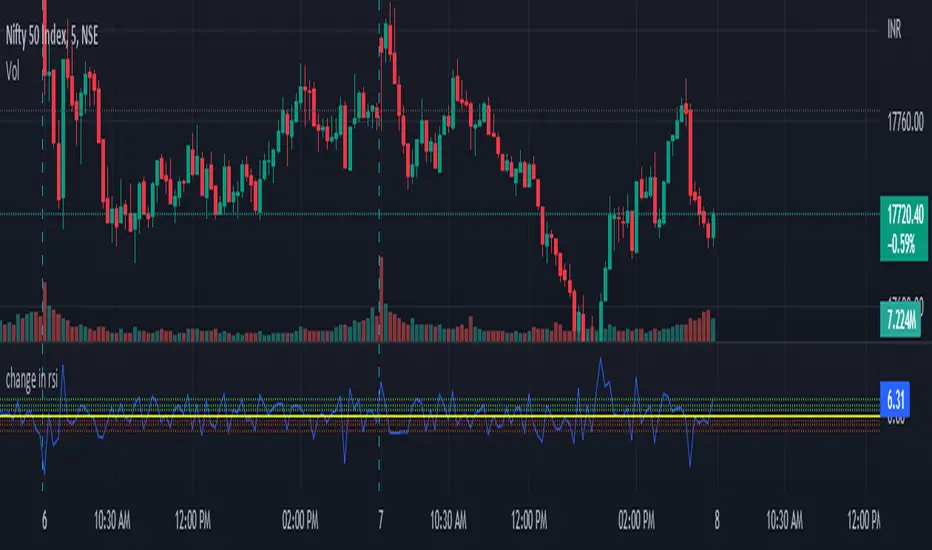
change in rsiThis indicator will show how fast the rsi of a symbol is changing. you can see this as a differentiation function on rsi .
this will show the change in rsi in percentage.
Ex: suppose the rsi of a symbol at present is 60 and the previous value of rsi was 52,
as you can see the rsi has increased, which is a sign of the symbol being bullish .
this indicator will tell by what percentage the rsi of the symbol has increased or decreased.
for the above example, the change in rsi is 15.38% increase.
this is set to default chart time-frame.
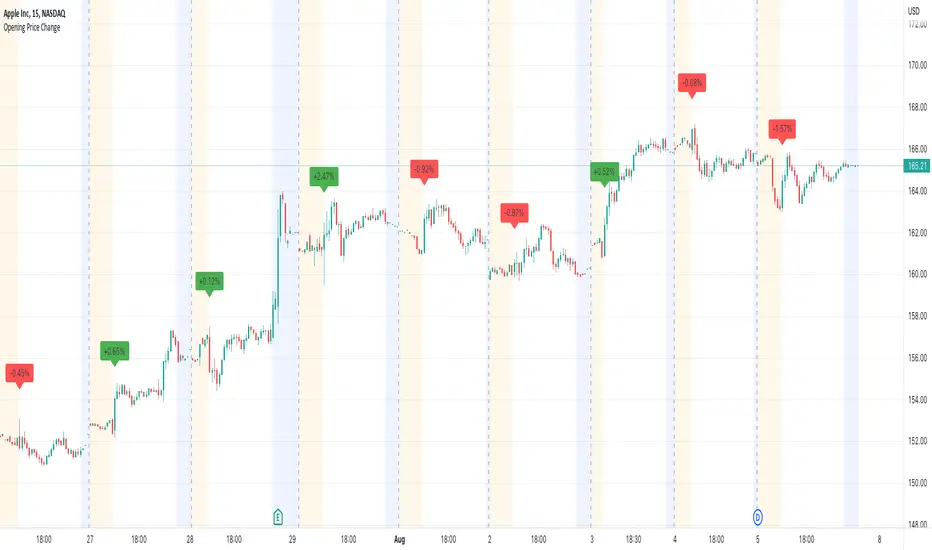
Opening Price ChangeThis script shows the change from the market opening price to the market closing price of the previous day in percent.
With this you can quickly get an overview of historical data for the change of the respective day.
Important: the market closing price is always used for the calculation and not the pre/post market price.
The label with the change value is always placed above the first opens regular market bar. If the change is positive, the label is draw with a green background, is the change is negative you will have a red background.
10yr, 20yr, 30yr Averages: Month/Month % Change; SeasonalityCalculates 10yr, 20yr and 30yr averages for month/month % change
~shows seasonal tendencies in assets (best in commodities). In above chart: August is a seasonally bullish month for Gold: All the averages agree. And January is the most seasonally bullish month.
~averages represent current month/previous month. i.e. Jan22 average % change represents whole of jan22 / whole of dec21
~designed for daily timeframe only: I found calling monthly data too buggy to work with, and I thought weekly basis may be less precise (though it would certainly reduce calculation time!)
~choose input year, and see the previous 10yrs of monthly % change readings, and previous 10yrs Average, 20yr Average, 30yr Average for the respective month. Labels table is always anchored to input year.
~user inputs: colors | label sizes | decimal places | source expression for averages | year | show/hide various sections
~multi-yr averges always print, i.e if only 10yrs history => 10yr Av = 20yr Av = 30yr Av. 'History Available' label helps here.
Based on my previously publised script: "Month/Month Percentage % Change, Historical; Seasonal Tendency"
Publishing this as seperate indicator because:
~significantly slower to load (around 13 seconds)
~non-premium users may not have the historical bars available to use 20yr or 30yr averages =>> prefer the lite/speedier version
~~tips~~
~after loading, touch the new right scale; then can drag the table as you like and seperate it from price chart
##Debugging/tweaking##
Comment-in the block at the end:
~test/verifify specific array elements elements.
~see the script calculation/load time
~~other ideas ~~
~could tweak the array.slice values in lines 313 - 355 to show the last 3 consecutive 10yr averages instead (i.e. change 0, 10 | 0,20 | 0, 30 to 0, 10 | 10, 20 | 20,30)
~add 40yr average by adding another block to each of the array functions, and tweaking the respective labels after line 313 (though this would likely add another 5 seconds to the load time)
~use alternative method for getting obtaining multi-year values from individual month elements. I used array.avg. You could try array.median, array.mode, array.variance, array.max, array.min (lines 313-355)

Big Moves IndicatorThis indicator marks big candles (major moves in percentage) on the chart and, more importantly, you will be able to add an alert to them.
Indicator checks if the height (high - low) of last closed candle is bigger than the specified percent of the close of its previous. No matter if the last candle is red or green, the indicator compares the move amount with the previous close. Accordingly, seeing a mark above or below a candle means that there is a large movement in it compared to its previous candles.
Default percentage is 5 but you can change it as you with in the settings and I want to underline that the indicator ignores the non-closed candle at the moment.

3D GATOR %HLThis indicator tracks the 3 day trading bots and measures the high and the low (%).
Usually a trend can change or continue every 3 days.
When volatility decreases and both values are the same gator is going to open its jaws so it's a good time to open a position long. Avoid shorts during low volatility.
On the other hand when volatility increases, and gator has its jaws wide open is a good time to look for shorts.
That's pretty much it.
This indicator was designed by me and created by Marketwatcher.

% Price change (by OP)To visually evaluate the percentage change in price over any time period
This handsome indicator shows exact % price change at each candle by displaying a circle at the level of the change. To read numerical value, point at the circle of the relevant bar corresponding to the candle you are interested in, and look at the scale.

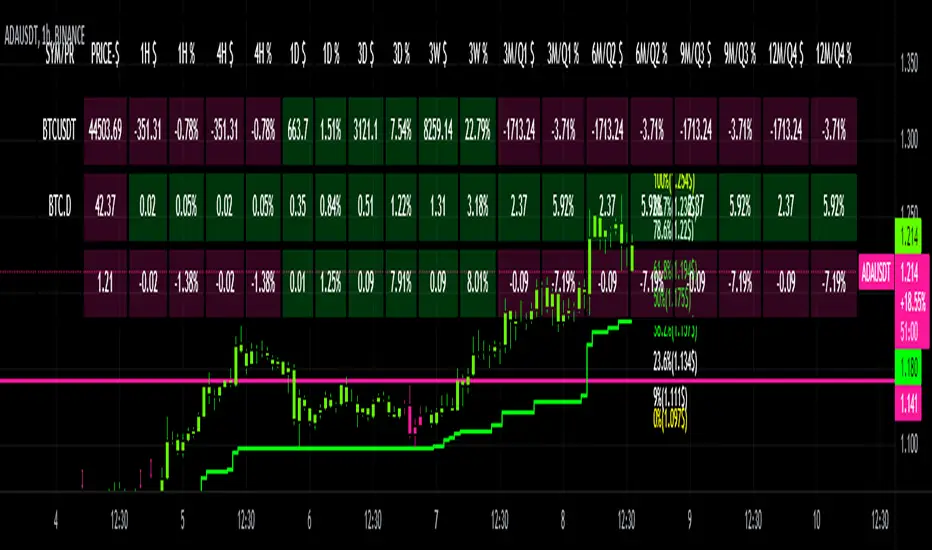
CRYPTO DASHBOARD Gs₿A Simple Crypto Dashboard/Screener which indicates the Price and percentage changes for the Given Period of time i.e for 1 Hr ,4 Hrs, 1 Day, 3 Days, 3 Weeks and 3 - 12 Months. By Default it displays #BTC and its Dominance and current trading pair Price and % changes.
Percentage Change ToolHere is a script that will allow you to see the percentage change from any entry to the current price. You will manually enter the price you bought at in the indicator price menu. The indicator will calculate and display the percentage difference(change) between the buy price and current price, in REAL TIME.
See Screenshot (TOP_RIGHT) for indicator.
Double Click on the Yellow Block and insert your entry price. Click OK. Indicator will display percentage.

Roc Mean Reversion (ValueRay)This Indicator shows the Absolute Rate of Change in correlation to its Moving Average.
Values over 3 (gray dotted line) can savely be considered as a breakout; values over 4.5 got a high mean-reverting chance (red dotted line).
This Indicator can be used in all timeframes, however, i recommend to use it <30m, when you want search for meaningful Mean-Reverting Signals.
Please like, share and subscribe. With your love, im encouraged to write and publish more Indicators.

Screener Price Percentage ChangeA screener that displays price percentage change in actual chart timeframe and the default Daily, Weekly and Monthly.
The actual time frame also displays last value percentage change.
For example, if actual timeframe is "Monthly, it is going to display also the last "previous Monthly percentage price change.
Can select 3 more assets to display.
Full control of Panel position and size.
A modified version of @Mohamed3nan
Para el Shiaks
