OPEN-SOURCE SCRIPT
Telah dikemas kini Normal Distribution Asymmetry & Volatility Zones
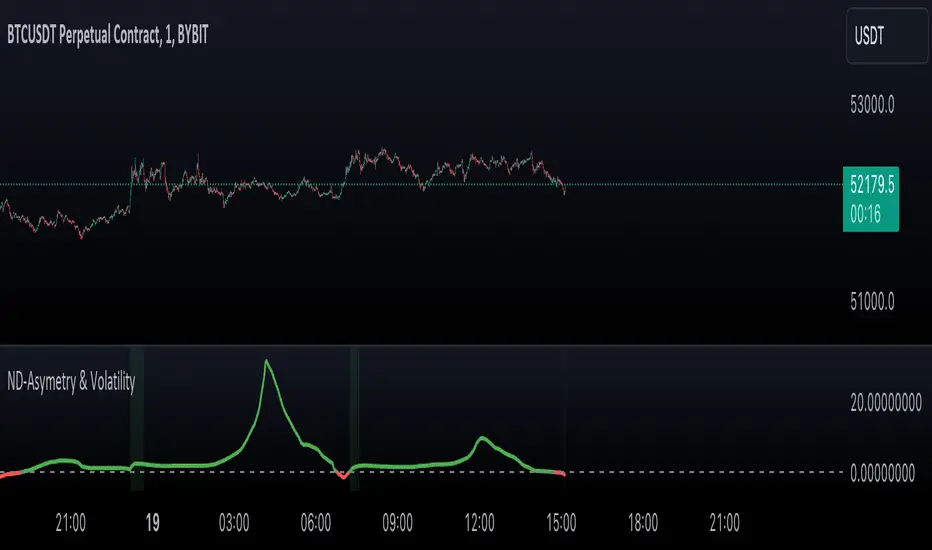
Normal Distribution Asymmetry & Volatility Zones Indicator provides insights into the skewness of a price distribution and identifies potential volatility zones in the market. The indicator calculates the skewness coefficient, indicating the asymmetry of the price distribution, and combines it with a measure of volatility to define buy and sell zones.
By combining skewness analysis and volatility thresholds, this indicator offers traders a unique perspective on potential market movements, helping them make informed trading decisions. Please note that trading involves risks, and this indicator should be used in conjunction with other analysis and risk management techniques.
- The key features of this indicator include:
- Skewness Calculation: It calculates the skewness coefficient, a statistical measure that reveals whether the price distribution is skewed to the left (negative skewness) or right (positive skewness).
- Volatility Zones: Based on the skewness and a user-defined volatility threshold, the indicator identifies buy and sell zones where potential price movements may occur. Buy zones are marked when skewness is negative and prices are below a volatility threshold. Sell zones are marked when skewness is positive and prices are above the threshold.
- Signal Source Selection: Traders can select the source of price data for analysis, allowing flexibility in their trading strategy.
- Customizable Parameters: Users can adjust the length of the distribution, the volatility threshold, and other parameters to tailor the indicator to their specific trading preferences and market conditions.
- Visual Signals: Buy and sell zones are visually displayed on the chart, making it easy to identify potential trade opportunities.
- Background Color: The indicator changes the background color of the chart to highlight significant zones, providing a clear visual cue for traders.
By combining skewness analysis and volatility thresholds, this indicator offers traders a unique perspective on potential market movements, helping them make informed trading decisions. Please note that trading involves risks, and this indicator should be used in conjunction with other analysis and risk management techniques.
Nota Keluaran
Modified the maximum value for the length to 500Nota Keluaran
Adjusted the maximum value of "Distribution Length" and implemented some minor code modifications.Nota Keluaran
Updated the color scheme to enhance the indicator's intuitiveness.Nota Keluaran
- Code refactor
- Added tooltips for input variables
Nota Keluaran
- Added an option to switch between raw and normalized skewness values through the 'Plot normalized' setting, offering users more flexibility in market analysis.
- Enhanced the skewness calculation by incorporating the normalization process, which compares the current skewness value to a moving average of recent skewness values.
- Introduced normalization length parameter allowing users to define the period for normalization, optimizing signal accuracy based on individual trading strategies.
- Incorporated an indicator description as comments within the code to provide better context and understanding
Nota Keluaran
- Moved "Normal Distribution Asymmetry & Volatility Zones Indicator" calculations to the "NormalDistributionFunctions" library for easier integration.
- Enabled easy integration of the "skewness" function for user scripts, enhancing custom analysis.
Skrip sumber terbuka
Dalam semangat sebenar TradingView, pencipta skrip ini telah menjadikannya sumber terbuka supaya pedagang dapat menilai dan mengesahkan kefungsiannya. Terima kasih kepada penulis! Walaupun anda boleh menggunakannya secara percuma, ingat bahawa menerbitkan semula kod ini adalah tertakluk kepada Peraturan Dalaman kami.
Penafian
Maklumat dan penerbitan adalah tidak dimaksudkan untuk menjadi, dan tidak membentuk, nasihat untuk kewangan, pelaburan, perdagangan dan jenis-jenis lain atau cadangan yang dibekalkan atau disahkan oleh TradingView. Baca dengan lebih lanjut di Terma Penggunaan.