PROTECTED SOURCE SCRIPT
Volume & ATR Projection Tracker w/ Table & Alerts
# README: Volume & ATR Projection Tracker (Pine Script Indicator)
## Overview
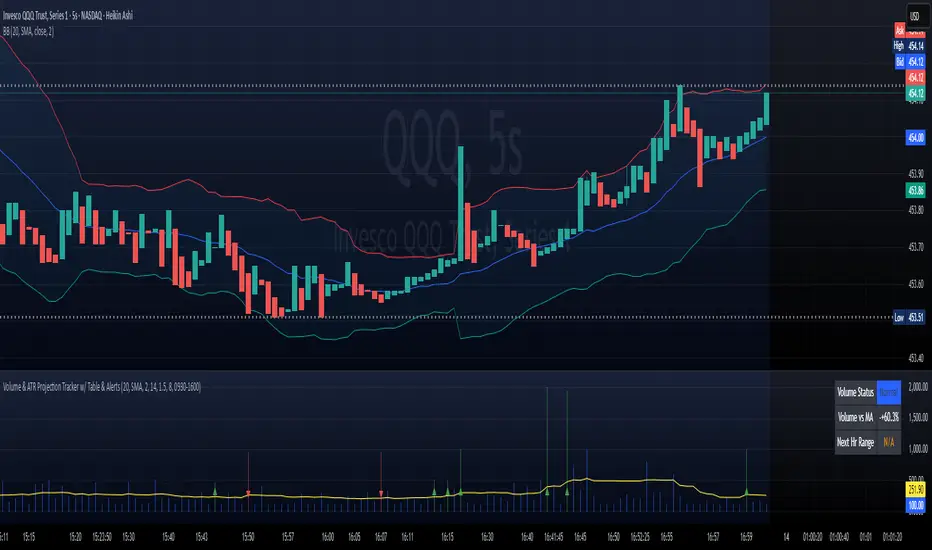
This Pine Script indicator for TradingView is designed to help traders analyze volume activity and potential short-term price volatility. It plots volume bars, calculates a moving average of volume, highlights unusual volume spikes (differentiating between up and down bars), and projects potential price ranges for upcoming hours based on Average True Range (ATR). It also provides a status table and configurable alerts.
**Disclaimer:** This indicator provides informational analysis and projections based on historical data and volatility. It does **not** provide guaranteed price predictions or financial advice. Trading involves substantial risk. Always do your own research and consult with a qualified financial advisor.
## Features
* **Volume Plotting:** Displays volume as a histogram in a separate panel.
* **Volume Moving Average:** Calculates and plots a configurable MA (SMA, EMA, WMA) of volume.
* **Unusual Volume Detection:** Identifies bars where volume significantly exceeds its moving average (based on a user-defined multiplier).
* **Differentiated Volume Analysis:**
* Colors volume bars differently based on whether unusual volume occurred on an up-bar (Close > Open), down-bar (Close < Open), or neutral bar (Close == Open).
* Plots different spike markers (up/down triangles) on the price chart for unusual volume on up/down bars.
* **ATR Volatility Projections:**
* Calculates the Average True Range (ATR) as a measure of recent volatility.
* Projects a potential price range (Close +/- ATR \* Multiplier) for a specified number of future hours.
* Plots these ranges as dashed lines and labels on the price chart.
* **Important:** These are volatility-based *ranges*, not directional predictions.
* **Status Table:** Displays a concise summary table on the chart including:
* Current Volume Status (Normal, High (Up), High (Down), High (Neut)).
* Current Volume compared to its MA (as a percentage).
* The projected ATR range for the next hour.
* **Configurable Alerts:** Provides alert conditions for:
* Unusual Volume detection.
* Volume crossing above its MA.
* Volume crossing below its MA.
* **Customizable Inputs:** Allows users to configure MA settings, volume threshold, ATR settings, projection hours, trading session times, and colors.
## How it Works
1. **Volume Analysis:**
* Calculates a Moving Average (SMA, EMA, or WMA) of the volume over a specified length (`MA Length`).
* Compares the current bar's volume to this MA. If `Volume > MA * Unusual Vol Multiplier`, the volume is flagged as "unusual".
* Checks if the unusual volume occurred on a bar where `Close > Open` (Up), `Close < Open` (Down), or `Close == Open` (Neutral).
* Colors the volume bars and plots spike markers based on this differentiated status.
2. **ATR Projections:**
* Calculates the ATR over a specified length (`ATR Length`).
* At the start of each hour *within the defined Trading Session*:
* Calculates an upper projection level: `Current Close + (Current ATR * ATR Multiplier)`.
* Calculates a lower projection level: `Current Close - (Current ATR * ATR Multiplier)`.
* Stores these levels for the specified number of `Projection Hours Ahead`.
* Draws dashed lines and labels on the price chart representing these hourly ranges for the future, but only if they are within TradingView's 500-bar drawing limit from the current bar.
3. **Status Table:**
* Updates on the last bar of the chart.
* Displays the current differentiated volume status, the percentage difference between current volume and its MA, and the calculated ATR range for the *next* hour.
4. **Alerts:**
* Uses `alertcondition()` to create trigger conditions based on `unusualVolumeBase`, `vol_cross_above`, and `vol_cross_below`. Users can create alerts based on these conditions in the TradingView UI.
## Input Settings
The indicator settings are organized into groups:
**Group 1: Volume Analysis Settings**
* **MA Length:** (Default: 20) Number of bars for the volume MA calculation.
* **MA Type:** (Default: SMA) Type of moving average (SMA, EMA, WMA).
* **Unusual Vol Multiplier:** (Default: 2.0) Threshold for detecting unusual volume (Volume > MA * Multiplier).
* **Show Volume Spikes:** (Default: true) Toggle visibility of triangle markers on the price chart.
* **Show Volume MA:** (Default: true) Toggle visibility of the MA line on the volume panel.
**Group 2: ATR Projection Settings**
* **ATR Length:** (Default: 14) Number of bars for the ATR calculation.
* **ATR Multiplier:** (Default: 1.5) Factor applied to ATR to determine the projection range width. Higher values create wider ranges.
* **Projection Hours Ahead:** (Default: 8) How many hours forward to calculate and display projections.
* **Show Projections:** (Default: true) Toggle visibility of projection lines and labels on the price chart.
**Group 3: Session & Colors**
* **Trading Session:** (Default: "0930-1600") Defines the hours during which projections are calculated. **Crucial:** Format is HHMM-HHMM based on the exchange timezone (see Timezone Note below).
* **Normal Vol Color:** (Default: blue) Color for volume bars when volume is not unusual.
* **Volume MA Color:** (Default: yellow) Color of the volume MA line.
* **Unusual Vol (Up Bar) Color:** (Default: light green) Color for unusual volume bars where Close > Open.
* **Unusual Vol (Down Bar) Color:** (Default: light red) Color for unusual volume bars where Close < Open.
* **Unusual Vol (Neutral Bar) Color:** (Default: light gray) Color for unusual volume bars where Close == Open.
* **Projection Line Color:** (Default: orange) Color of the dashed projection range lines.
* **Proj Label Bg Color:** (Default: semi-transparent gray) Background color for projection labels.
* **Proj Label Text Color:** (Default: white) Text color for projection labels.
## Timezone Note
The `Trading Session` input relies on a timezone setting within the `is_in_session` function in the code (currently hardcoded to `"UTC-4"` as an example for US Eastern Time). **You may need to edit the script code** to change this timezone string (e.g., `"America/New_York"`, `"Europe/London"`, `"Asia/Tokyo"`) to match the exchange time of the instrument you are trading. Consult Pine Script documentation for valid timezone strings.
## Limitations
* **Drawing Limit:** TradingView limits drawing objects (lines, labels) to a maximum of ~500 bars into the future from the current bar. On lower timeframes, the script automatically stops drawing projections that exceed this limit.
* **Projection vs. Prediction:** The ATR ranges are based on past volatility and are *not* price predictions. The market can easily move outside these projected ranges.
* **Alerts:** Alerts for price crossing the projected future levels are not implemented due to technical complexity in Pine Script.
## Disclaimer
Trading financial markets involves substantial risk of loss and is not suitable for all investors. The information provided by this indicator is for educational and informational purposes only and does not constitute financial advice, investment advice, trading advice, or any other sort of advice. You should not make any investment decision based solely on the information provided by this indicator. Past performance is not indicative of future results.
## Overview
This Pine Script indicator for TradingView is designed to help traders analyze volume activity and potential short-term price volatility. It plots volume bars, calculates a moving average of volume, highlights unusual volume spikes (differentiating between up and down bars), and projects potential price ranges for upcoming hours based on Average True Range (ATR). It also provides a status table and configurable alerts.
**Disclaimer:** This indicator provides informational analysis and projections based on historical data and volatility. It does **not** provide guaranteed price predictions or financial advice. Trading involves substantial risk. Always do your own research and consult with a qualified financial advisor.
## Features
* **Volume Plotting:** Displays volume as a histogram in a separate panel.
* **Volume Moving Average:** Calculates and plots a configurable MA (SMA, EMA, WMA) of volume.
* **Unusual Volume Detection:** Identifies bars where volume significantly exceeds its moving average (based on a user-defined multiplier).
* **Differentiated Volume Analysis:**
* Colors volume bars differently based on whether unusual volume occurred on an up-bar (Close > Open), down-bar (Close < Open), or neutral bar (Close == Open).
* Plots different spike markers (up/down triangles) on the price chart for unusual volume on up/down bars.
* **ATR Volatility Projections:**
* Calculates the Average True Range (ATR) as a measure of recent volatility.
* Projects a potential price range (Close +/- ATR \* Multiplier) for a specified number of future hours.
* Plots these ranges as dashed lines and labels on the price chart.
* **Important:** These are volatility-based *ranges*, not directional predictions.
* **Status Table:** Displays a concise summary table on the chart including:
* Current Volume Status (Normal, High (Up), High (Down), High (Neut)).
* Current Volume compared to its MA (as a percentage).
* The projected ATR range for the next hour.
* **Configurable Alerts:** Provides alert conditions for:
* Unusual Volume detection.
* Volume crossing above its MA.
* Volume crossing below its MA.
* **Customizable Inputs:** Allows users to configure MA settings, volume threshold, ATR settings, projection hours, trading session times, and colors.
## How it Works
1. **Volume Analysis:**
* Calculates a Moving Average (SMA, EMA, or WMA) of the volume over a specified length (`MA Length`).
* Compares the current bar's volume to this MA. If `Volume > MA * Unusual Vol Multiplier`, the volume is flagged as "unusual".
* Checks if the unusual volume occurred on a bar where `Close > Open` (Up), `Close < Open` (Down), or `Close == Open` (Neutral).
* Colors the volume bars and plots spike markers based on this differentiated status.
2. **ATR Projections:**
* Calculates the ATR over a specified length (`ATR Length`).
* At the start of each hour *within the defined Trading Session*:
* Calculates an upper projection level: `Current Close + (Current ATR * ATR Multiplier)`.
* Calculates a lower projection level: `Current Close - (Current ATR * ATR Multiplier)`.
* Stores these levels for the specified number of `Projection Hours Ahead`.
* Draws dashed lines and labels on the price chart representing these hourly ranges for the future, but only if they are within TradingView's 500-bar drawing limit from the current bar.
3. **Status Table:**
* Updates on the last bar of the chart.
* Displays the current differentiated volume status, the percentage difference between current volume and its MA, and the calculated ATR range for the *next* hour.
4. **Alerts:**
* Uses `alertcondition()` to create trigger conditions based on `unusualVolumeBase`, `vol_cross_above`, and `vol_cross_below`. Users can create alerts based on these conditions in the TradingView UI.
## Input Settings
The indicator settings are organized into groups:
**Group 1: Volume Analysis Settings**
* **MA Length:** (Default: 20) Number of bars for the volume MA calculation.
* **MA Type:** (Default: SMA) Type of moving average (SMA, EMA, WMA).
* **Unusual Vol Multiplier:** (Default: 2.0) Threshold for detecting unusual volume (Volume > MA * Multiplier).
* **Show Volume Spikes:** (Default: true) Toggle visibility of triangle markers on the price chart.
* **Show Volume MA:** (Default: true) Toggle visibility of the MA line on the volume panel.
**Group 2: ATR Projection Settings**
* **ATR Length:** (Default: 14) Number of bars for the ATR calculation.
* **ATR Multiplier:** (Default: 1.5) Factor applied to ATR to determine the projection range width. Higher values create wider ranges.
* **Projection Hours Ahead:** (Default: 8) How many hours forward to calculate and display projections.
* **Show Projections:** (Default: true) Toggle visibility of projection lines and labels on the price chart.
**Group 3: Session & Colors**
* **Trading Session:** (Default: "0930-1600") Defines the hours during which projections are calculated. **Crucial:** Format is HHMM-HHMM based on the exchange timezone (see Timezone Note below).
* **Normal Vol Color:** (Default: blue) Color for volume bars when volume is not unusual.
* **Volume MA Color:** (Default: yellow) Color of the volume MA line.
* **Unusual Vol (Up Bar) Color:** (Default: light green) Color for unusual volume bars where Close > Open.
* **Unusual Vol (Down Bar) Color:** (Default: light red) Color for unusual volume bars where Close < Open.
* **Unusual Vol (Neutral Bar) Color:** (Default: light gray) Color for unusual volume bars where Close == Open.
* **Projection Line Color:** (Default: orange) Color of the dashed projection range lines.
* **Proj Label Bg Color:** (Default: semi-transparent gray) Background color for projection labels.
* **Proj Label Text Color:** (Default: white) Text color for projection labels.
## Timezone Note
The `Trading Session` input relies on a timezone setting within the `is_in_session` function in the code (currently hardcoded to `"UTC-4"` as an example for US Eastern Time). **You may need to edit the script code** to change this timezone string (e.g., `"America/New_York"`, `"Europe/London"`, `"Asia/Tokyo"`) to match the exchange time of the instrument you are trading. Consult Pine Script documentation for valid timezone strings.
## Limitations
* **Drawing Limit:** TradingView limits drawing objects (lines, labels) to a maximum of ~500 bars into the future from the current bar. On lower timeframes, the script automatically stops drawing projections that exceed this limit.
* **Projection vs. Prediction:** The ATR ranges are based on past volatility and are *not* price predictions. The market can easily move outside these projected ranges.
* **Alerts:** Alerts for price crossing the projected future levels are not implemented due to technical complexity in Pine Script.
## Disclaimer
Trading financial markets involves substantial risk of loss and is not suitable for all investors. The information provided by this indicator is for educational and informational purposes only and does not constitute financial advice, investment advice, trading advice, or any other sort of advice. You should not make any investment decision based solely on the information provided by this indicator. Past performance is not indicative of future results.
Skrip dilindungi
Skrip ini diterbitkan sebagai sumber tertutup. Akan tetapi, anda boleh menggunakannya secara bebas dan tanpa apa-apa had – ketahui lebih di sini.
Penafian
Maklumat dan penerbitan adalah tidak bertujuan, dan tidak membentuk, nasihat atau cadangan kewangan, pelaburan, dagangan atau jenis lain yang diberikan atau disahkan oleh TradingView. Baca lebih dalam Terma Penggunaan.