PROTECTED SOURCE SCRIPT
ICT MSS & Liquidity (fadi)

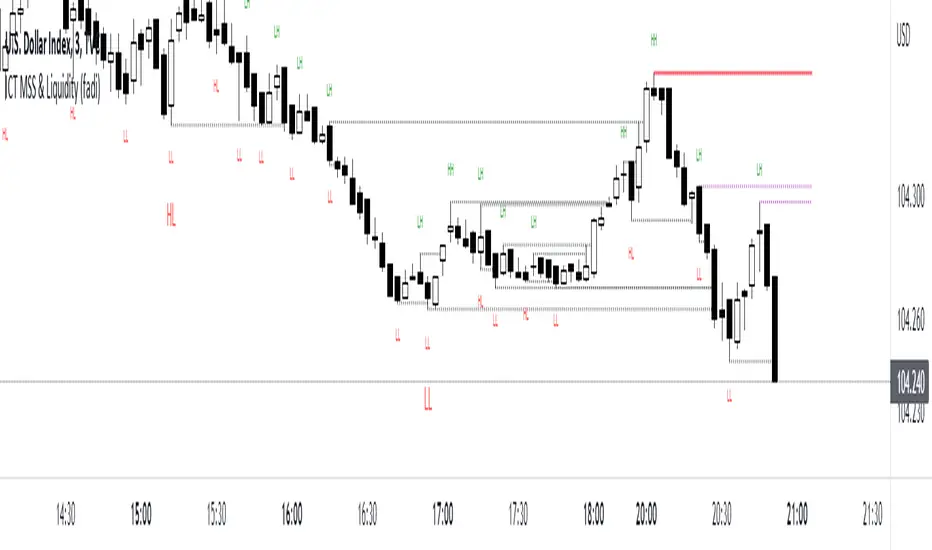
ICT MSS & Liquidity indicator calculates two pivot points and the most likely location of the liquidity. The two pivot points are called Major and Internal. Both can be configured and adjusted separately to suit the instrument being traded and how the trader prefers to trade.
Major Trend
Major Trend is usually a better indicator of the trend direction. This is because it encapsulates longer period and allows for price fluctuation reducing the number of false Market Structure Shifts (MSS).
There is no set numeric value for the Pivot Length (number of bars used to calculate the high and low points). The pivot length is a judgement call by the trader and can be adjusted to what the trader feels comfortable with.

In the image above, a trader can see that the Major trend is making lower low move where it has swept liquidity (dotted line) and has the potential to reverse direction, if higher timeframe provides supporting evidence.
Internal Trend
Internal Trend is usually used to identify an internal shift in market structure that may, but not guaranteed, indicates that the Major Trend's current leg movement is about to reverse direction. It is not an indicator in itself that the overall Major trend is about to make major change in direction.
For example, if the Major trend is showing Lower Lows and Lower Highs, a higher high on the Internal Trend could simply mean that the Major Trend is done with a Lower Low move and about to make a lower high move and not sweep the liquidity above the previous lower high. If, however, the larger picture indicates that the Major Trend has reached a potential reversal point, the Internal Trend could be used to corroborate that thesis by forming the higher high.

In the image above, the internal trend provides an indication that a market structure shift is probably under way and, if proper analysis performed, a position can be entered.
Liquidity
Liquidity rests above highs and lows on both Major and Internal trends. The indicator will draw both open and claimed liquidity lines. Price tends to move towards liquidity and, if enabled, the indicator provides an easy way to identify potential targets. Liquidity could be drawn on both Major and Internal Trends.
Major Trend
Major Trend is usually a better indicator of the trend direction. This is because it encapsulates longer period and allows for price fluctuation reducing the number of false Market Structure Shifts (MSS).
There is no set numeric value for the Pivot Length (number of bars used to calculate the high and low points). The pivot length is a judgement call by the trader and can be adjusted to what the trader feels comfortable with.
In the image above, a trader can see that the Major trend is making lower low move where it has swept liquidity (dotted line) and has the potential to reverse direction, if higher timeframe provides supporting evidence.
Internal Trend
Internal Trend is usually used to identify an internal shift in market structure that may, but not guaranteed, indicates that the Major Trend's current leg movement is about to reverse direction. It is not an indicator in itself that the overall Major trend is about to make major change in direction.
For example, if the Major trend is showing Lower Lows and Lower Highs, a higher high on the Internal Trend could simply mean that the Major Trend is done with a Lower Low move and about to make a lower high move and not sweep the liquidity above the previous lower high. If, however, the larger picture indicates that the Major Trend has reached a potential reversal point, the Internal Trend could be used to corroborate that thesis by forming the higher high.
In the image above, the internal trend provides an indication that a market structure shift is probably under way and, if proper analysis performed, a position can be entered.
Liquidity
Liquidity rests above highs and lows on both Major and Internal trends. The indicator will draw both open and claimed liquidity lines. Price tends to move towards liquidity and, if enabled, the indicator provides an easy way to identify potential targets. Liquidity could be drawn on both Major and Internal Trends.
Skrip dilindungi
Skrip ini diterbitkan sebagai sumber tertutup. Akan tetapi, anda boleh menggunakannya dengan percuma dan tanpa had – ketahui lebih lanjut di sini.
Penafian
Maklumat dan penerbitan adalah tidak dimaksudkan untuk menjadi, dan tidak membentuk, nasihat untuk kewangan, pelaburan, perdagangan dan jenis-jenis lain atau cadangan yang dibekalkan atau disahkan oleh TradingView. Baca dengan lebih lanjut di Terma Penggunaan.