OPEN-SOURCE SCRIPT
Adaptive Bollinger Bands
Adaptive Bollinger Bands
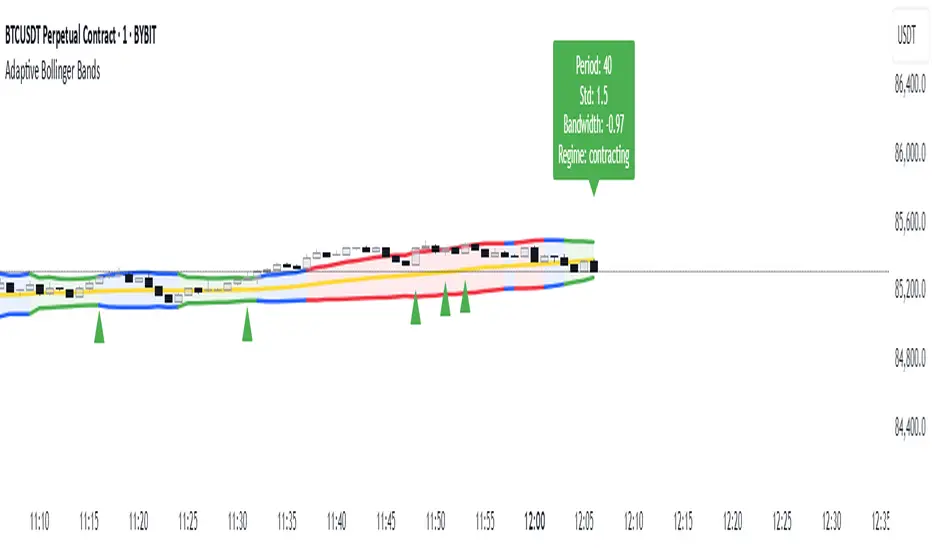
This indicator displays Bollinger Bands with parameters that dynamically adjust based on market volatility. Unlike standard Bollinger Bands with fixed parameters, this version adaptively modifies both the period and standard deviation multiplier in real-time based on measured market conditions.
Key Features
Volatility Visualization
The indicator uses color-coding to display different volatility regimes:
Technical Information
The indicator calculates volatility by analyzing price returns over a configurable lookback period (default 50 bars). The standard deviation of returns is normalized against historical extremes to create an adaptive scaling factor.
Band adaptation occurs through two primary mechanisms:
1. Period adjustment: Higher volatility uses shorter periods (more responsive), while lower volatility uses longer periods (more stable)
2. Standard deviation multiplier adjustment: Higher volatility increases the multiplier (wider bands), while lower volatility decreases it (tighter bands)
The middle band uses a simple moving average with the adaptive period. Additional refinement occurs through Keltner Channel integration, which can tighten bands when contained within Keltner boundaries.
Volatility regimes are determined by analyzing Bollinger Bandwidth relative to its recent history, providing contextual information about the current market state.
Settings Customization
The indicator provides extensive customization options:
- Base parameters (period and standard deviation)
- Adaptive range limits (min/max period and standard deviation)
- Keltner Channel parameters for band refinement
- Bandwidth analysis settings
- Display options for visual elements
Limitations and Considerations
This indicator is designed to provide objective information about market volatility conditions and potential support/resistance zones. Always combine with other analysis methods within a comprehensive trading approach.
This indicator displays Bollinger Bands with parameters that dynamically adjust based on market volatility. Unlike standard Bollinger Bands with fixed parameters, this version adaptively modifies both the period and standard deviation multiplier in real-time based on measured market conditions.
Key Features
- Dynamic adjustment of period and standard deviation based on normalized volatility
- Color-coded visualization of current volatility regime (expanding, normal, contracting)
- Integration with Keltner Channels for band refinement
- Bandwidth analysis for volatility regime identification
- Optional on-chart parameter labels showing current settings
- Band cross alerts and visual markers
Volatility Visualization
The indicator uses color-coding to display different volatility regimes:
- Red: Expanding volatility regime (higher measured volatility)
- Blue: Normal volatility regime (average measurements)
- Green: Contracting volatility regime (lower measured volatility)
Technical Information
The indicator calculates volatility by analyzing price returns over a configurable lookback period (default 50 bars). The standard deviation of returns is normalized against historical extremes to create an adaptive scaling factor.
Band adaptation occurs through two primary mechanisms:
1. Period adjustment: Higher volatility uses shorter periods (more responsive), while lower volatility uses longer periods (more stable)
2. Standard deviation multiplier adjustment: Higher volatility increases the multiplier (wider bands), while lower volatility decreases it (tighter bands)
The middle band uses a simple moving average with the adaptive period. Additional refinement occurs through Keltner Channel integration, which can tighten bands when contained within Keltner boundaries.
Volatility regimes are determined by analyzing Bollinger Bandwidth relative to its recent history, providing contextual information about the current market state.
Settings Customization
The indicator provides extensive customization options:
- Base parameters (period and standard deviation)
- Adaptive range limits (min/max period and standard deviation)
- Keltner Channel parameters for band refinement
- Bandwidth analysis settings
- Display options for visual elements
Limitations and Considerations
- All technical indicators have inherent limitations and should not be used in isolation
- Past performance does not guarantee future results
- The indicator requires sufficient historical data for proper volatility normalization
- Smaller timeframes may produce more noise in the adaptive calculations
- Parameters may require adjustment for different markets and trading styles
- Band crosses are not trading signals on their own and should be evaluated with other factors
This indicator is designed to provide objective information about market volatility conditions and potential support/resistance zones. Always combine with other analysis methods within a comprehensive trading approach.
Skrip sumber terbuka
Dalam semangat TradingView sebenar, pencipta skrip ini telah menjadikannya sumber terbuka, jadi pedagang boleh menilai dan mengesahkan kefungsiannya. Terima kasih kepada penulis! Walaupuan anda boleh menggunakan secara percuma, ingat bahawa penerbitan semula kod ini tertakluk kepada Peraturan Dalaman.
Penafian
Maklumat dan penerbitan adalah tidak bertujuan, dan tidak membentuk, nasihat atau cadangan kewangan, pelaburan, dagangan atau jenis lain yang diberikan atau disahkan oleh TradingView. Baca lebih dalam Terma Penggunaan.