OPEN-SOURCE SCRIPT
Telah dikemas kini Not-So-Average True Range (nsATR)
Not-So-Average True Range (nsATR)
*By Sherlock_MacGyver*
---
Long Story Short
The nsATR is a complete overhaul of traditional ATR analysis. It was designed to solve the fundamental issues with standard ATR, such as lag, lack of contextual awareness, and equal treatment of all volatility events.
Key innovations include:
* A smarter ATR that reacts dynamically when price movement exceeds normal expectations.
* Envelope zones that distinguish between moderate and extreme volatility conditions.
* A long-term ATR baseline that adds historical context to current readings.
* A compression detection system that flags when the market is coiled and ready to break out.
This indicator is designed for traders who want to see volatility the way it actually behaves — contextually, asymmetrically, and with predictive power.
---
What Is This Thing?
Standard ATR (Average True Range) has limitations:
* It smooths too slowly (using Wilder's RMA), which delays detection of meaningful moves.
* It lacks context — no way to know if current volatility is high or low relative to history.
* It treats all volatility equally, regardless of scale or significance.
nsATR** was built from scratch to overcome these weaknesses by applying:
* Amplification of large True Range spikes.
* Visual envelope zones for detecting volatility regimes.
* A long-term context line to anchor current readings.
* Multi-factor compression analysis to anticipate breakouts.
---
Core Features
1. Breach Detection with Amplification
When True Range exceeds a user-defined threshold (e.g., ATR × 1.2), it is amplified using a power function to reflect nonlinear volatility. This amplified value is then smoothed and cascades into future ATR values, affecting the indicator beyond a single bar.
2. Direction Tagging
Volatility spikes are tagged as upward or downward based on basic price momentum (close vs previous close). This provides visual context for how volatility is behaving in real-time.
3. Envelope Zones
Two adaptive envelopes highlight the current volatility regime:
* Stage 1: Moderate volatility (default: ATR × 1.5)
* Stage 2: Extreme volatility (default: ATR × 2.0)
Breaching these zones signals meaningful expansion in volatility.
4. Long-Term Context Baseline
A 200-period simple moving average of the classic ATR establishes whether current readings are above or below long-term volatility expectations.
5. Multi-Signal Compression Detection
Flags potential breakout conditions when:
* ATR is below its long-term baseline
* Price Bollinger Bands are compressed
* RSI Bollinger Bands are also compressed
All three signals must align to plot a "Volatility Confluence Dot" — an early warning of potential expansion.
---
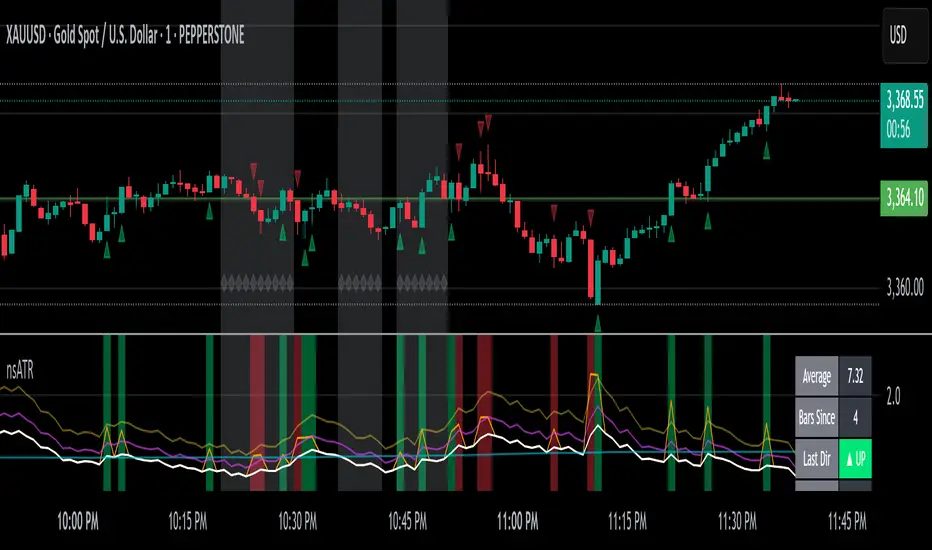
Chart Outputs
In the Indicator Pane:
* Breach Amplified ATR (Orange line)
* Classic ATR baseline (White line)
* Long-Term context baseline (Cyan line)
* Stage 1 and Stage 2 Envelopes (Purple and Yellow lines)
On the Price Chart:
* Triangles for breach direction (green/red)
* Diamonds for compression zones
* Optional background coloring for visual clarity
---
Alerts
Built-in alert conditions:
1. ATR breach detected
2. Stage 1 envelope breached
3. Stage 2 envelope breached
4. Compression zone detected
---
Customization
All components are modular. Traders can adjust:
* Display toggles for each visual layer
* Colors and line widths
* Breach threshold and amplification power
* Envelope sensitivity
* Compression sensitivity and lookback windows
Some options are disabled by default to reduce clutter but can be turned on for more aggressive signal detection.
---
Real-Time Behavior (Non-Repainting Clarification)
The indicator updates in real time on the current bar as new data comes in. This is expected behavior for live trading tools. Once a bar closes, values do not change. In other words, the indicator *does not repaint history* — but the current bar can update dynamically until it closes.
---
Use Cases
* Day traders: Use compression zones to anticipate volatility surges.
* Swing traders: Use envelope breaches for regime awareness.
* System developers: Replace standard ATR in your logic for better responsiveness.
* Risk managers: Use directional volatility signals to better model exposure.
---
About the Developer
Sherlock_MacGyver develops original trading systems that question default assumptions and solve real trader problems.
*By Sherlock_MacGyver*
---
Long Story Short
The nsATR is a complete overhaul of traditional ATR analysis. It was designed to solve the fundamental issues with standard ATR, such as lag, lack of contextual awareness, and equal treatment of all volatility events.
Key innovations include:
* A smarter ATR that reacts dynamically when price movement exceeds normal expectations.
* Envelope zones that distinguish between moderate and extreme volatility conditions.
* A long-term ATR baseline that adds historical context to current readings.
* A compression detection system that flags when the market is coiled and ready to break out.
This indicator is designed for traders who want to see volatility the way it actually behaves — contextually, asymmetrically, and with predictive power.
---
What Is This Thing?
Standard ATR (Average True Range) has limitations:
* It smooths too slowly (using Wilder's RMA), which delays detection of meaningful moves.
* It lacks context — no way to know if current volatility is high or low relative to history.
* It treats all volatility equally, regardless of scale or significance.
nsATR** was built from scratch to overcome these weaknesses by applying:
* Amplification of large True Range spikes.
* Visual envelope zones for detecting volatility regimes.
* A long-term context line to anchor current readings.
* Multi-factor compression analysis to anticipate breakouts.
---
Core Features
1. Breach Detection with Amplification
When True Range exceeds a user-defined threshold (e.g., ATR × 1.2), it is amplified using a power function to reflect nonlinear volatility. This amplified value is then smoothed and cascades into future ATR values, affecting the indicator beyond a single bar.
2. Direction Tagging
Volatility spikes are tagged as upward or downward based on basic price momentum (close vs previous close). This provides visual context for how volatility is behaving in real-time.
3. Envelope Zones
Two adaptive envelopes highlight the current volatility regime:
* Stage 1: Moderate volatility (default: ATR × 1.5)
* Stage 2: Extreme volatility (default: ATR × 2.0)
Breaching these zones signals meaningful expansion in volatility.
4. Long-Term Context Baseline
A 200-period simple moving average of the classic ATR establishes whether current readings are above or below long-term volatility expectations.
5. Multi-Signal Compression Detection
Flags potential breakout conditions when:
* ATR is below its long-term baseline
* Price Bollinger Bands are compressed
* RSI Bollinger Bands are also compressed
All three signals must align to plot a "Volatility Confluence Dot" — an early warning of potential expansion.
---
Chart Outputs
In the Indicator Pane:
* Breach Amplified ATR (Orange line)
* Classic ATR baseline (White line)
* Long-Term context baseline (Cyan line)
* Stage 1 and Stage 2 Envelopes (Purple and Yellow lines)
On the Price Chart:
* Triangles for breach direction (green/red)
* Diamonds for compression zones
* Optional background coloring for visual clarity
---
Alerts
Built-in alert conditions:
1. ATR breach detected
2. Stage 1 envelope breached
3. Stage 2 envelope breached
4. Compression zone detected
---
Customization
All components are modular. Traders can adjust:
* Display toggles for each visual layer
* Colors and line widths
* Breach threshold and amplification power
* Envelope sensitivity
* Compression sensitivity and lookback windows
Some options are disabled by default to reduce clutter but can be turned on for more aggressive signal detection.
---
Real-Time Behavior (Non-Repainting Clarification)
The indicator updates in real time on the current bar as new data comes in. This is expected behavior for live trading tools. Once a bar closes, values do not change. In other words, the indicator *does not repaint history* — but the current bar can update dynamically until it closes.
---
Use Cases
* Day traders: Use compression zones to anticipate volatility surges.
* Swing traders: Use envelope breaches for regime awareness.
* System developers: Replace standard ATR in your logic for better responsiveness.
* Risk managers: Use directional volatility signals to better model exposure.
---
About the Developer
Sherlock_MacGyver develops original trading systems that question default assumptions and solve real trader problems.
Nota Keluaran
//////////////////////////////////////////// === UPDATE === //
//////////////////////////////////////////
NOTE: (Large candle alerts)
If you want to detect large candles while they're still in progress (especially relevant on higher timeframes), you can set the breach threshold a little higher, tighten up the stage 1 envelope, and then increase the amplification (smoothing off).
A larger threshold means a candle has to get bigger than usual, so you bring the envelope in tighter with a smaller number, turn off smoothing so it's not delayed, and increase the amplification so it will jump up through the envelope more quickly, triggering a stage 1 or 2 envelope breach alert you can set up.
NEW FEATURE:
🧠 Breach Tracking & Intelligence Table (New Feature)
Introducing a real-time Breach Statistics Table that tracks volatility breach events and summarizes recent activity with actionable insight:
- Average Spacing – How many bars typically occur between breach events.
- Bars Since Last Breach – Time elapsed since the most recent breach.
- Last Direction – Was the last breach bullish (▲ UP) or bearish (▼ DOWN)?
- Up/Down Count – How many bullish vs bearish breaches happened within the lookback
window.
- Bias Dominance – Which side has control based on recent breach direction history.
🔍 How It Works:
Behind the scenes, a set of var arrays logs every confirmed breach — including its bar index and direction. As new bars form, the script automatically prunes entries outside your selected lookback window, ensuring only recent, relevant breaches are analyzed.
This self-cleaning memory system keeps the stats focused and responsive, without bloating over time or including ancient history that no longer matters.
Additionally, whenever dominance flips (e.g., bears give way to bulls), a subtle background glow highlights the transition — giving you a real-time visual cue for shifts in volatility leadership.
Ideal for breakout traders, volatility scalpers, or anyone who wants to know when the dragon stirs — and in which direction it’s breathing.
Skrip sumber terbuka
Dalam semangat TradingView sebenar, pencipta skrip ini telah menjadikannya sumber terbuka, jadi pedagang boleh menilai dan mengesahkan kefungsiannya. Terima kasih kepada penulis! Walaupuan anda boleh menggunakan secara percuma, ingat bahawa penerbitan semula kod ini tertakluk kepada Peraturan Dalaman.
Penafian
Maklumat dan penerbitan adalah tidak bertujuan, dan tidak membentuk, nasihat atau cadangan kewangan, pelaburan, dagangan atau jenis lain yang diberikan atau disahkan oleh TradingView. Baca lebih dalam Terma Penggunaan.