OPEN-SOURCE SCRIPT
Color Code Overlay Strategy
Color Code Overlay Strategy
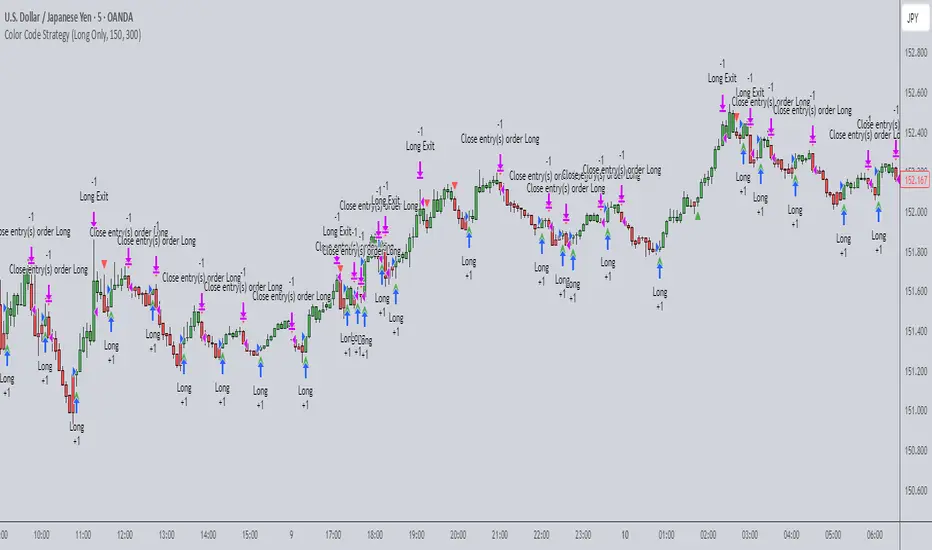
This strategy utilizes a custom color-coded overlay to provide accurate buy and sell signals based on dynamic color changes of the candles. The indicator works by calculating a color shift between bullish (green) and bearish (red) candles, with the color change logic driven by both price movement and volatility.
How the Color Change is Calculated:
The color change is determined by comparing the closing price relative to the opening price of each candle, as is typical with a traditional bullish or bearish candle. However, to make this strategy more adaptive to market conditions, the color change is further refined by incorporating the Average True Range (ATR).
Volatility Adjusted Color Shift: The strategy calculates a dynamic threshold based on the ATR value, which represents market volatility. If the price movement between the open and close of the candle exceeds a specific percentage of the ATR, the color of the candle shifts from red (bearish) to green (bullish) or vice versa.
Threshold Calculation: A fixed percentage (e.g., 1%) of the ATR range is used to define the minimum price movement required for a color change. This ensures that only significant price movements, adjusted for volatility, trigger the color shift. The larger the ATR (higher volatility), the greater the price movement required to cause a change in color.
Bullish to Bearish (Green to Red): When the candle closes lower than the open, and the price movement exceeds the dynamic threshold based on ATR, the candle color changes from green to red, signaling a potential bearish reversal.
Bearish to Bullish (Red to Green): When the candle closes higher than the open, and the price movement exceeds the ATR-based threshold, the candle color shifts from red to green, signaling a potential bullish reversal.
Key Features:
Dynamic Color Change: The strategy identifies key color changes from bullish to bearish (green to red) and from bearish to bullish (red to green) based on specific thresholds in candle size.
Customizable Timeframe: You can specify a custom trading window to restrict the strategy’s actions to specific hours of the day.
Stop Loss and Take Profit: The strategy incorporates risk management features, allowing you to set a stop loss and take profit based on the price in pips.
Flexible Trade Types: Choose between "Both" (long and short), "Long Only," or "Short Only" trading options to suit your preferred trading style.
Visual Alerts: Receive visual alerts with arrows when color changes occur, signaling potential trade opportunities. Green arrows indicate a bullish shift, while red arrows show a bearish shift.
This strategy is ideal for traders who prefer a color-coded overlay to easily visualize price action and make informed decisions based on bullish or bearish trends. Whether you’re looking for quick, short-term opportunities or analyzing market reversals, this strategy offers an intuitive approach to identifying trade signals.
Skrip sumber terbuka
Dalam semangat TradingView sebenar, pencipta skrip ini telah menjadikannya sumber terbuka, jadi pedagang boleh menilai dan mengesahkan kefungsiannya. Terima kasih kepada penulis! Walaupuan anda boleh menggunakan secara percuma, ingat bahawa penerbitan semula kod ini tertakluk kepada Peraturan Dalaman.
Penafian
Maklumat dan penerbitan adalah tidak bertujuan, dan tidak membentuk, nasihat atau cadangan kewangan, pelaburan, dagangan atau jenis lain yang diberikan atau disahkan oleh TradingView. Baca lebih dalam Terma Penggunaan.