OPEN-SOURCE SCRIPT
bows
//version=5
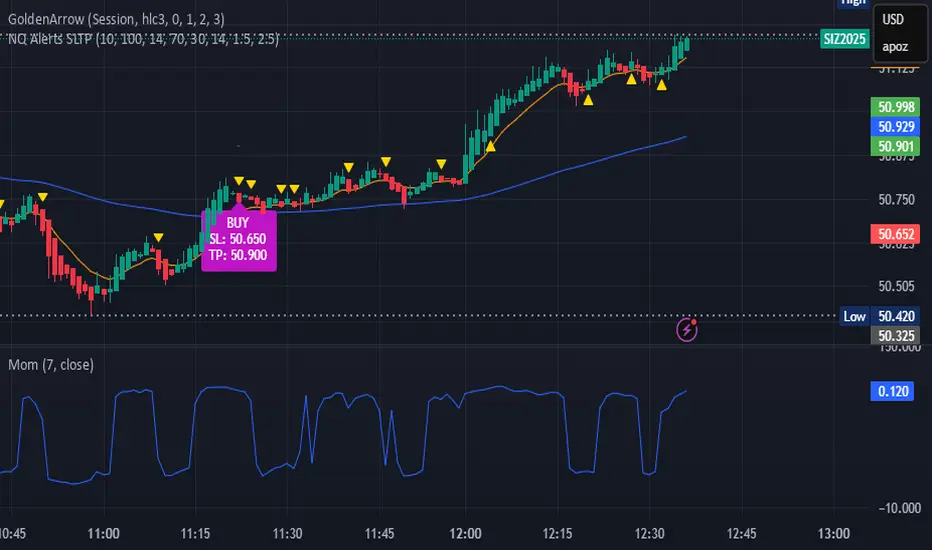
indicator("NQ EMA+RSI+ATR Alerts with SL/TP", overlay=true, shorttitle="NQ Alerts SLTP")
// === Inputs ===a
fastLen = input.int(9, "Fast EMA", minval=1)
slowLen = input.int(21, "Slow EMA", minval=1)
rsiLen = input.int(14, "RSI Length", minval=1)
rsiLongMax = input.int(70, "Max RSI to allow LONG", minval=50, maxval=90)
rsiShortMin = input.int(30, "Min RSI to allow SHORT", minval=10, maxval=50)
atrLen = input.int(14, "ATR Length", minval=1)
atrMultSL = input.float(1.5, "ATR Stop-Loss Multiplier", step=0.1)
atrMultTP = input.float(2.5, "ATR Take-Profit Multiplier", step=0.1)
// === Indicator calculations ===
price = close
fastEMA = ta.ema(price, fastLen)
slowEMA = ta.ema(price, slowLen)
rsiVal = ta.rsi(price, rsiLen)
atr = ta.atr(atrLen)
// === Entry signals ===
longSignal = ta.crossover(fastEMA, slowEMA) and rsiVal < rsiLongMax
shortSignal = ta.crossunder(fastEMA, slowEMA) and rsiVal > rsiShortMin
// === SL/TP Levels ===
longSL = price - atr * atrMultSL
longTP = price + atr * atrMultTP
shortSL = price + atr * atrMultSL
shortTP = price - atr * atrMultTP
// === Plotting ===
plot(fastEMA, color=color.orange, title="Fast EMA")
plot(slowEMA, color=color.blue, title="Slow EMA")
plotshape(longSignal, title="Buy Signal", style=shape.triangleup, color=color.new(color.green, 0), location=location.belowbar, size=size.tiny)
plotshape(shortSignal, title="Sell Signal", style=shape.triangledown, color=color.new(color.red, 0), location=location.abovebar, size=size.tiny)
// Optional visualization of SL/TP
plot(longSignal ? longSL : na, "Long Stop-Loss", color=color.new(color.red, 50), style=plot.style_linebr)
plot(longSignal ? longTP : na, "Long Take-Profit", color=color.new(color.green, 50), style=plot.style_linebr)
plot(shortSignal ? shortSL : na, "Short Stop-Loss", color=color.new(color.red, 50), style=plot.style_linebr)
plot(shortSignal ? shortTP : na, "Short Take-Profit", color=color.new(color.green, 50), style=plot.style_linebr)
// === Alerts with SL/TP info ===
alertcondition(longSignal, title="BUY Signal",
message="BUY Alert — NQ LONG: Entry @ {{close}} | SL: {{plot_1}} | TP: {{plot_2}} | {{ticker}}")
alertcondition(shortSignal, title="SELL Signal",
message="SELL Alert — NQ SHORT: Entry @ {{close}} | SL: {{plot_3}} | TP: {{plot_4}} | {{ticker}}")
// === Visual labels ===
if (longSignal)
label.new(bar_index, low, "BUY\nSL: " + str.tostring(longSL, format.mintick) + "\nTP: " + str.tostring(longTP, format.mintick),
style=label.style_label_up, color=color.new(#be14c4, 0), textcolor=color.white)
if (shortSignal)
label.new(bar_index, high, "SELL\nSL: " + str.tostring(shortSL, format.mintick) + "\nTP: " + str.tostring(shortTP, format.mintick),
style=label.style_label_down, color=color.new(color.red, 0), textcolor=color.white)
Skrip sumber terbuka
In true TradingView spirit, the creator of this script has made it open-source, so that traders can review and verify its functionality. Kudos to the author! While you can use it for free, remember that republishing the code is subject to our House Rules.
Penafian
The information and publications are not meant to be, and do not constitute, financial, investment, trading, or other types of advice or recommendations supplied or endorsed by TradingView. Read more in the Terms of Use.