OPEN-SOURCE SCRIPT
Telah dikemas kini DMA Buy & Sell Signal with Alerts
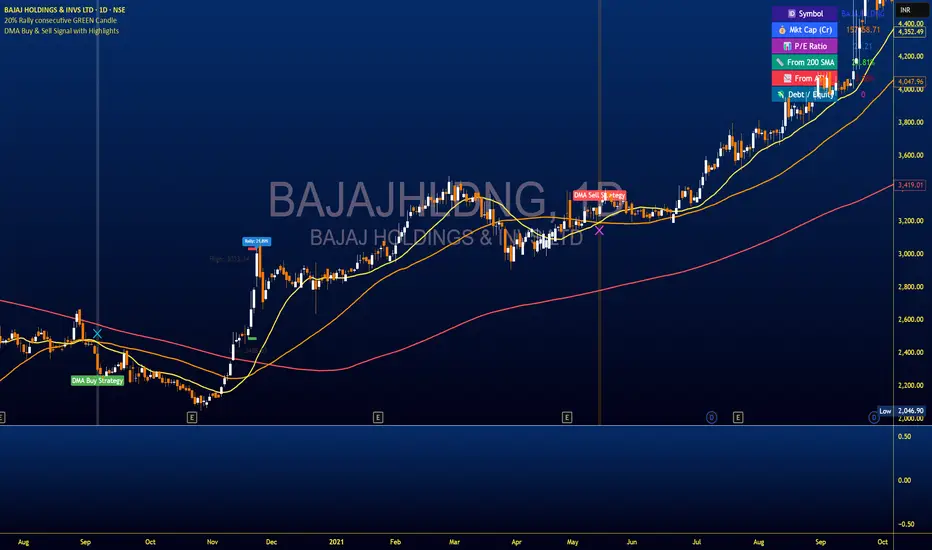
This script identifies **BUY** signals when the 20 DMA crosses **below** the 50 DMA, with the alignment: `200 DMA > 50 DMA > 20 DMA > Price`.
It also plots **SELL** signals when the 20 DMA crosses **above** the 50 DMA, with the alignment: `Price > 20 DMA > 50 DMA > 200 DMA`.
Each signal is plotted on the chart with green "BUY" and red "SELL" labels.
The script includes alert conditions for both signals.
It uses simple moving averages (SMA) of 20, 50, and 200 periods.
Nota Keluaran
This script identifies **BUY** signals when the 20 DMA crosses **below** the 50 DMA, with the alignment: `200 DMA > 50 DMA > 20 DMA > Price`.It also plots **SELL** signals when the 20 DMA crosses **above** the 50 DMA, with the alignment: `Price > 20 DMA > 50 DMA > 200 DMA`.
Each signal is plotted on the chart with green "BUY" and red "SELL" labels.
The script includes alert conditions for both signals.
It uses simple moving averages (SMA) of 20, 50, and 200 periods.
Skrip sumber terbuka
Dalam semangat sebenar TradingView, pencipta skrip ini telah menjadikannya sumber terbuka supaya pedagang dapat menilai dan mengesahkan kefungsiannya. Terima kasih kepada penulis! Walaupun anda boleh menggunakannya secara percuma, ingat bahawa menerbitkan semula kod ini adalah tertakluk kepada Peraturan Dalaman kami.
Penafian
Maklumat dan penerbitan adalah tidak dimaksudkan untuk menjadi, dan tidak membentuk, nasihat untuk kewangan, pelaburan, perdagangan dan jenis-jenis lain atau cadangan yang dibekalkan atau disahkan oleh TradingView. Baca dengan lebih lanjut di Terma Penggunaan.