OPEN-SOURCE SCRIPT
Percent Change Indicator
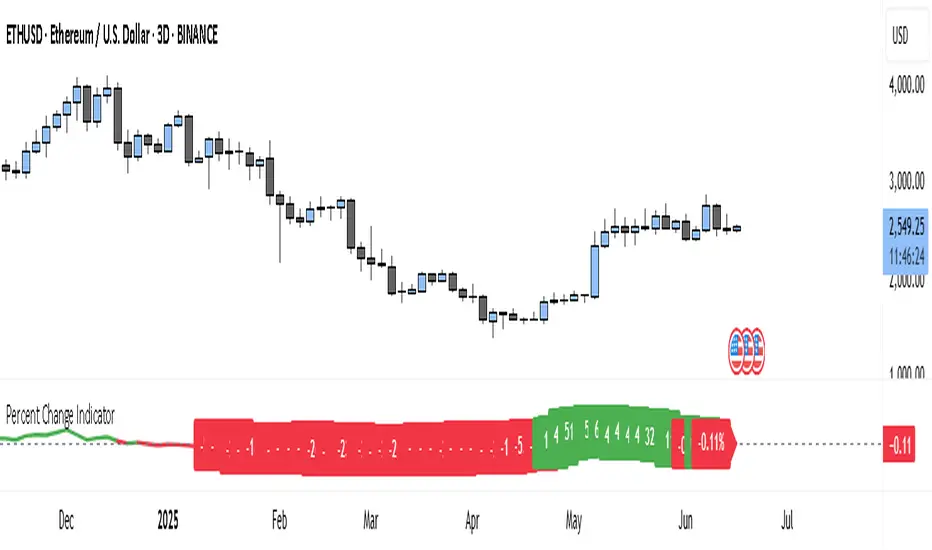
The Percent Change Indicator helps you see how much the price of an asset has changed over a specific number of bars (or candles) on the chart. You get to decide how many bars to look back — for example, the last 10 candles. The indicator takes the current closing price and compares it to the closing price from 10 bars ago, then calculates the percentage difference between the two.
If the price has increased, the indicator shows a positive value and displays it in green. If the price has dropped, the value is negative and shown in red. A horizontal zero line helps you quickly see whether the market is gaining or losing value over the selected period.
On your chart, this indicator appears as a line that moves up or down with the price trend. It updates in real time and works on all timeframes — so whether you're trading on the 1-minute chart or analyzing the daily chart, it always tells you how much the price has changed over the number of bars you chose.
This tool is especially useful for spotting trends, measuring price momentum, or identifying when the market is starting to reverse direction.
Skrip sumber terbuka
Dalam semangat TradingView sebenar, pencipta skrip ini telah menjadikannya sumber terbuka, jadi pedagang boleh menilai dan mengesahkan kefungsiannya. Terima kasih kepada penulis! Walaupuan anda boleh menggunakan secara percuma, ingat bahawa penerbitan semula kod ini tertakluk kepada Peraturan Dalaman.
Trade forex, indices, stocks and metals with up to US$100.000 in company's funding.
Complete a challenge to access funding or go for instant deposit.
Trading involves substantial risk. Not financial advice
Complete a challenge to access funding or go for instant deposit.
Trading involves substantial risk. Not financial advice
Penafian
Maklumat dan penerbitan adalah tidak bertujuan, dan tidak membentuk, nasihat atau cadangan kewangan, pelaburan, dagangan atau jenis lain yang diberikan atau disahkan oleh TradingView. Baca lebih dalam Terma Penggunaan.