OPEN-SOURCE SCRIPT
SMA 9/50/180 + EMA 20 + ORB + BUY/SELL
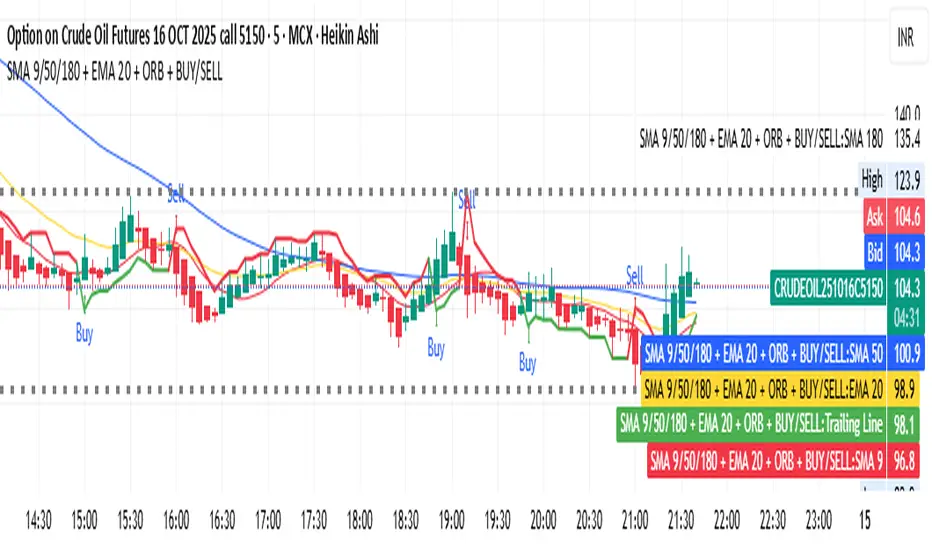
SMA + EMA + ORB + Buy/Sell indicator step by step.
🧠 1️⃣ What the Indicator Does
This TradingView script combines four systems in one:
Component Purpose
SMA 9 / 50 / 180 Shows short-, medium-, and long-term trend direction
EMA 20 Gives quicker trend signals
Buy/Sell Swing Logic Generates arrow signals based on breakout/reversal
ORB (Opening Range Breakout) Marks high and low of the market’s first few minutes (e.g. 9:15–9:20)
Together, it helps identify:
The main market trend
Entry/exit signals
Early breakout zones for intraday trading
📊 2️⃣ Moving Averages (SMA & EMA)
Indicator Meaning
SMA 9 Tracks short-term price (fast signal)
SMA 50 Tracks medium trend
SMA 180 Long-term trend direction
EMA 20 Gives quicker reactions than SMA (useful for early entries)
How to use:
When SMA9 > SMA50 > SMA180, trend = strong uptrend
When SMA9 < SMA50 < SMA180, trend = strong downtrend
So you trade in the same direction as the moving averages.
💡 3️⃣ Buy / Sell Swing Logic
This part finds small swing breakouts:
It checks the highest high and lowest low of the last few candles (default = 3).
If price closes above the previous high → Buy Signal (Green Arrow)
If price closes below the previous low → Sell Signal (Red Arrow)
It also plots a Trailing Line (TSL) that flips color:
🟢 Green line → Uptrend (price above TSL)
🔴 Red line → Downtrend (price below TSL)
Optional:
You can color bars/background to match buy/sell zones.
⏰ 4️⃣ ORB – Opening Range Breakout
Opening Range Breakout (ORB) marks the market’s first few minutes’ high and low (default 9:15–9:20).
These two lines act as important breakout zones.
If price breaks above ORB high → bullish momentum
If price breaks below ORB low → bearish momentum
Helps you trade early intraday moves confidently.
🧩 5️⃣ How to Use Together
🔼 Buy Setup
SMA9 > SMA50 → uptrend
Price near ORB High or above it
Green “Buy” arrow appears
✅ Enter Buy position
🎯 Exit near resistance (previous swing high)
🔽 Sell Setup
SMA9 < SMA50 → downtrend
Price near ORB Low or below it
Red “Sell” arrow appears
✅ Enter Sell position
🎯 Exit near next support
⚙️ 6️⃣ Customization
You can adjust:
SMA & EMA periods
ORB session time (e.g. 9:15–9:30)
Swing candle count
Color options for background/bars
✅ 7️⃣ Why It’s Useful
Benefit Description
Multi-confirmation Combines trend + breakout + swing signals
Intraday friendly ORB + fast MAs = perfect for 5–15 min charts
Visual clarity Arrows, lines, and colors show direction clearly
Alerts ready You get notifications when Buy/Sell triggers
Skrip sumber terbuka
Dalam semangat sebenar TradingView, pencipta skrip ini telah menjadikannya sumber terbuka supaya pedagang dapat menilai dan mengesahkan kefungsiannya. Terima kasih kepada penulis! Walaupun anda boleh menggunakannya secara percuma, ingat bahawa menerbitkan semula kod ini adalah tertakluk kepada Peraturan Dalaman kami.
Penafian
Maklumat dan penerbitan adalah tidak dimaksudkan untuk menjadi, dan tidak membentuk, nasihat untuk kewangan, pelaburan, perdagangan dan jenis-jenis lain atau cadangan yang dibekalkan atau disahkan oleh TradingView. Baca dengan lebih lanjut di Terma Penggunaan.