OPEN-SOURCE SCRIPT
Ticker Ratio Levels
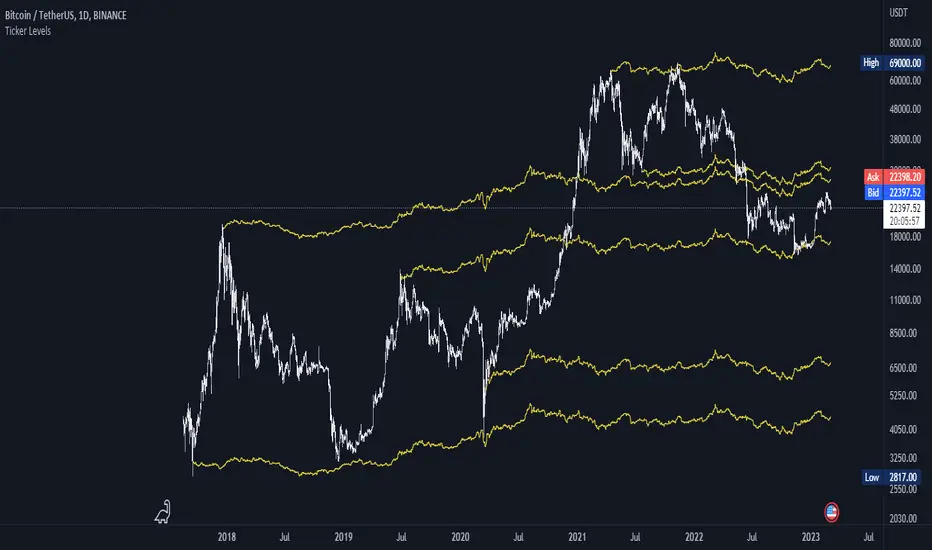
Indicator for constructing levels of price ratios from other tickers.
The user can choose from predefined tickers such as Gold(XAU), DXY, BTC, etc.
Takes the important extremum of the closing candle from your current chart and builds a level based on the chart selected in the settings.
This function allows you to determine the price level based on the current price and the price at the time of a certain date. To do this, it first determines the time when the last candle before the specified date occurred. Then the price at the time of this candle and at the current moment is calculated. Finally, the price level is calculated relative to the price at the time of the candle. The result of this calculation will be the price level.
By default, the indicator is set to 1D for the BTC chart. But you can adjust any levels on the assets you are interested in.
You can adjust the levels both in the settings and by moving them around the chart.
Simply click on the indicator name or level, and vertical lines will appear, which you can drag to any location. (The vertical lines serve as the beginning of the calculation point)
Example of work on ETH paired with DXY.

The user can choose from predefined tickers such as Gold(XAU), DXY, BTC, etc.
- How it works:
Takes the important extremum of the closing candle from your current chart and builds a level based on the chart selected in the settings.
This function allows you to determine the price level based on the current price and the price at the time of a certain date. To do this, it first determines the time when the last candle before the specified date occurred. Then the price at the time of this candle and at the current moment is calculated. Finally, the price level is calculated relative to the price at the time of the candle. The result of this calculation will be the price level.
- How to Use:
By default, the indicator is set to 1D for the BTC chart. But you can adjust any levels on the assets you are interested in.
You can adjust the levels both in the settings and by moving them around the chart.
Simply click on the indicator name or level, and vertical lines will appear, which you can drag to any location. (The vertical lines serve as the beginning of the calculation point)
Example of work on ETH paired with DXY.
Skrip sumber terbuka
Dalam semangat sebenar TradingView, pencipta skrip ini telah menjadikannya sumber terbuka supaya pedagang dapat menilai dan mengesahkan kefungsiannya. Terima kasih kepada penulis! Walaupun anda boleh menggunakannya secara percuma, ingat bahawa menerbitkan semula kod ini adalah tertakluk kepada Peraturan Dalaman kami.
Penafian
Maklumat dan penerbitan adalah tidak dimaksudkan untuk menjadi, dan tidak membentuk, nasihat untuk kewangan, pelaburan, perdagangan dan jenis-jenis lain atau cadangan yang dibekalkan atau disahkan oleh TradingView. Baca dengan lebih lanjut di Terma Penggunaan.