PROTECTED SOURCE SCRIPT
Telah dikemas kini BankNifty-15min Intraday-High Risk-R-AlgoAI-Final Copy
// This script is for educational and informational purposes only.
// It does not constitute financial or investment advice.
// Trading involves substantial risk and may not be suitable for all investors.
// Always do your own research or consult with a licensed financial advisor
// before making any trading or investment decisions.
// The author is not responsible for any losses incurred using this script.
⚡ Overview:
This script is a technical indicator designed for intraday trading on the Bank Nifty future chart using the 15-minute timeframe. It uses a combination of normalized buy and sell pressure along with a Hull Moving Average (HMA) smoothing method and volume-based normalization to detect potential buy and sell signals.
💡 Main Concept:
Buy and Sell Pressure Calculation:
The script calculates:
bp (Buy Pressure): close - low
sp (Sell Pressure): high - close
These values are smoothed using a custom Hull Moving Average (HMA) function, designed to reduce lag and react quicker to price changes compared to traditional moving averages.
📊 Normalized Signals:
Buy and Sell pressures are normalized against their HMA smoothed values.
Volume normalization is also applied to adjust for the effect of market activity on the pressure signals.
📌 Signal Logic:
A Buy Signal is generated when:
Only one signal per day is allowed to avoid signal spamming.
A Sell Signal is generated under the opposite conditions:
One sell signal per day.
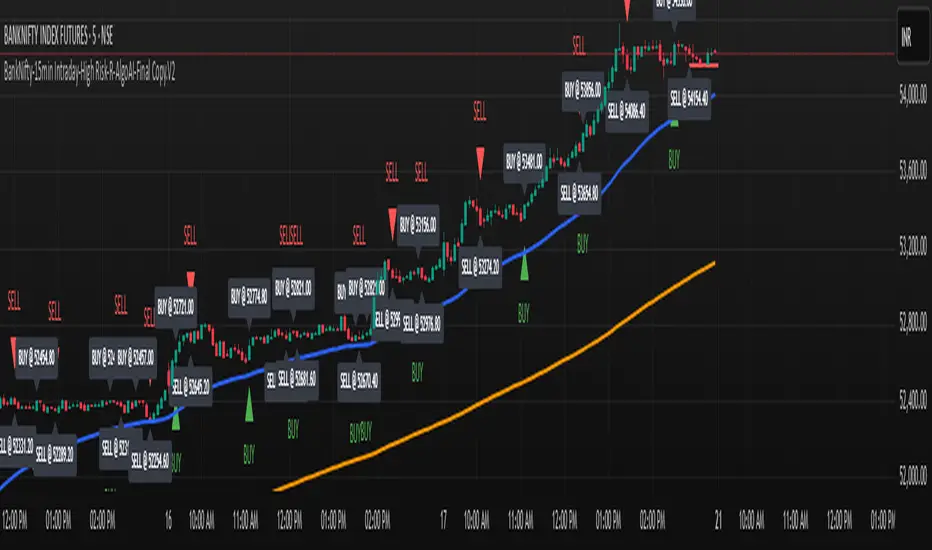
🧾 Visual Output:
When a signal is triggered, the script:
Draws a horizontal line at the signal price (with labels like BUY @ or SELL @).
Plots triangle markers on the chart to highlight buy (green) or sell (red) signals.
Deletes or extends lines at the end of each day to maintain visual clarity.
📈 Additional Features:
EMA 50 & EMA 200:
Plots two common Exponential Moving Averages (50-period and 200-period) for trend visualization.
⚠️ Important Notes:
This script is meant for educational and research purposes only.
It is designed for high-risk intraday trading.
Signals are based on historical behavior and should not be treated as financial advice.
No stop-loss or take-profit logic is included — traders should manage risk independently.
✅ Summary:
This indicator offers a simple visual and quantitative approach to spot potential intraday turning points for Bank Nifty future on a 15-minute chart, with clear buy and sell markers. It combines volume, price pressure, and moving average smoothing to filter out random price movements.
// It does not constitute financial or investment advice.
// Trading involves substantial risk and may not be suitable for all investors.
// Always do your own research or consult with a licensed financial advisor
// before making any trading or investment decisions.
// The author is not responsible for any losses incurred using this script.
⚡ Overview:
This script is a technical indicator designed for intraday trading on the Bank Nifty future chart using the 15-minute timeframe. It uses a combination of normalized buy and sell pressure along with a Hull Moving Average (HMA) smoothing method and volume-based normalization to detect potential buy and sell signals.
💡 Main Concept:
Buy and Sell Pressure Calculation:
The script calculates:
bp (Buy Pressure): close - low
sp (Sell Pressure): high - close
These values are smoothed using a custom Hull Moving Average (HMA) function, designed to reduce lag and react quicker to price changes compared to traditional moving averages.
📊 Normalized Signals:
Buy and Sell pressures are normalized against their HMA smoothed values.
Volume normalization is also applied to adjust for the effect of market activity on the pressure signals.
📌 Signal Logic:
A Buy Signal is generated when:
Only one signal per day is allowed to avoid signal spamming.
A Sell Signal is generated under the opposite conditions:
One sell signal per day.
🧾 Visual Output:
When a signal is triggered, the script:
Draws a horizontal line at the signal price (with labels like BUY @ or SELL @).
Plots triangle markers on the chart to highlight buy (green) or sell (red) signals.
Deletes or extends lines at the end of each day to maintain visual clarity.
📈 Additional Features:
EMA 50 & EMA 200:
Plots two common Exponential Moving Averages (50-period and 200-period) for trend visualization.
⚠️ Important Notes:
This script is meant for educational and research purposes only.
It is designed for high-risk intraday trading.
Signals are based on historical behavior and should not be treated as financial advice.
No stop-loss or take-profit logic is included — traders should manage risk independently.
✅ Summary:
This indicator offers a simple visual and quantitative approach to spot potential intraday turning points for Bank Nifty future on a 15-minute chart, with clear buy and sell markers. It combines volume, price pressure, and moving average smoothing to filter out random price movements.
Nota Keluaran
⚡ Overview:This script is a technical indicator designed for intraday trading on the Bank Nifty future chart using the 15-minute timeframe. It uses a combination of normalized buy and sell pressure along with a Hull Moving Average (HMA) smoothing method and volume-based normalization to detect potential buy and sell signals.
💡 Main Concept:
Buy and Sell Pressure Calculation:
The script calculates:
bp (Buy Pressure): close - low
sp (Sell Pressure): high - close
These values are smoothed using a custom Hull Moving Average (HMA) function, designed to reduce lag and react quicker to price changes compared to traditional moving averages.
📊 Normalized Signals:
Buy and Sell pressures are normalized against their HMA smoothed values.
Volume normalization is also applied to adjust for the effect of market activity on the pressure signals.
📌 Signal Logic:
A Buy Signal is generated when:
Only one signal per day is allowed to avoid signal spamming.
A Sell Signal is generated under the opposite conditions:
One sell signal per day.
🧾 Visual Output:
When a signal is triggered, the script:
Draws a horizontal line at the signal price (with labels like BUY @ or SELL @).
Plots triangle markers on the chart to highlight buy (green) or sell (red) signals.
Deletes or extends lines at the end of each day to maintain visual clarity.
📈 Additional Features:
EMA 50 & EMA 200:
Plots two common Exponential Moving Averages (50-period and 200-period) for trend visualization.
⚠️ Important Notes:
This script is meant for educational and research purposes only.
It is designed for high-risk intraday trading.
Signals are based on historical behavior and should not be treated as financial advice.
No stop-loss or take-profit logic is included — traders should manage risk independently.
✅ Summary:
This indicator offers a simple visual and quantitative approach to spot potential intraday turning points for Bank Nifty future on a 15-minute chart, with clear buy and sell markers. It combines volume, price pressure, and moving average smoothing to filter out random price movements.
Disclaimer:
// This script is for educational and informational purposes only.
// It does not constitute financial or investment advice.
// Trading involves substantial risk and may not be suitable for all investors.
// Always do your own research or consult with a licensed financial advisor
// before making any trading or investment decisions.
// The author is not responsible for any losses incurred using this script
Skrip dilindungi
Skrip ini diterbitkan sebagai sumber tertutup. Akan tetapi, anda boleh menggunakannya secara bebas dan tanpa apa-apa had – ketahui lebih di sini.
Penafian
Maklumat dan penerbitan adalah tidak bertujuan, dan tidak membentuk, nasihat atau cadangan kewangan, pelaburan, dagangan atau jenis lain yang diberikan atau disahkan oleh TradingView. Baca lebih dalam Terma Penggunaan.