PROTECTED SOURCE SCRIPT
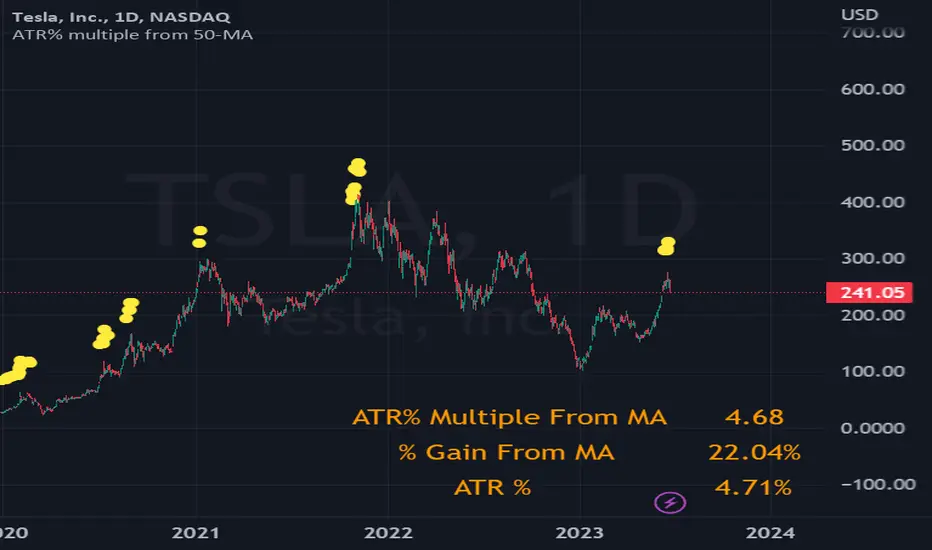
ATR% multiple from 50-MA
Big credits again to TradingView User Fred6724 to develop this tool on my behalf to our community.
How can one measure stock price extension?
In my view, decision-making in the trading business should rely on quantifiable data. A method I personally employ for scaling out and taking partial profits involves setting a threshold based on the multiple of Average True Range (ATR%) from the 50-day Simple Moving Average (SMA). For instance, I find it beneficial to start taking profits when positions exceed 7-10 times the ATR% from the 50-SMA. This practice helps prevent second-guessing or becoming emotionally attached to any particular position.
A relevant example illustrating this concept is the case of PLTR, SOFI, TSLA, VRT, NVDA which experienced a stall and subsequent decline after exceeding 10 times the ATR% from its 50-day moving average.
While there is no foolproof profit-taking mechanism that guarantees selling at the absolute market peak, employing this strategy can be a valuable tool for scaling out profits during extended periods to minimize potential losses.
The formula employed is as below:
A = ATR% = $ ATR / $ Last Done Price
B = % Gain From 50-MA
B / A = ATR% multiple from 50-MA
Skrip dilindungi
Skrip ini diterbitkan sebagai sumber tertutup. Akan tetapi, anda boleh menggunakannya dengan percuma dan tanpa had – ketahui lebih lanjut di sini.
Penafian
Maklumat dan penerbitan adalah tidak dimaksudkan untuk menjadi, dan tidak membentuk, nasihat untuk kewangan, pelaburan, perdagangan dan jenis-jenis lain atau cadangan yang dibekalkan atau disahkan oleh TradingView. Baca dengan lebih lanjut di Terma Penggunaan.