OPEN-SOURCE SCRIPT
Blockunity Regime Monitoring (BRM)
Efficiently analyze market conditions and detect overheating zones.
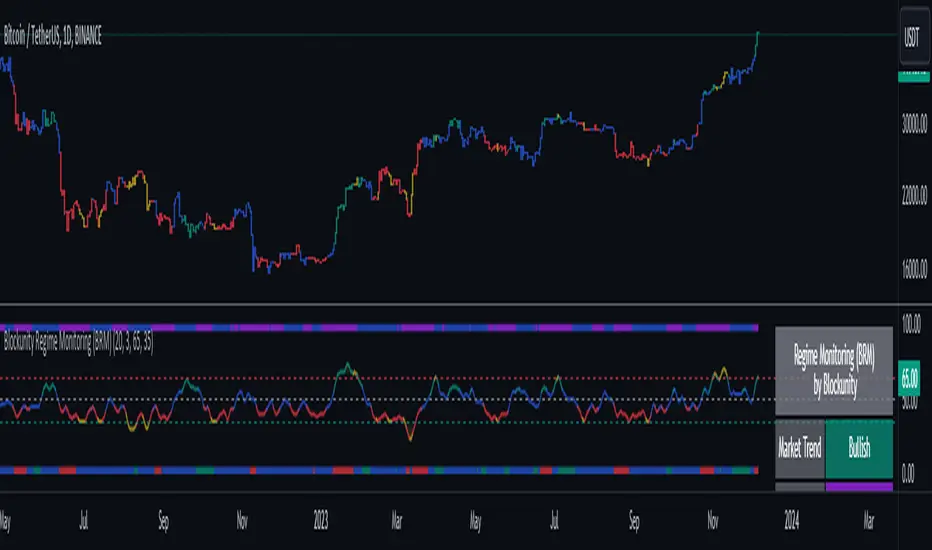
Regime Monitoring (BRM) is here to help you analyze the behavior of financial markets. The oscillator allows you to observe when an asset’s trend is likely to reverse. The trend is also given by the indicator, as is the phase the market is in (trending or congested). The BRM also provides the state of the Choppiness Index, indicating whether or not the asset is about to enter a more volatile phase.
The Idea
The goal is to provide the community with a comprehensive tool for tracking market conditions, with a visual approach to identifying overheating zones.
How to Use
This tool consists of 3 main components:
Elements
The Regime Monitoring oscillator
The oscillator provides several information points. First, it gives the market trend of the asset:
It then indicates areas of overheating, where it is considered statistically probable that we will see a change in trend dynamics. These moments are shown in yellow.
This market trend is also indicated in the table.

If you see that the oscillator is above or below these limits, but not yellow, this is because we use a Choppiness Index to filter this information.
The "Enable Choppiness Index Filter" is enabled by default in the settings. So, if the Chop is discharged (under 38.2), then the oscillator's overheating state is ignored.
You can see the difference in the images below, the first with the filter and the other without:


Market Phase
We use a Vertical Horizontal Filter (VHF) to define the market phase the asset is in. This phase can have two values:

Chop State
Visualize the Choppiness Index, indicating whether an asset is gearing up to enter a phase of increased volatility. It can be:

In addition, with the "Show Choppiness Index" option, you can plot the Chop on the oscillator:

Other Settings
You can also modify the standard Regime Monitoring parameters (Lookback, Smoothing, Limits), display or hide certain components, and change all the colors.
How it Works
Regime Monitoring's main oscillator is established as follows:
We calculate the percentage of times the closing price was higher than the opening price. This is then divided by a lookback period, which in this case defaults to 20. This calculation gives a probability of the current regime.
Regime Monitoring (BRM) is here to help you analyze the behavior of financial markets. The oscillator allows you to observe when an asset’s trend is likely to reverse. The trend is also given by the indicator, as is the phase the market is in (trending or congested). The BRM also provides the state of the Choppiness Index, indicating whether or not the asset is about to enter a more volatile phase.
The Idea
The goal is to provide the community with a comprehensive tool for tracking market conditions, with a visual approach to identifying overheating zones.
How to Use
This tool consists of 3 main components:
- An oscillator, which we describe in detail below.
- Bar color to transcribe oscillator information directly onto the graph. To activate Bar Color, make sure the first option is checked in the settings. You must also uncheck "Borders" and "Wick" in your Chart Settings.
- A panel that summarizes the status of various indicator information.
Elements
The Regime Monitoring oscillator
The oscillator provides several information points. First, it gives the market trend of the asset:
- Green: Bullish trend.
- Red: Bearish trend.
- Blue: Contested trend.
It then indicates areas of overheating, where it is considered statistically probable that we will see a change in trend dynamics. These moments are shown in yellow.
This market trend is also indicated in the table.
If you see that the oscillator is above or below these limits, but not yellow, this is because we use a Choppiness Index to filter this information.
The "Enable Choppiness Index Filter" is enabled by default in the settings. So, if the Chop is discharged (under 38.2), then the oscillator's overheating state is ignored.
You can see the difference in the images below, the first with the filter and the other without:
Market Phase
We use a Vertical Horizontal Filter (VHF) to define the market phase the asset is in. This phase can have two values:
- Trending: Assets evolve within a trend.
- Congestion: The asset is in a moment of congestion.
Chop State
Visualize the Choppiness Index, indicating whether an asset is gearing up to enter a phase of increased volatility. It can be:
- Charged: Chop is considered to indicate to be entering a stable phase.
- Neutral: Chop is neutral and does not provide any specific information.
- Discharged: Chop is considered to indicate a continuation of the trend.
In addition, with the "Show Choppiness Index" option, you can plot the Chop on the oscillator:
Other Settings
You can also modify the standard Regime Monitoring parameters (Lookback, Smoothing, Limits), display or hide certain components, and change all the colors.
How it Works
Regime Monitoring's main oscillator is established as follows:
We calculate the percentage of times the closing price was higher than the opening price. This is then divided by a lookback period, which in this case defaults to 20. This calculation gives a probability of the current regime.
Skrip sumber terbuka
Dalam semangat sebenar TradingView, pencipta skrip ini telah menjadikannya sumber terbuka supaya pedagang dapat menilai dan mengesahkan kefungsiannya. Terima kasih kepada penulis! Walaupun anda boleh menggunakannya secara percuma, ingat bahawa menerbitkan semula kod ini adalah tertakluk kepada Peraturan Dalaman kami.
Blockunity
app.blockunity.io/
unyx-data.com/
contact@blockunity.io
app.blockunity.io/
unyx-data.com/
contact@blockunity.io
Penafian
Maklumat dan penerbitan adalah tidak dimaksudkan untuk menjadi, dan tidak membentuk, nasihat untuk kewangan, pelaburan, perdagangan dan jenis-jenis lain atau cadangan yang dibekalkan atau disahkan oleh TradingView. Baca dengan lebih lanjut di Terma Penggunaan.