PROTECTED SOURCE SCRIPT
RSI BAND – RSI-Based Support & Resistance Levels
📃 Description
RSI BAND is an original technical analysis tool that builds support and resistance levels based on the RSI (Relative Strength Index) indicator. This script is designed to enhance traders' understanding of RSI behavior and provide potential price zones where reversals or continuations may occur.
🔍 What it does
🎯 Key Features
🔬 How to read data

✅ How to Use
Use this indicator to:
📊 Visualizing RSI-Based Levels for Price Action
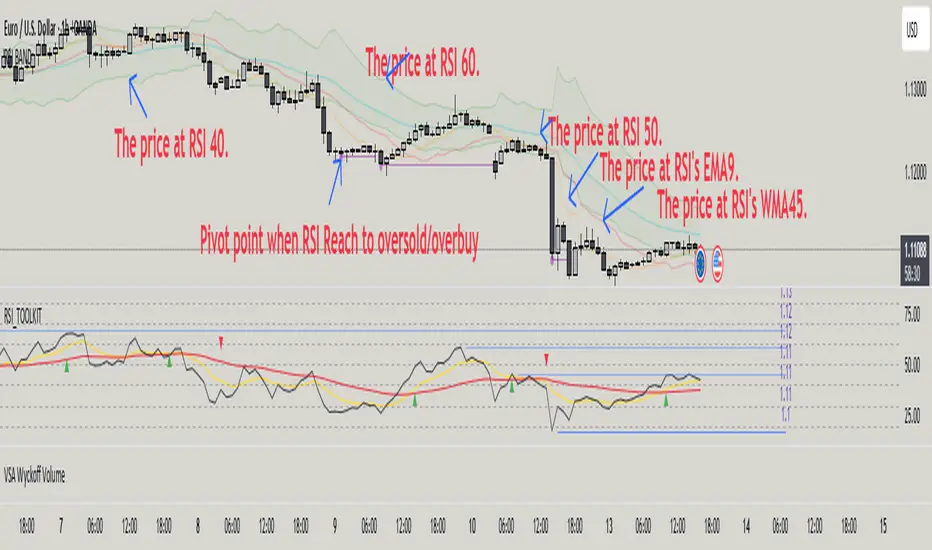
This script plots key RSI-based levels directly onto the chart, such as RSI support, resistance, and the 50-level, to help traders to easily see price action at key RSI zones.
The RSI Resistance and RSI Support levels (such as RSI = 60 and RSI = 40), RSI's EMA9 & WMA45 are plotted on the chart. These levels act as significant price action zones, where traders can anticipate potential reactions from the price based on the RSI's behavior.
By visualizing these levels as plots on the chart, traders can quickly see where price is in relation to these key RSI thresholds, allowing them to make more informed decisions when the price approaches these zones. For example, if the price is near the RSI resistance zone (RSI = 60), it might indicate a potential resistance area where the price could face selling pressure.
By utilizing these RSI-based plots, this script provides a clear, visual representation of key levels, enabling traders to make quicker and more confident decisions in relation to the price action and RSI dynamics.
🧠 Underlying Logic
The script uses standard RSI calculation (length = 14), combined with a reverse-engineered formula to calculate the required price change to reach a specific RSI value. This unique approach creates realistic price levels aligned with RSI expectations, unlike traditional static zones.
Function to calculate price from RSI level:
Pine Script®
Depending on whether the target RSI is above or below 50:
⚠️ Important Notes
Pivot Detection Offset: The script uses an offset of 3 bars to identify pivot points. This means that the pivot high and low points are calculated using the values from 3 bars before the current one. As a result, the pivot points may appear slightly delayed compared to the most recent price action.
No Lookahead Bias: The script does not rely on future data (lookahead bias). It strictly uses past price information for all calculations to maintain accuracy and avoid misleading results. The pivot points are plotted after the price has already formed, ensuring that the script does not predict future price movement but rather reacts to established patterns.
RSI BAND is an original technical analysis tool that builds support and resistance levels based on the RSI (Relative Strength Index) indicator. This script is designed to enhance traders' understanding of RSI behavior and provide potential price zones where reversals or continuations may occur.
🔍 What it does
- Calculates and visualizes horizontal levels on the price chart corresponding to RSI-based thresholds (e.g., RSI = 40, 50, 60).
- Calculates and visualizes horizontal levels on the price chart corresponding to RSI's EMA9 & WMA45.
- Detects pivot highs and lows in the RSI and marks corresponding price levels.
🎯 Key Features
- 🔺 RSI Resistance (e.g., RSI 60) and 🔻 RSI Support (e.g., RSI 40) levels calculated as price zones.
- 📉 Real-time calculation of price levels that correspond to RSI EMA (9) and RSI WMA (45).
- 🌀 Detects RSI Pivot Lows and Pivot Highs.
- 🎯 Includes alerts for Pivot points.
- 🧩 Fully configurable visibility and styling options for each plotted level.
🔬 How to read data
✅ How to Use
Use this indicator to:
- See price action at key RSI levels (40, 50, 60) and RSI's EMA & WMA: For setting up reversal entries.
- Identify RSI's pivot points at overbought or oversold levels: For setting up divergence entries.
📊 Visualizing RSI-Based Levels for Price Action
This script plots key RSI-based levels directly onto the chart, such as RSI support, resistance, and the 50-level, to help traders to easily see price action at key RSI zones.
The RSI Resistance and RSI Support levels (such as RSI = 60 and RSI = 40), RSI's EMA9 & WMA45 are plotted on the chart. These levels act as significant price action zones, where traders can anticipate potential reactions from the price based on the RSI's behavior.
By visualizing these levels as plots on the chart, traders can quickly see where price is in relation to these key RSI thresholds, allowing them to make more informed decisions when the price approaches these zones. For example, if the price is near the RSI resistance zone (RSI = 60), it might indicate a potential resistance area where the price could face selling pressure.
By utilizing these RSI-based plots, this script provides a clear, visual representation of key levels, enabling traders to make quicker and more confident decisions in relation to the price action and RSI dynamics.
🧠 Underlying Logic
The script uses standard RSI calculation (length = 14), combined with a reverse-engineered formula to calculate the required price change to reach a specific RSI value. This unique approach creates realistic price levels aligned with RSI expectations, unlike traditional static zones.
Function to calculate price from RSI level:
f_calc_target_price(targetRSI, close_price, avgGain, avgLoss, rsiLength) =>
targetRS = 100 / (100 - targetRSI) - 1
if targetRSI >= 50
requiredGain = targetRS * avgLoss - avgGain
requiredChange = requiredGain * rsiLength
close_price + requiredChange
else
requiredLoss = avgGain / targetRS - avgLoss
requiredChange = requiredLoss * rsiLength
close_price - requiredChange
Depending on whether the target RSI is above or below 50:
- If RSI ≥ 50, the function estimates the additional gain needed to raise the RSI to the target, and adds the corresponding value to the current price.
- If RSI < 50, it estimates the required loss and subtracts that value from the current price.
⚠️ Important Notes
Pivot Detection Offset: The script uses an offset of 3 bars to identify pivot points. This means that the pivot high and low points are calculated using the values from 3 bars before the current one. As a result, the pivot points may appear slightly delayed compared to the most recent price action.
No Lookahead Bias: The script does not rely on future data (lookahead bias). It strictly uses past price information for all calculations to maintain accuracy and avoid misleading results. The pivot points are plotted after the price has already formed, ensuring that the script does not predict future price movement but rather reacts to established patterns.
Skrip dilindungi
Skrip ini diterbitkan sebagai sumber tertutup. Akan tetapi, anda boleh menggunakannya secara bebas dan tanpa apa-apa had – ketahui lebih di sini.
Day trader with RSI.
RSI 101 at rsi-101.gitbook.io/book
Telegram: t.me/daorsichat
RSI 101 at rsi-101.gitbook.io/book
Telegram: t.me/daorsichat
Penafian
Maklumat dan penerbitan adalah tidak bertujuan, dan tidak membentuk, nasihat atau cadangan kewangan, pelaburan, dagangan atau jenis lain yang diberikan atau disahkan oleh TradingView. Baca lebih dalam Terma Penggunaan.