OPEN-SOURCE SCRIPT
Entropy [ScorsoneEnterprises]
This indicator calculates the entropy of price log returns over a user-defined lookback period, providing insights into market complexity and unpredictability. Entropy measures the randomness or disorder in price movements, helping traders identify periods of high or low market uncertainty.
How It Works
The indicator computes the entropy of log returns (log(close/close[1])) using a histogram-based approach with customizable bins. Log returns are stored in an array of size N (lookback period), and entropy is calculated by:
Binning the returns into bins intervals based on their range.
Computing the probability distribution across bins.
Calculating entropy as -Σ(p * log(p)), where p is the probability of each bin.
A reference Simple Moving Average (SMA) of the entropy, with a separate lookback period (SMA_N), is plotted to highlight trends in market complexity. The entropy plot uses a gradient color scheme (red for lower entropy, teal for higher), while the SMA color shifts based on whether entropy is above (teal) or below (red) the SMA.
Key Features
Inputs:
Lookback Period (default: 50): Number of bars for calculating log returns.
Reference SMA Lookback Period (default: 100): Period for the entropy SMA.
Number of Bins (default: 20): Number of histogram bins for entropy calculation.
Plots:
Entropy: Gradient-colored line reflecting market randomness.
Reference SMA: Trend line to compare entropy against its average.
Interpretation
High Entropy: Indicates chaotic, unpredictable price movements, often during volatile or trendless markets.
Low Entropy: Suggests more predictable, ordered price behavior, often in trending or stable markets.
Compare entropy to its SMA to gauge whether current market complexity is above or below its recent average.
Usage
Use this indicator to assess market regimes. High entropy may signal choppy, range-bound conditions, while low entropy could indicate trending opportunities. Combine with price action or other indicators for confirmation.
Examples

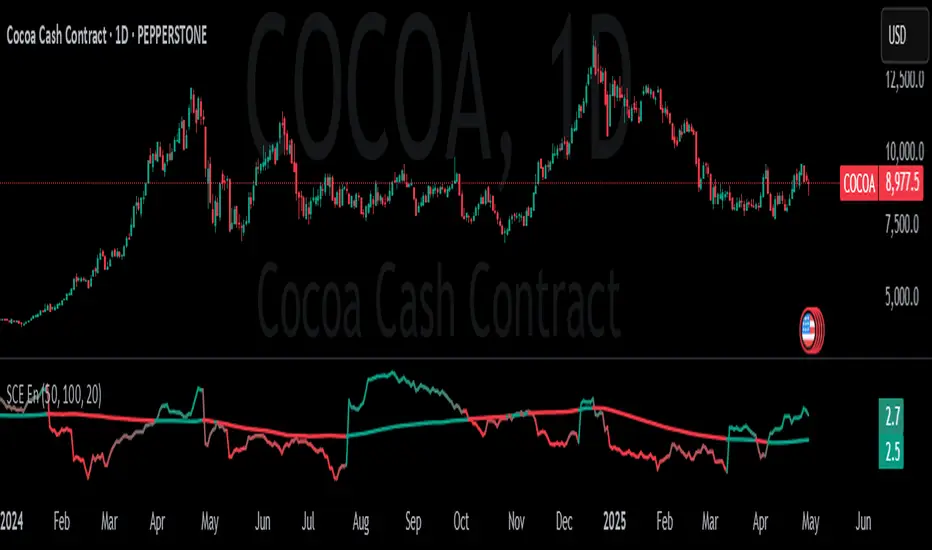
We see on this COCOA chart that when entropy is low it signals a strong trend, either up or down. High entropy signals indecision and choppiness in the market. We can determine this by noticing when the value is above or below its recent average.

Entropy is used in high frequency trading often. It is a nice tool for lower time frames to determine how predictable and strong a trend is.
Inputs
Users can enter the lookback value for entropy, bin count, and the look back for the entropy moving average.
No tool is perfect, the Entropy value is also not perfect and should not be followed blindly. It is good to use any tool along with discretion and price action.
How It Works
The indicator computes the entropy of log returns (log(close/close[1])) using a histogram-based approach with customizable bins. Log returns are stored in an array of size N (lookback period), and entropy is calculated by:
Binning the returns into bins intervals based on their range.
Computing the probability distribution across bins.
Calculating entropy as -Σ(p * log(p)), where p is the probability of each bin.
A reference Simple Moving Average (SMA) of the entropy, with a separate lookback period (SMA_N), is plotted to highlight trends in market complexity. The entropy plot uses a gradient color scheme (red for lower entropy, teal for higher), while the SMA color shifts based on whether entropy is above (teal) or below (red) the SMA.
Key Features
Inputs:
Lookback Period (default: 50): Number of bars for calculating log returns.
Reference SMA Lookback Period (default: 100): Period for the entropy SMA.
Number of Bins (default: 20): Number of histogram bins for entropy calculation.
Plots:
Entropy: Gradient-colored line reflecting market randomness.
Reference SMA: Trend line to compare entropy against its average.
Interpretation
High Entropy: Indicates chaotic, unpredictable price movements, often during volatile or trendless markets.
Low Entropy: Suggests more predictable, ordered price behavior, often in trending or stable markets.
Compare entropy to its SMA to gauge whether current market complexity is above or below its recent average.
Usage
Use this indicator to assess market regimes. High entropy may signal choppy, range-bound conditions, while low entropy could indicate trending opportunities. Combine with price action or other indicators for confirmation.
Examples
We see on this
Entropy is used in high frequency trading often. It is a nice tool for lower time frames to determine how predictable and strong a trend is.
Inputs
Users can enter the lookback value for entropy, bin count, and the look back for the entropy moving average.
No tool is perfect, the Entropy value is also not perfect and should not be followed blindly. It is good to use any tool along with discretion and price action.
Skrip sumber terbuka
Dalam semangat TradingView sebenar, pencipta skrip ini telah menjadikannya sumber terbuka, jadi pedagang boleh menilai dan mengesahkan kefungsiannya. Terima kasih kepada penulis! Walaupuan anda boleh menggunakan secara percuma, ingat bahawa penerbitan semula kod ini tertakluk kepada Peraturan Dalaman.
Penafian
Maklumat dan penerbitan adalah tidak bertujuan, dan tidak membentuk, nasihat atau cadangan kewangan, pelaburan, dagangan atau jenis lain yang diberikan atau disahkan oleh TradingView. Baca lebih dalam Terma Penggunaan.