CF - KAMI KAMI EMA-HMA-VWMA SCALPER
This my greedy minions is the ticket..... the disruptive technology, the red pill, that breaks the Matrix.... get ready to join the revolution.
DESCRIPTION:
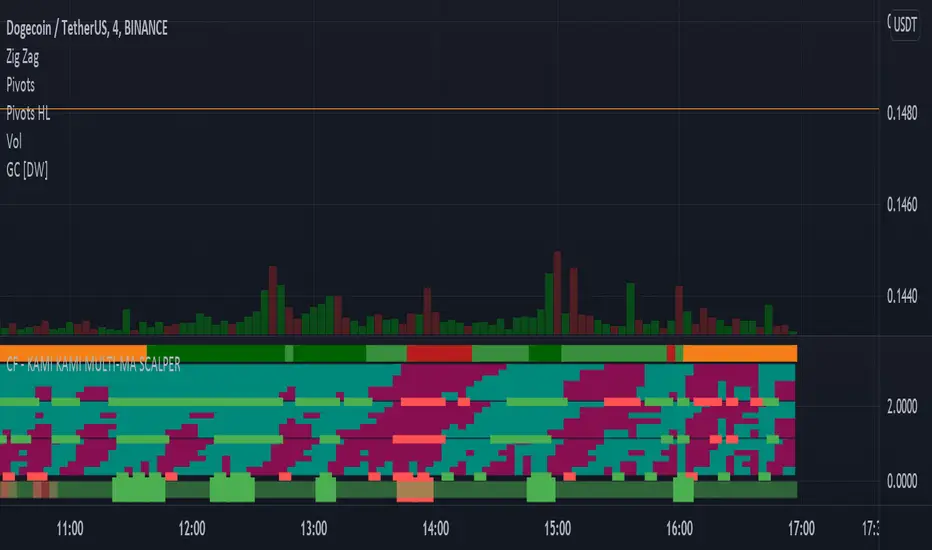
Lowest green/red line
The lowest alternating green red band is simply a general market indicator. It's EMA 50 over 200. This is a generally good indicator of current market conditions. If the band is red, you should favor taking short positions. If the band is green, long positions.
The three MA colored bands
This sophisticated indicator uses 3 central MA's in calculating its goodness. The HMA (Hull's Moving Average), at the bottom (of the three principal bands), is the most sensitive and responsive to immediate market conditions. It will generally give you the signal to enter or exit at the beginning of the price action move. But, this could also be a "false" signal - that doesn't continue in the expected direction.
The middle band is VWMA, volume-weighted moving average, and it is sensitive to volume - so it may turn green or red faster as volume increases or decreases. It gives somewhat similar signals to the top moving average which is the EMA or exponential moving average.
The GREEN RED signals
The signals below the bands which are true green and true red are "SUPER" signals which represent that all of the six small bands of each MA agree. These are very strong signals to enter and exit a position. If multiple SUPER signals agree this is even more confirmation.
SETTINGS
You can change the ema signals. They are currently optimized for scalping, but this indicator can work for larger timeframes.
I couldn't make this open-source as it represents a lot of work to get it to this point. If you are interested in this indicator and would like to have a custom version coded for your purposes, let me know.
In addition, there is a universal "sensitivity" setting for each band which makes it work on different timescales. The larger numbers represent a longer, less sensitive, perspective (for longer trades)
Skrip jemputan sahaja
Hanya pengguna yang diberikan kebenaran oleh penulis mempunyai akses kepada skrip ini dan ini selalunya memerlukan pembayaran. Anda boleh menambahkan skrip kepada kegemaran anda tetapi anda hanya boleh menggunakannya selepas meminta kebenaran dan mendapatkannya daripada penulis — ketarhui lebih lanjut di sini. Untuk lebih butiran, ikuti arahan penulis di bawah atau hubungi cryptofilio secara terus.
TradingView tidak menyarankan pembayaran untuk atau menggunakan skrip kecuali anda benar-benar mempercayai penulisnya dan memahami bagaimana ia berfungsi. Anda juga boleh mendapatkan alternatif sumber terbuka lain yang percuma dalam skrip komuniti kami.
Arahan penulis
Amaran: sila baca panduan kami untuk skrip jemputan sahaja sebelum memohon akses.
Penafian
Skrip jemputan sahaja
Hanya pengguna yang diberikan kebenaran oleh penulis mempunyai akses kepada skrip ini dan ini selalunya memerlukan pembayaran. Anda boleh menambahkan skrip kepada kegemaran anda tetapi anda hanya boleh menggunakannya selepas meminta kebenaran dan mendapatkannya daripada penulis — ketarhui lebih lanjut di sini. Untuk lebih butiran, ikuti arahan penulis di bawah atau hubungi cryptofilio secara terus.
TradingView tidak menyarankan pembayaran untuk atau menggunakan skrip kecuali anda benar-benar mempercayai penulisnya dan memahami bagaimana ia berfungsi. Anda juga boleh mendapatkan alternatif sumber terbuka lain yang percuma dalam skrip komuniti kami.
Arahan penulis
Amaran: sila baca panduan kami untuk skrip jemputan sahaja sebelum memohon akses.