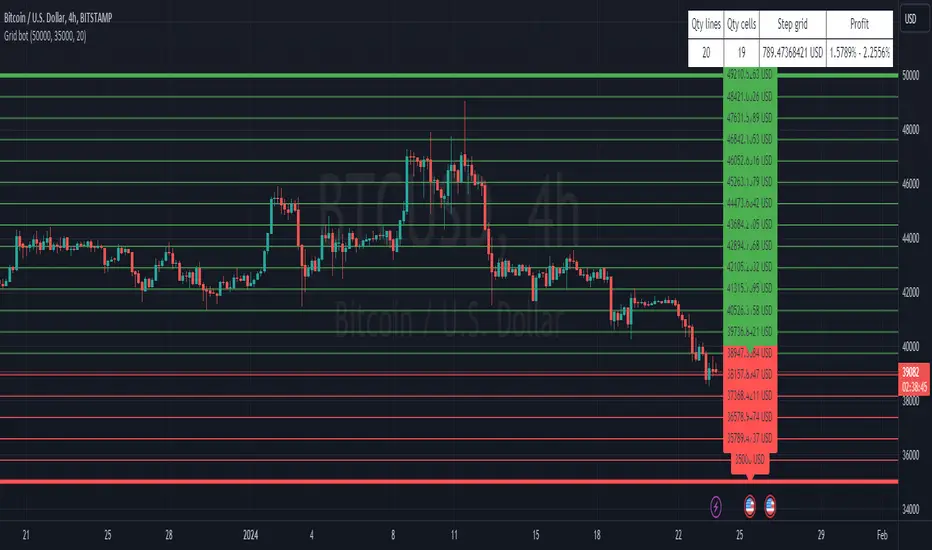
3commas GRID bot VisualisationHello everyone
This is a grid display indicator for a 3-comma grid bot.
Just enter the upper and lower borders of your grid and the number of grid cells in the indicator settings.
It's simple!
3commas
SuperTrend+EMA Strategy [PineMyths] #1Indicator List
EMA(20) (Built-in)
SuperTrend(10,3) (Author: Kıvanç Özbilgiç)
Strategy Rules and Conditions
LONG Side
SuperTrend indicator is bullish (Green)
EMA(20) above SuperTrend
Bar open is above EMA(20)
Price touches EMA(20)
SHORT Side
SuperTrend indicator is bearish (Red)
EMA(20) below SuperTrend
Bar open is below EMA(20)
Price touches EMA(20)
Stop: SuperTrend indicator value that when the entry conditions are met
Take Profit: 2 x Risk

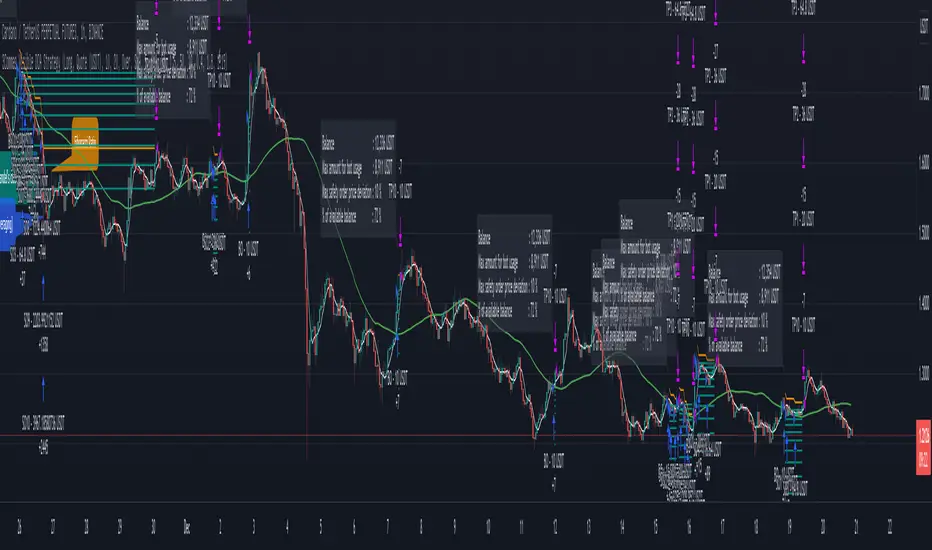
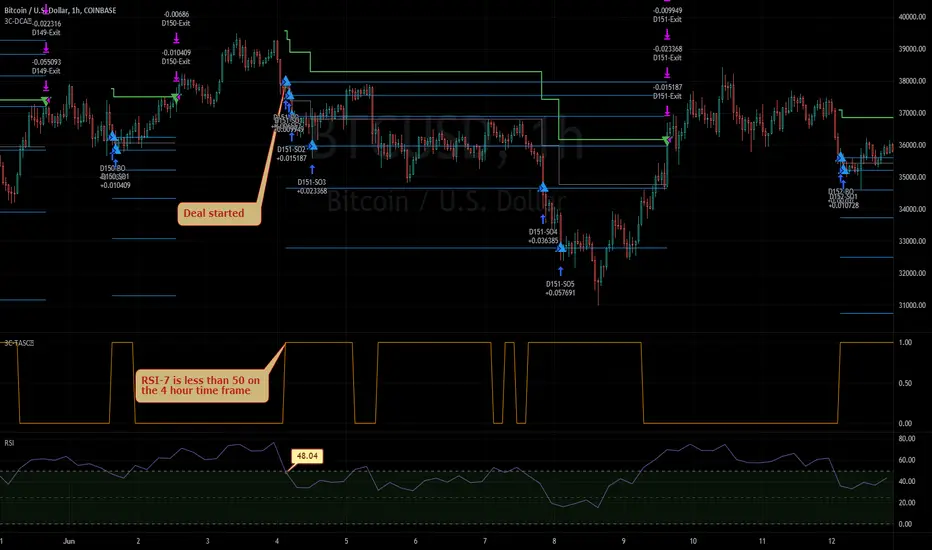
TTP AF Sim ProThis indicator helps you visualise, practice, manage and automatically add funds to DCA deals that are in negative.
Multiple factors factors are relevant when trying to exit a bad deal:
How much funds are invested
What's the current average position price
How far the price has already dropped from that average
Is the price bouncing significantly and frequently to the upside providing multiple opportunities to exit or is it still a free-falling knife dumping heavy?
What are your TP % expectations
This indicator allows you to enter all these parameters visualising them all together in a single chart. The chart will show you based on all this information how much funds you would have required to exit in profit and rescue the deal in green. It will also flag if the exit strategy would have failed by plotting a red label indicating all the times where the TP wouldn't have been reached.
The exit strategies
In this pro version you have access to edit all settings and the added ability to use an external indicator as source:
Custom external indicator as source
Relative Strength Index (RSI)
Commodity Channel Index (CCI)
Money Flow Index (MFI)
Bollinger Bands (BB)
Automated Add Funds-alert
With this indicator you can also add funds to the deals automatically:
Every time the conditions are true an alert is sent
Add Bot ID and Email Token for the deals
Select automatically calculated volume or your own custom
Tweak your exit strategy to your liking and add your Bot ID and Email Token to automatically add funds to your open deals.

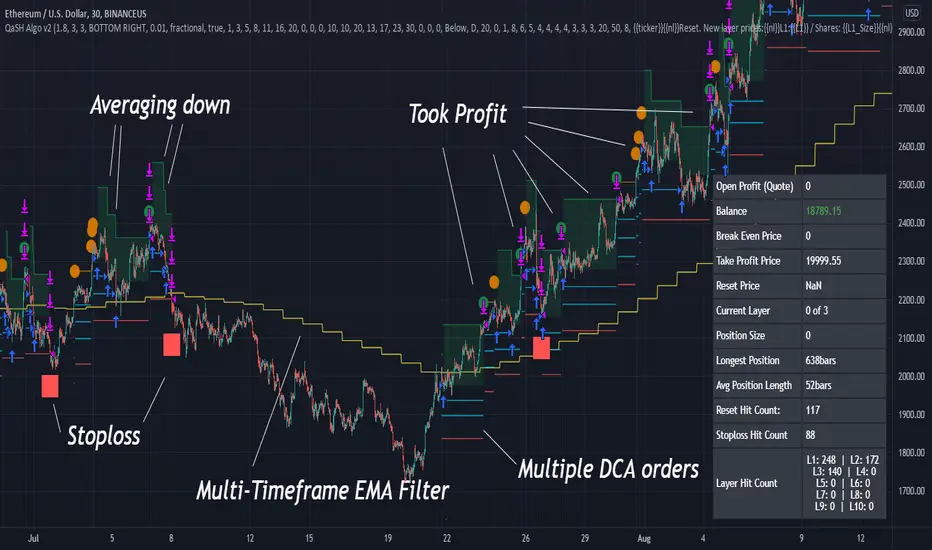
TTP AF SimThis indicator helps you visualise, practice, manage and automatically add funds to DCA deals that are in negative.
Multiple factors factors are relevant when trying to exit a bad deal:
How much funds are invested
What's the current average position price
How far the price has already dropped from that average
Is the price bouncing significantly and frequently to the upside providing multiple opportunities to exit or is it still a free-falling knife dumping heavy?
What are your TP % expectations
This indicator allows you to enter all these parameters visualising them all together in a single chart. The chart will show you based on all this information how much funds you would have required to exit in profit and rescue the deal in green. It will also flag if the exit strategy would have failed by plotting a red label indicating all the times where the TP wouldn't have been reached.
The exit strategies
In this basic version you have access to well tested and pre-defined conditions with the following indicators:
Relative Strength Index (RSI)
Commodity Channel Index (CCI)
Money Flow Index (MFI)
Bollinger Bands (BB)
Automated Add Funds-alert
With this indicator you can also add funds to the deals automatically:
Every time the conditions are true an alert is sent
Add Bot ID and Email Token for the deals
Select automatically calculated volume or your own custom
Select exit strategy and add your Bot ID and Email Token to automatically add funds to your open deals.

MATIC/USD 1H Bot for 3commas (works w/o 3commas too)This is a MATIC/USD or USDT specific implementation of my BNB/USD 1 hour bot. It should work out of the gate correctly for MATIC, at least based on what has been happening with it for the past seven weeks. You can fiddle with the following settings using the gear icon:
Fast and slow MACD length
The decision to use RSI thresholds as requirements for buys and/or sells, as well as the chart timeframe to use for that (make sure you use the same timeframe as your chart or a higher timeframe. You don't want to use a 1m RSI on a one hour chart but you can use a 4 hour RSI on a 1 hour chart with no issues.)
Buy and/or sell RSI threshold limits
Trailing stop loss %
Start date (for backtesting, I usually leave mine with 1-2 months trailing as those are usually better indicators than how they would have performed over the past few years)
Stress levels
Moving Average length and type
Linear regression amount
The gist of this bot is that it will use a smoothed EMA to make informed buys and sells. The smoothing prevents most noise from affecting your orders. It also allows you to set a trailing stop loss. If you don't want to use this feature set the value to 100 and it will effectively disable it.
Finally, you can disable RSI threshold point visibility. This won't affect bot operation, it just makes it cleaner to look at on your chart. Disabling RSI buys or sells will also disable visibility.
This bot takes a shotgun strategy to buys and sells. It makes a lot of buys and the majority of them are closed with little to no movement up or down. However, the ones that are profitable make a LOT as you will see once you start testing.
I make the full version of these bots available (though the script is protected) so users can test them, however if you want to use it with 3commas you will need access to the full script. Message me if you want the code and we can figure something out.

Multiple Timeframe RSI Bot for 3commas (works w/o 3commas too)Overview
A few days ago I wrote a new RSI-based strategy. The idea was that you could set up buy and sell RSI thresholds and when RSI crossed that threshold it would make a buy or a sell depending on which one it hit. It worked very well on multiple coins that I tested. I then started to think that maybe there was a better way to execute this concept using multiple timeframe RSIs and this bot represents that idea. It is better and more versatile than the previous bot in every single way. In fact at this point I think this is my most elegant bot to date. It's not as flashy as my other scipts but it is an extremely reliable performer and comes with lower risk than some of my other more outlandish automated trading ideas.
Concept
This script monitors the RSI of all timeframes you have picked in settings and displays chosen values on your chart. It defaults to 5m, 15m and 30m enabled with the rest of the timeframe options disabled and it will only show the RSI chart of timeframes you are currently using. You can specify one or more (in any combination) from the following list:
1m
5m
15m
30m
1h
4h
1d
1w
On each bar it checks each timeframe's RSI value to see if it is is lower (for a buy) or higher (for a sell) than the respective threshold you have picked in settings for that timeframe. On any given bar if enough of your used RSI values are above or below their respective thresholds to be equal to or greater than your set Number of Thresholds for Buy value a buy or sell is executed. In other words, when the number of total (different timeframed) RSI buy thresholds currently met is equal to or greater than the Number of Thresholds for a Buy value you set in settings, a buy is placed. Similarly, when the total number of differently timeframed RSI sell thresholds currently hit is equal to or greater than the total sell threshold you have in settings, a sell is placed.
I have had the best results using 5m, 15 and 30m together with the total threshold value for both buys and sells set to three which is what I left as the default. However, there are limitless ways to use this and I'm sure that over the coming months I will come up with some more creative ways to use it. Please experiment a bit and if you feel like sharing you can comment on this page as to what you find works best.
Like all my scripts this includes a date backtester. I have the start date set to Nov 1, 2021 because I feel you should never backtest a new strategy on older data if you don't specifically have a reason to do it. You likely won't get reliable results, hence the date selector.
Settings
Number of Thresholds for Buy
This is a global setting. You can use any positive whole number here that is one or greater. If it is set to one, one or more of the RSI thresholds you have selected for each chart timeframe will need to be lower than the RSI threshold value you have set for that particular timeframe's settings and once that happens the bot will buy. For example, if I have this value set to (1) and I am using a 5m, 15m and 30m chart, a buy will be placed on the first bar that any of these RSIs drop to below the respective value you have set for them in settings. If I have it set to two in the same scenario, I will need at least two RSI values to be below their respective thresholds. Since each RSI value is set separately you have a ton of creative options here. I refer to the number of currently met RSI buy thresholds per bar as 'buy count' going forward in this document. The buy count resets to zero each bar which means they will all need to be met on the same bar. You will need to make sure this setting is equal to or less than the number of differently timeframed RSIs you are using or it won't ever buy. For example, if you are using only a 5m and 15m RSI but I have the Number of Thresholds for Buy set to three it will never make a buy because you will have at max two thresholds met.
Number of Thresholds for Sell
This is the same concept above except for sells obviously. I chose to make these independent for maximum flexibility but you can obviously use the same value for both if you'd like. I refer to the number of currently met RSI sell thresholds as 'sell count' for the rest of this document. You will need to make sure this number is equal to or less than the number of differently timeframed RSIs you are using or you will potentially get a buy but never a sell. Use the backtester to figure this out or message me if you get stuck.
Display Multi RSI Table?
This will show you all of the available RSI settings that are currently in play. Note that only timeframes which are equal to or higher than your current TradingView chart timeframe will be accurate. This is due to the fact that these values are looked up once per bar, so if you are set to a 1h chart you won't get 5m values every 5m, instead getting the 5m RSI once per hour. For best results set your chart to the lowest timeframe that you have enabled from the options below this.
Use XX RSI?
This turns a particular timeframe's RSI off and on. If you turn it off it will disappear from the chart and its thresholds won't be applied to the strategy.
XX RSI Length
You can set the RSI length for each timeframe you want to use separately. The default value is 14.
XX RSI Buy / Sell Threshold
These are all also set separately for each timeframe. Any time XX timeframe's RSI is below the Buy Threshold for that timeframe it will increase the buy count by +1 for that bar. Since the count resets to zero each bar, you will need to have at least your Number of Thresholds for Buy worth of RSI values below their respective thresholds on any given bar for a buy to happen. The opposite is true for sells.
Usage
For each timeframe you pick you will also need to set a buy and a sell threshold. I have the defaults set to 30 and 70 which is pretty standard but you should experiment and see what works best for you. Each individual timeframe has its own buy and sell threshold which makes this script about as customizable as you want it to be.
Set your chart to the lowest timeframe that you are using, ie if you are using 1h, 4h and 1d use a 1h chart. If you are using 5m, 15m and 30m use a 5m chart. You need to do this because it will only refresh each RSI on the interval your chart is set to, so if you have 5m, 15m and 30m but use a 1h chart the strategy will basically lose most of its effectiveness because there should be twelve different 5m RSI values in each hour but you will only recalculate once every hour since your chart is set to one hour, and will therefore only get one 5m value, one 15m value and one 30m value per 1h bar. If you don't understand this just trust me and set it to the lowest timeframe you are currently using.
I didn't put a stop loss in this version but I will in the next update.
I think that's about it! If you have questions please ask. I give access to this script away for free for testing but in order to use it with 3commas you will need the entire script. Message me if you want it and we can figure something out.

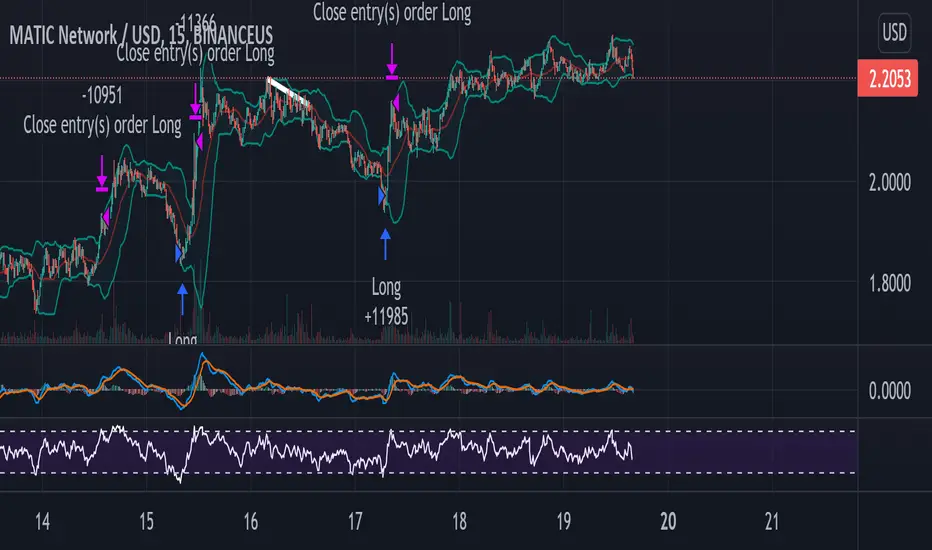
RSI-based strategy for MATIC on 3commas - uses a 15m chartI looked all over TradingView and could not find a script that specifically does this so I wrote one. It's not complicated but it works pretty well. Essentially the concept is that you specify two RSI values: a buying threshold and selling threshold. The indicator will make buys based on RSI crossing your buy threshold and sells based on it crossing your sell threshold.
You can change the actual RSI parameters though I have found it works best with the default settings I have listed. It is set for a 15m MATIC chart but you can use it with anything on any time period but you will need to modify the thresholds and check the backtester if you use it on anything other than a 15m MATIC chart.
There is also a date range selector so you can test it over a specific time period. I typically use the past 1-2 months to get a good feel for if the settings I have picked work well in current market conditions.
It also functions as a regular RSI indicator so if you use this you probably don't need to apply any other RSI indicators to your chart.
I have made the indicator usable so that you can test it out manually to verify that it works as expected and if you want access to the script itself (to enable automated trading on 3commas) please message me and we can work something out.
In the future I might add some extra settings to this like a smoothed EMA so you can make more discerning buys, it depends on how many people contact me for the full script.
Zendog V3 backtest DCA bot 3commasMAJOR UPDATE:
- Update to Pinescript v5
- MAJOR refactor for the logic of how orders are placed. BO order is placed when the condition is first encountered and we are not in a deal.
The extra SO orders (if based on price movement) are all placed on the next candle after BO order, instead of each being placed one after another.
Take profit (if percentage) and Stop loss are placed on the first candle after BO order because if BO and TP are on the same candle TV does not execute properly.
These changes should improve strategy accuracy when multiple prices are hit by the same candle.
- NEW FEATURE: Support to Stop deal using an external indicator (i.e. stop long deal when RSI > 80)
- NEW FEATURE: Support to trigger Safety orders using an external indicator (i.e. trigger each additional SO when RSI < 10, regardless of price movement)
The price movement logic may be implemented in the indicator that plots start / end signals. The SO size is calculated using the configuration of steps.
- NEW FEATURE: Safety order command for 3commas bot. This is implemented using Add funds in the quote currency (for pair BTCUSDT the quote currency is USDT)
The SO size is calculated using the configuration of steps, for exact order size (and price) use the built-in Steps table.
- NEW FEATURE: Addition of extra columns to the steps table: Required price for TP, Required % change for TP, Required % change for BEP (Breakeven point)
- Update to steps table to remove prices when Safety orders are not based on % price change
- The code is opensource. I will not be able to sustain merges for the script, but feel free to use and develop your own version and ping me on discord to review them
and maybe include in the original script

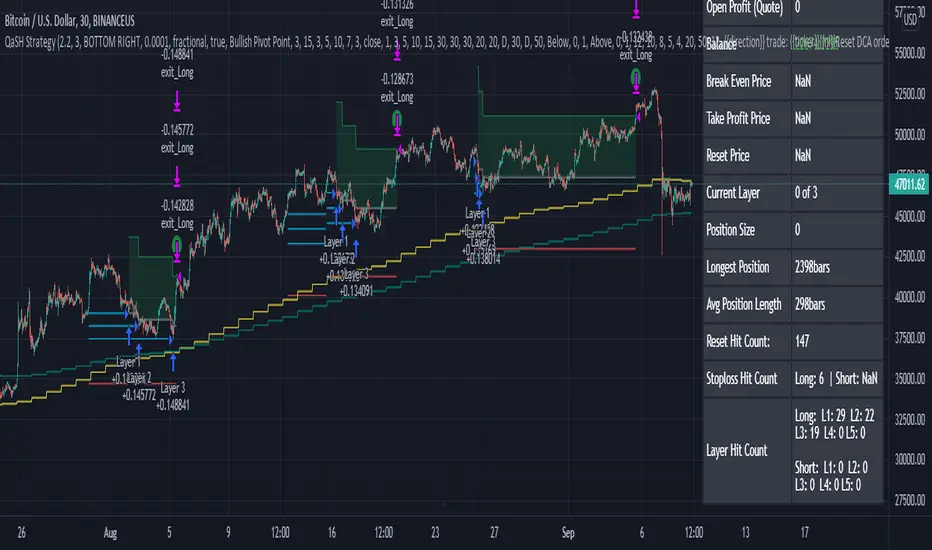
QaSH DCA Ichimoku Cloud
This powerful script takes the classic Ichimoku Cloud strategy and revitalizes it by allowing the user to make multiple DCA orders on each trade. Spreading your entry through DCA orders allows you to give the entry point room to breathe, and average down your position as the volatility momentarily pulls price against you. Both long and short positions are possible, each limited to a maximum of 5 DCA orders per trade.
When the Ichimoku cloud is showing bullish direction, only long trades will be allowed. During bearish direction, short trades will be allowed.
Two additional multi-timeframe EMA's can be added and used as filters for the long and short entries.
If you like you can use as little as one entry order per trade:
Or you can use up to a maximum of 5 DCA orders

3Commas Visible DCA StrategyThis strategy consists of the following elements and can all be set by the user.
1. Entry by moving average cross.
1) Selection of moving average line.
- SMA(Simple Moving Average)
- EMA(Exponential Moving Average)
- HMA(Hull Moving Average)
2) Selection of Cross over / Cross under
2. Add Entry by DCA(Dollar Cost Averaging)
- A DCA strategy is the practice of investing into a currency at preset intervals to reduce the entry price of a position over time and mitigate volatility risk.
For example,
Base Order = 10 Dollar at Price 100%
Safety Order1 = 20 Dollar at Price 90%
Safety Order2 = 40 Dollar at Price 80%
Average Price => Price 80~90%
thereby getting a better average price for your position and greatly reducing risks from the consequences of volatility.
3. Target Price and Stop Loss.
1) Target Price : Realize profits at % set from the average unit price.
2) Stop Loss : Stop Loss % set from the last safety order.
You can easily find out what's related by changing the setting value after setting the strategy.
This strategy has the following Good characteristics.
1. It informs you of the assets required according to DCA settings.
If you are short of assets, a warning sign will appear.
2. Amount of assets invested in each long entry and long entry close.
3. Visibility of the lowest purchase price line and DCA purchase location according to DCA setting.
easily check the values set in the backtest.
I hope it will help you. Thank you.
Instrument-Z (3Commas Bot)Instrument-Z is what I am currently using as my 3Commas Bot.
It allows you to customize signals from 3 indicators; Crossing MA's, Stochastic RSI, and WaveTrend.
Better yet, it allows you to setup these signals separately depending on whether the Trend MA is going up or down.
So there are 2 sets of inputs for everything, Uptrend inputs and Downtrend inputs.
I have realized that we can't expect a strategy to work the same way in an uptrend vs downtrend, so the inputs should be separated too.
In my testing, separating increased the net profit by 60% on average.
You can select whether you are trading Long or Short.
You can choose your stop loss and take profit levels as well as trade expiration.
You can choose if you only want to trade with the trend (making the opposing signals irrelevant).
The trend is based on the Trend MA.
This script is specifically for cryptocurrencies.
I've noticed that MA crosses on other asset classes are unreliable because the fluctuations are not strong enough to push the MA's across each other in a meaningful way.
If you want to use this as a 3Commas Bot, then you will have to copy the code of the strategy and paste it into your own personal script.
Then you have to change the alert messages at the bottom of the script.
Make sure to change your alert message from this;
{"message_type": "bot", "bot_id": 0000000, "email_token": "0b000a0a-0aa0-00aa-0aa0-000a00000a0a", "delay_seconds": 0}
To this;
{ \"message_type\": \"bot\", \"bot_id\": 0000000, \"email_token\": \"0a000a0a-0aa0-00aa-0aa0-000a00000a0a\", \"delay_seconds\": 0 }
With after each new line and \ before each quotation.
In the Alert setup, select "alert() function calls only".
This indicator is like a middle ground of complexity between the Juicy Trend indicator and the Instrument-A indicator.
And because it does not feature my neural network project, I have made it open script.
Enjoy!

3Commas DCA Backtester + TBO3Commas DCA bot users rejoice! Have you ever wanted to know how your 3Commas DCA bot would have performed with slightly different settings? Or a different deal start condition? Another safety trade? We've combined the logic of 3Commas DCA Bots with TradingView's powerful strategy backtester to FINALLY help 3Commas users backtest their bot settings.
There are several things to be aware of with this strategy:
There is no bot assistant in TradingView, so you'll have to enter in your funds for bot trading in the "Initial capital" section in the Properties tab of the settings.
Even though you can use simultaneous deals with this strategy, there is no way on TradingView to collectively backtest multiple trading pairs with a single instance of this strategy.
We have created all of the available deal start conditions natively available in 3Commas DCA Bots PLUS the TBO and its trigger symbols (Open Long, Close Long, Cross Up, Breakout, Open Short, Close Short, Cross Down, Breakdown). The strategy uses ASAP (as soon as possible) by default.
3Commas DCA Bots use a built-in AND logic for the deal start conditions, meaning that deals will only start when ALL deal start conditions are true. This logic is included in the strategy, however we also provided the option to use OR logic, which will trigger a deal if any of the selected deal start conditions have been met.
Use your own indicators by selecting the "external" option under deal start conditions.
Cooldown between deals cannot use seconds as this is a limitation in TradingView (the strategy will only run on the current timeframe you are viewing), so this has been changed to "next bar."
Customize your backtests in our look back section. Select a specific start and end date for your back test results.
Use the strategy to send alerts directly to your 3Commas bots by providing your bot ID numbers and your email token (found in the JSON code when viewing your bot's overall settings).
Some things to keep in mind while using the back tester:
Enable Buy & Hold Equity to compare your bot strategy and settings.
The back tester can't guarantee future results based on past performance.
Stop losses will result in poor performance. Take advantage of DCA strategy and use safety trades.
Settings for the strategy shown are:
Bot type: Long
Take Profit type: % Quote
Base order: 25
Safety order: 50
Deal Start Conditions:
Custom - OR
TBO Breakout
15m Strong Buy
1h Strong Buy
4h Strong Buy
Target Profit: 4
Max Active Safety Trades: 2
Price deviation in %: 8
Safety order volume scale: 2
Safety order step scale: 2
Simultaneous deals per same pair: 3
Lookback:
2020-05-11
9999-01-01

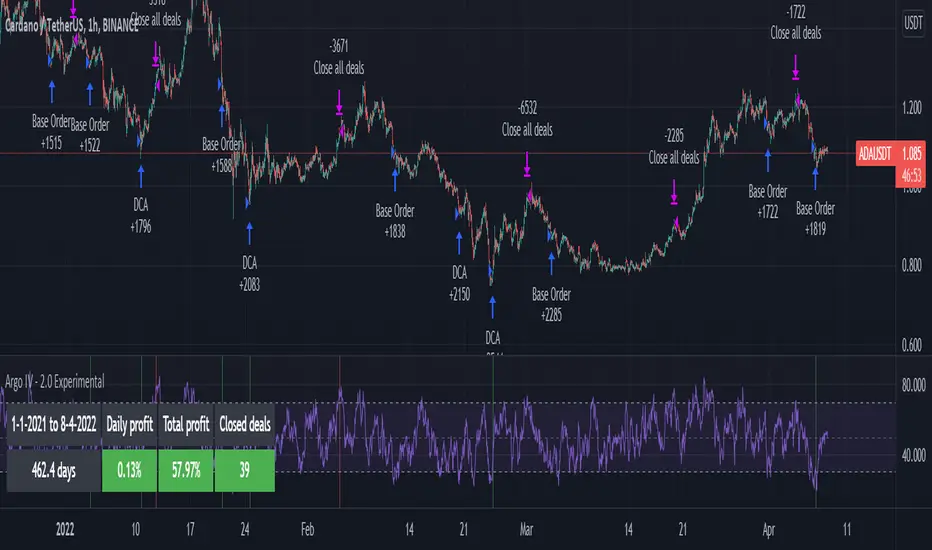
Argo IV - EXPERIMENTAL strategy for 3commas with alertsThis strategy lets users create BUY/SELL alerts for 3commas single bots in a simple way, based on a built in set of indicators that can be tweaked to work together or separately through the study settings. Indicators include Bollinger Bands , Williams %R , RSI , EMA , SMA , Market Cipher, Inverse Fisher Transform, RSI divergence.
It is based on the ARGO I study ( here ), with the following major differences:
- It uses pyramiding (see strategy "properties")
- It includes a lot of new options for deal start/close conditions for maximum control
- It doesn't require any external tool to backtest.
If the user choses to create both BUY and SELL signals from the study settings, the alert created will send both BUY and SELL signals for the selected pair. Note the script will only send alerts for the pair selected in the study settings, not for the current chart (if different).
Important : it is only an early experiment, I will only release the script when satisfied with performance. Until then, I advise not to use this for any real trading.
How to use:
- Add the script to the current chart
- Open the strategy settings , insert bot details. Pairs MUST be in capital letters or 3commas will not recognize them.
- Still in the settings, tweak the deal start/close conditions from various indicators until happy. The strategy will plot the entry / exit points on the chart
- When happy, right click on the "..." next to the study name, then "Add alert'".
- Under "Condition", on the second line, chose "Any alert () function call". Add the webhook from 3commas, give it a name, and "create".
QaSH DCA StrategyThis is a backtesting script that demonstrates the power of incorporating dollar cost averaging into your trading strategies. Catch the bottom of those lightning fast dips buy placing your limit orders ahead of time.
Four entry conditions have been included:
- ASAP mode
- Quickfinger's Luc
- Bullish pivot point
- Bearish pivot point
An EMA-based entry condition filter is included
Placement of all DCA orders is adjustable, and "take profit" % is also variable and can depend on the size of the price dip.
QaSH DCA DaytraderThis script takes advantage of the power of DCA implemented in the QaSH DCA Algorithm script, and it applies it to new entry conditions. A "Quickfingers Luc" mode has been added, which creates new entry orders whenever a level of support has been identified. If price breaks the support level and quickly drops down, the orders will already be in place to catch the dip. This method can even catch the 1-second long, 50% flash dips that occur in some exchanges.
Four entry conditions are included in this initial release : ASAP, Quickfingers Luc, Bullish Pivot point, and Bearish Pivot point
All order placements are customizable
All take profit % values are based on the average entry price
Take profit % values can change based on how big the price dip was
Entry condition filter has been added and it uses a variable timeframe EMA
Stoploss function is available
Order size can be sent in the alerts, which allows for multiple setups to be running simultaneously in one account
All alerts are sent using the new "Any alert() function call" feature, which means this indicator will only take up one alert slot to cover all entry and exit alerts
Settings advice:
- If you think price is inflated, try conservative settings that either use a stoploss and EMA filter, or no stoploss but have some of your orders placed far below the current price with increasing volume. In a bear market this will beat the buy and hold.
- If you think the market is ready for a new bull run, then try experimenting with very aggressive settings to beat the buy and hold. For example: ASAP mode with 3 layers turned on. Orders placed at 0.5%, 3%, and 5%. Volumes at 30%, 30%, and 40% respectively. No stoploss. These settings were tested on ETH and beat the buy and hold during an extreme bull market period.

QaSH DCA Algorithm 2.0This is the strategy version of the QaSH DCA Algorithm indicator. This strategy version of the script includes live trading alert functionality, so it can be considered as a replacement that makes the indicator version obsolete. With this version, features have been added and also you can take advantage of TradingView's native backtesting system for more detailed backtest results.
QaSH DCA Algorithm implements a DCA strategy that takes advantage of price volatility by buying dips to average down, and adjusting price targets as the break-even price gets lower.
How does the DCA strategy work?
When the specified entry condition has occurred, the indicator will set up several limit orders below the current price. If price goes up a specified amount, then the layers will be overwritten at the higher prices. If price goes down and fills the first layer (limit order), then the Take Profit price is plotted and will be sent in an alert. If more layers are filled, then the TP price will move down accordingly as it’s based on the average entry price (alerts on each TP update). This action of lowering the average entry and TP price mitigates your risk, and increases the likelihood of a Take Profit event happening. This script uses a simple "ASAP" mode, where each deal will start exactly 2 bars after the last trade ended. An EMA filter and stoploss function was also added for risk management.
How does this differ from other DCA bots?
1) The layer placements, order volume , and “take profit %” for each layer or “safety order” is much more customizable than what you get from other services. For example, I can choose to have my TP% change, depending on how big the price dip was. Maybe on safety order 1 I want 10% TP, but on safety order 7 might want a 2% TP.
2) The entry condition is adjustable. For example, this script has an ema filter for entries.
3) Settings optimization. You can take advantage of the replay feature and TradingView's backtest system to see how trades would have played out, and how much PnL you would have made
4) You can use this indicator on more than just crypto. You can easily set up alerts for manual trades on stocks, or you can integrate it with your stock broker API of choice and automate your trades.
5) When combining this with an automation service, you will get unmatched execution speed by running it on your dedicated machine.
6) I can offer a lifetime subscription to the indicator upon request.
What kind of market is it best used on?
QaSH DCA Algorithm is best used on assets that are volatile. That means large and frequent swings up and down. Also I recommend running this on many uncorrelated assets at the same time. Better yet, run it with a variety of different settings simultaneously on the same asset.
What settings should I use?
The default settings are decent for most markets, and provide a good balance between profit potential and downside protection, although you can use a wide variety of settings. In a strong bull market its best to either bring up your layers to catch smaller dips, or you can go big on the first few layers (maybe 4 layers, 25% on each layer for example). In a sideways or brearish market you'll want more downside protection, so you'll want the larger orders to be at lower prices, or possibly use the stoploss and EMA filter.
Argo II - (alerts for 3commas composite bots) - publicThis script lets users create BUY/SELL alerts for 3commas composite bots (1 alert = 12 pairs) in a simple way, based on a built in set of indicators that can be tweaked to work together or alone through the study settings.
There is a version of this script for single pair bots, with slightly more features here .
If the user choses to create both BUY and SELL signals from the study settings, the (1) alert created will send both BUY and SELL signals for all 12 pairs selected. At this stage, the script forces the user to select 12 pairs in the study settings. If less pairs are inserted, it will not work. Also, the script will only send alerts for the pairs selected in the study settings, not for the current chart (if different).
How to use:
- Add the script to the current chart
- Open the study settings , insert bot details and select 12 pairs. You should write the pairs manually, using the format BTC , ADA, ETH, etc. They MUST be in capital letters or 3commas will not recognize them.
- Still in the study settings, tweak the deal start/close conditions from various indicators until happy. The study will plot the entry / exit points below the current chart (1 = buy, 2 = sell)
- Make sure your strategy works for all the pairs you have selected, simply by checking each chart with the same study settings
- When happy, right click on the "..." next to the study name, then "Add alert'".
- Under "Condition", on the second line, chose "Any alert () function call". Add the webhook from 3commas, give it a name, and "create".
That's it.
Notes:
- If you insert coins that are not available for the quote currency and exchange of your choosing, the script will not work and return an error.
- Make sure you run tests with paper trading or dummy bots (i.e without actual bot ID) to ensure your alerts trigger as intended on all coins.
- If alerts trigger too much (i.e they all trigger at the same time for all coins), Trading View will stop the alert. So probably not ideal for a scalping bot. It could also be the sign the script doesn't work as intended.
- The script is a bit slow on my side. I am a beginner in pinescript, so if anyone knows how to simplify it, please let me know.
- if anyone knows how to tell the script to function with less than 12 pairs (when not filling the 12 fields in the setting), please also let me know :)
CDC Action Zone - 3Commas AlertCDC Action Zone, The well know indicator using EMA 12 and EMA 26.
When EMA 12 crosses EMA 26 will be a signal to trade.
You can change EMA that you want from settings.
This indicator work with 3Commas - Crypto DCA Bot . (Tradingview custom signal)
You can get a "BOT ID" and "Email token" from 3Commas when you create a bot.
Add into text box in indicator's settings.
After that create alert in Tradingview
Check webhook and using Url below for send signals to 3Commas bot.
3commas.io
This indicator will alert 40 Symbols at one time. (Tradingview set max symbols at 40)
If you want to alert more than 40 symbols, you can change symbols from settings and create new alert.

TradingGroundhog - Fundamental Bot Automation - Fractal/Wave -V1PLEASE READ THE DESCRIPTION - AS THE SCRIPT IS USED FOR AUTOMATION AND TRADING PAIR SWITCH THE MECHANISM CAN BE COMPLICATED TO UNDERSTAND
#-- Pairs Switching - No Repaint - Fractals - Wavetrend --
This strategy uses my fractal/wavetrend previous methods in order to buy/sell.
However, it has been designed in order to switch automatically the pairs on which it trades to reduce the loss and risk.
#-- Synopsis --
To do so, the script uses a Daily wavetrend oscillator. The oscillator is used to find uptrend periods.
From it, the number of uptrend days are counted.
#-- Wavetrend --
For exemple, if BTC/EUR goes from downtrend to uptrend, the script will start to count since how many days the market is uptrend.
Then, if BTC/EUR goes from uptrend to downtrend, the counter will be reset to 0.
The script only trades during uptrend periods.
#-- Pairs --
Up to 35 pairs can be used at the same time. The user can enable of disable to trade on certain pairs.
Uptrend days are counted for each one of those pairs. The user can define on how many pairs the script can trade at the same time.
The select which pairs will be trade, the script sort all the enabled pairs based on their uptrend days counters.
#-- Trade organization --
For exemple if we set 5, as the number of maximum pairs to trade on.
Trades will be conducted on the 5 pairs being in uptrend for the longest time.
Therefore, to organize the money placement on each pair, the equity is used.
For 100% of equity, 10% are kept if losing trades occur.
The remaining 90% are divided by the number of maximum pairs to trade on.
If we chose 5, we will have (90/5) 18% of our capital placed in each bot.
#-- Setting it --
As explained before, this script is used for automation.
For exemple, lets say you are interested by 15 pairs with promising evolution and you set the number of maximum pairs to trade on to 5.
You will have to set alerts for the script on each of the 15 pairs.
You will receive alerts for when to buy and sell.
Note that the script has to be set for each of the selected pairs, it is not able to trade on 15 pairs (thus, webpages) if only set on one Tradingview webpage.
#-- Plot--
Once launch, you can see a plot.
The plot represent the Uptrend days counter for 20 pairs. It also project the organization of the ENABLED pairs.
If a pair is part of the one with the highest number of uprend days. It's name will be displayed under the plot in a yellow comment box.
Four other box are projected to the right of the plot:
White comment : All the pairs sorted from highest number of uptrend days to the lowest.
Red comment : Pairs with the lowest number of uptrend days.
Blue comment : Interesting pairs which will may be uptrend for a long time.
Green comment : Actual pairs with active trading (thus, the pairs with the maximum number of uptrend days)
#-- Bot automation --
If you use 3commas or other trading bot platforms, you will have to set as comments the BUY/SELL alerts. <= Which is what I am doing with it.
Doing so make you trade on multiple pairs, automatically.
However, you will need to set as input the 3commas signal.
For the moment, the script will be needed for it.
However, I will soon release a V2 taking as input the 3commas strategy comments.
For the moment, you can set the script in different webpages and follow BUY/SELL orders by eyes of alerts. ;)
#-- Parameters --
*** Parameters have been intensively optimized using 35 cryptocurrency pairsin order to have potent efficiency for each of them. I would recommend to only change the METHOD SETTINGS. For the others, I don't recommend any modifications. If you need precision on the other parameters of if you want to modify them, more informations can be found in my previous scripts and ***
Filtering method :
Used to reduce or not the risks. If you set Wavetrend, less trades will be conducted as the wavetrend filter from will be used. If you choose Fractal, no Wavetrend signals will be used.
(I prefer to use Fractal as I am using 1 or 3 minutes timeframes for the moment.)
Market Pairs : You can select on which markets the script will trade by enabling it's checkbox.
*** Also, for the moment, due to Pinescript limitation, I cannot set as input the number of active pairs. So I set 5, after optimization, as the default number of maximum pairs to trade on. Thus, you should open webpage for each ENABLED pairs and load the script in each on them. 5 Tradingview webpage will always be active. ***
#-- Timeframe --
You can use the script for Short or Long term trading:
For Short term, you will have to use 1 or 3 minutes timeframes, depending on the volatility of the market. (What I am using)
For Long term, you will have to use 5 or 15 minutes timeframes, depending on the volatility of the market.
#-- Strategy abilities and results for more than a month of activity -- *** !!! IMPORTANT SECTION !!! ***
I have simulated the profit for the 21 ACTIVE pairs I selected has been potent with my Fractal strategy. Different maximum number of trading pairs were used in order to find the best one. The script was run for the last 46 or 30 days.
Different timeframe have been used as pairs have different volatility.
*** If you use the script, SET IT UP with the following pairs and the following timeframes. ***
-------------------------------------------------------------------------------------------------------
Parameters | Maximum number of trading pairs
-------------------------------------------------------------------------------------------------------
Timeframe | Pairs | 1 2 3 5 6 10
-------------------------------------------------------------------------------------------------------
3M | SHIB | 0 0.98 3.63 2.17 2.56 2.56
1M | SOL | 0 1.5 1.08 1.26 0 0
3M | XRP | 10.5 4.56 3.29 2.19 1.52 1.52
3M | ETH | 9.94 6.97 4.55 3.45 2.19 2.19
3M | BTC | 1.7 2.32 1.74 1.88 1.33 1.33
3M | DOT | 0 3.5 2.32 2.27 1.99 1.99
1M | DOGE | 0 0 0 3.14 1.93 1.93
1M | LUNA | 0 0 0 0.23 2.35 2.35
3M | AVAX | 8.92 0 0.53 3.63 1.17 1.17
1M | HOT | 0 0 2.12 7.96 4.69 4.69
3M | GRT | 0 -1.09 -0.82 0.25 -0.191 0
1M | LINK | 0 0 0 0 0 0
1M | CHZ | 0 0 0.4 0.85 1.89 1.91
3M | WIN | 0 0 0.52 5.89 2.8 2..8
3M | ENJ | 32.63 15.65 12.55 10.31 5.62 5.62
3M | RUNE | 0 4.68 3.42 -1.18 2.3 2.3
3M | LTC | 0 -0.06 1.1 1.29 3.49 3.49
3M | BTT | 0 0 0 0.85 1.63 1.63
3M | BCH | 0 0 0 1.36 2.36 2.36
3M | WRX | 0.26 4.66 5.36 4.29 3.01 3.01
3M | ETC | -0.92 0 0 3.6 3.31 3.56
-------------------------------------------------------------------------------------------------------
Net profit % | 63.03 43.67 37.24 55.69 45.949 43.61
Number of days | 46 30 30 46 46 46
Net profit % per day | 1.38 1.46 1.25 1.22 1.00 0.95
-------------------------------------------------------------------------------------------------------
*** Therefore, we are around more than 1% per day in each case. ***
#-- Choosing pairs --
I selected the 35 cryptocurrencies which can be exchange with EUR and evaluated the ability of my Fractal script on them. The on which have been ENABLED (true) are the best.
BINANCE:SHIBEUR | true
BINANCE:SOLEUR | true
BINANCE:XRPEUR | true
BINANCE:ETHEUR | true
BINANCE:BTCEUR | true
BINANCE:DOTEUR | true
BINANCE:ENJEUR | true
BINANCE:DOGEEUR | true
BINANCE:LUNAEUR | true
BINANCE:VETEUR | false
BINANCE:BNBEUR | false
BINANCE:AVAXEUR | true
BINANCE:HOTEUR | true
BINANCE:EGLDEUR | false
BINANCE:GRTEUR | true
BINANCE:MATICEUR | false
BINANCE:LINKEUR | true
BINANCE:CHZEUR | true
BINANCE:ICPEUR | false
BINANCE:UNIEUR | false
BINANCE:WINEUR | true
BINANCE:ADAEUR | false
BINANCE:RUNEEUR | true
BINANCE:TRXEUR | false
BINANCE:THETAEUR | false
BINANCE:EOSEUR | false
BINANCE:LTCEUR | true
BINANCE:XLMEUR | false
BINANCE:BTTEUR | true
BINANCE:SXPEUR | false
BINANCE:LAZIOEUR | false
BINANCE:YFIEUR | false
BINANCE:BCHEUR | true
BINANCE:WRXEUR | true
BINANCE:ETCEUR | true

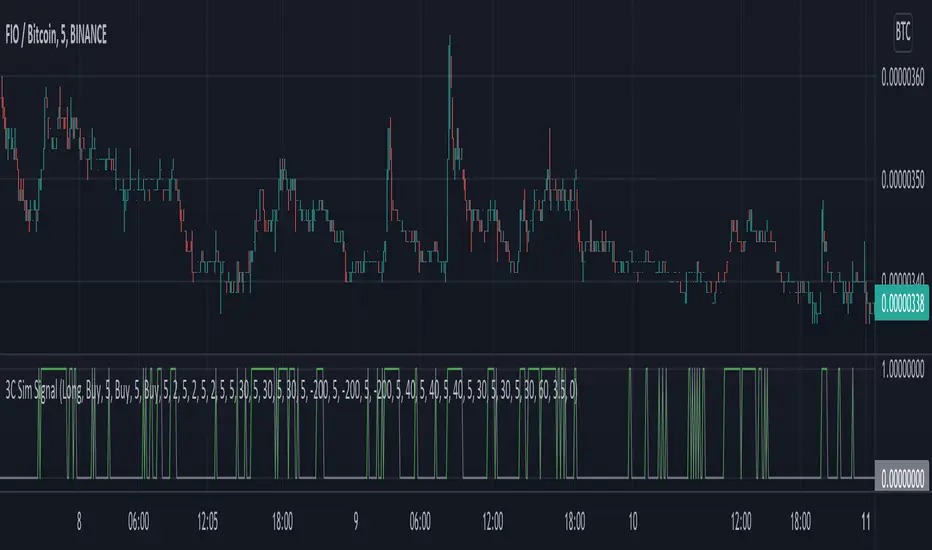
3C Sim SignalThis indicator offers the same deal start conditions available on Backtest script but now as an external signal so you can not only backtest but also set up alerts.
You can use the backtest script to backtest this indicator as an external signal and then once happy with the backtest results send directly tradingview alerts to your own bots on any exchange.
It supports most of the deal start conditions currently available for DCA bots on binance.com for example:
- TV technical ratings: buy, sell, strong buy, strong sell.
- RSI
- MFI
- CCI
- Ultimate Oscilator
- QFL
- min volume filter
Once added to the chart it will plot one when the deal start condition is true and zero when is not.
The conditions can be used in long or short strategy mode.
The biggest advantage compared to using it separately from the DSC already available in the backtest script is that because this is a separated study it will perform faster than the backtest and it resolves repainting issues. This two aspects make these indicator better suited for real time trading while still being able to connect to the backtest as an external indicator therefore still backtestable.
Now you can backtest symbols on any exchange and once your strategy is ready you then can send alerts directly to your bots.
Mid to High daily % - MA & ThresholdPurpose of this script is to provide a metric for comparing crypto volatility in terms of the % gain that can be garnished if you buy the midpoint price of the day and sell the high***. I'm specifically using bots that buy non-stop. This metric makes it easy to compare crypto coins while also providing insight on what a take profit % should be if I want to be sure it closes often instead of getting stuck in a position.
Added a few moving averages of (Mid-range to High Daily %). When these lines starts to trend down, it's time to lower the take profit % or move on to the next coin.
Decided to add a threshold so I could easily mark where I think the (Mid-range to High Daily %) is for most days.
Ex. I can mark 10% threshold and can eyeball roughly ~75% of the days in the past month or so were at or above that level. Then I know I have plenty volatility for a bot taking 5% profit. Also if you have plenty of periodic poke-through that month (let's say once a week) you might argue that you can set it to 7% if you're willing to wait about that long. Either way this metric is conservative because it is only the middle of the range to the high, a less conservative version might provide the % gain if you bought the day low and sold the day high.
***Since this calculation only takes the middle of the range and the high of the day into account, red days are volatile against a buyer but to your advantage if you are a seller. BUT if you have plenty of safety buy orders this volatility in price only means your total purchase volume increases and when/if you reach a take profit level you sell more there.
Would like to upgrade and add a separate MA line for green days and a separate MA line for red days to discern if that particular coin has a bias. Also would like to include some statistics on how many candles are above or below threshold for a certain period instead of eyeballing.

3Commas TA Start Conditions Indicator v1.0Introduction
The indicator attempts to implement the "Technical Analysis Starting Conditions" found in the 3Commas DCA trading bot settings.
How is it original and useful and how does it compare to other scripts in the Public Library?
This indicator is unique in that it's the only one (as of the initial publications) that can handle 5 signal indicator types at the same time as well as output the signal values either to the chart or the data window. The indicator supports all of the following 3Commas built-in indicators on the 3 minute, 5 minute, 15 minute, 30 minute, 1 hour, 2 hour, and 4 hour time frames:
RSI-7
ULT-7-14-2
BB-20-1-LB (Long)
BB-20-2-LB (Long)
MFI-14 crosses 40 (Long)
MFI-14 crosses 20 (Long)
CCI-40 crosses -200 (Long)
BB-20-1-UB (Short)
BB-20-2-UB (Short)
MFI-14 crosses 65 (Short)
CCI-40 crosses 0 (Short)
CCI-40 crosses 100 (Short)
What does it do and how does it do it?
When applied to the chart for the first time, the default settings are completely blank, so the only chart element you will see is the "Start Condition Result" line in orange. Once you start applying settings in the "DEAL START CONDITION" section, the indicator will redraw and display the new values for the "Start Condition Result" line. A value of 1 indicates that the results of the condition(s) is "passing". Conversely, a value of 0 indicates that the results of the condition(s) is NOT passing. If you desire to dig deeper into why the indicator is producing the results, you can enable the "Show TA Indicator # Plot" to visually see the values on the price chart or simply open the Data Window panel to see their values as you hover over the candles in the price chart.
This indicator can be used with any indicator in the Public Library that seeks to emulate the 3Commas Technical Analysis Starting Conditions for a signal provider. For example, this indicator can be used our own 3Commas DCA Bot Strategy v1.0 to aid in your backtesting analysis and build confidence that your bot will perform given historical market data that TradingView provides. When you do so, make sure that the "Strategy" input has the same values with the two indicator settings.
Enjoy! 😊👍
How to obtain access to the script?
You have two choices:
Use the "Website" link below to obtain access to this indicator, or
Send us a private message (PM) in TradingView itself.
3Commas DCA Bot Indicator v1.0Introduction
The indicator attempts to implement a majority all of the settings found on the 3Commas DCA Bot setting page that can be implemented within a TradingView indicator. Specifically, it will implement the "Open new trade ASAP" and "Trading View Custom Signal" deal start conditions. In this way, you can leverage the power of TradingView's backtester to model your settings and analysis past performance as well as leverage TradingView's alert notification subsystem to send Deal Start and Close signals to 3Commas using almost any of the thousands of scripts found in the Public Library (see "What does it do and how does it do it?" section below for more information on how to do this using the RSI indicator as an example).
How is it original and useful?
This indicator is unique in that it's the only one (as of the initial publications) that can handle 28 out of 32 bot settings (88% coverage) that are found on the 3Commas bot settings page. In addition, because it is a TradingView script, you will benefit from the following:
Model your bot's configuration using the backtester on any timeframe and evaluate its performance using the chart's history.
View a table of detailed statistics pertaining to deals started and completed, win/loss rates, daily P&L, true max drawdown, and detailed statistics on bars in deal along with safety orders filled.
View a table of "Used amount for each step" as presented in 3Commas as well.
Ability to link to almost any TradingView chart indicator that provides a single data point for buy/sell signals.
Make use of the 3Commas TA Start Conditions indicator to emulate the 3Commas built-in indicators for further performance evaluation with the backtester.
How does it compare to other scripts in the Public Library?
This indicator offers a very detailed, comprehensive settings and maybe the only one (as of the initial publication) that can handle 28 out of the 32 bot settings that are found on the 3Commas bot settings page (that can be handled within TradingView, because some cannot be modeled due to chart and language constraints). Specifically, the following 3Commas bot settings and inputs are addressed with asterisks denoting specific limitation due to TradingView's platform architecture and/or constraints:
Main settings
✅ Name
❌ Exchange* (Not handled since it is inherited from chart)
⚠ Bot type* (Only Single-pair because you simply apply the indicator to as many pairs you desire in separate charts to simulate a Multi-pair setting)
Pairs
❌ Pairs* (Not handled since it is inheriting the symbol from the chart)
Strategy
✅ Strategy
❌ Profit currency* (Not handled since there is no equivalence in TradingView)
✅ Base order size / unit
✅ Safety order size / unit
✅ Start order type
Deal start condition
⚠ TradingView* (You can modify the "Technical Rating" indicator by TradingView to output a signal yourself like @TheTradingParrot has done in the TV signal for DCA backtest script)
⚠ QFL* (See Quickfingers Luc's Base Breaking Strategy v2.5 - 3Commas Edition for an alternative)
❌ Manually/API* (Not handled since there is no equivalence in TradingView)
✅ Trading View custom signal
✅ Open new trade asap
Take profit
✅ Take profit (%)
✅ Take profit type
✅ Trailing
⚠ Trailing deviation* (modified to handle TradingView's broker emulator properly)
Stop loss
✅ Stop Loss (%)
✅ Stop Loss action
⚠ Stop Loss timeout* (modified to use "bars" as the unit of measure)
Safety orders
✅ Max safety trades count (a total of 100 safety orders are supported!)
⚠ Max active safety trades count* (Not handled since there is no equivalence in TradingView)
✅ Price deviation to open safety orders (% from initial order)
✅ Safety order volume scale
✅ Safety order step scale
Advanced settings
✅ Don't start deal(s) if the daily volume is less than
✅ Minimum price to open deal
✅ Maximum price to open deal
⚠ Deal start delay (QFL and standard TV signals only)* (modified to use "bars" as the unit of measure)
✅ Cooldown between deals
✅ Open deals & stop
Close deal after timeout
⚠ The time after which, deal will be closed automatically* (modified to use "bars" as the unit of measure)
In addition to the above inputs, the script will also support the same output data points that are found on the bot settings page, which are:
Assistant
✅ Balance
✅ Max amount for bot usage (Based on current rate)
✅ Max safety order price deviation
✅ % of available balance to be used by the bot
Table (Used amount for each step)
✅ Order No.
✅ Deviation %
✅ Order Size (Base currency)
✅ Order Volume (Quote currency)
✅ Price
✅ Average price
✅ Required price
✅ Required change
✅ Total Size (Base currency)
✅ Total Volume (Quote currency)
What does it do and how does it do it?
When applied to the chart for the first time, the default settings will work to execute the "Open new trade asap" deal start condition using a take profit of 4%, a base order size of 1.335% of equity (initial capital + net profit), a safety order size of 2.003% of equity (initial capital + net profit), a safety order volume scale of 1.5, a safety order step scale of 1.21, and a max safety trades count of 8. With these settings, as you scroll through the chart's history you should see price action crossing the DCA layers (denoted with blue triangles), and a green take-profit price line will render (with green triangle denoting the crossings). Lastly, in the upper-right corner of the chart the table of DCA statistics will render showing you all the gathered data that took place since the chart's starting history until the current time.
Using the "TV Custom Signal" section will allow you to "link" other chart indicators to supply "Start" and "Close" signals for the script. For example, here's how you can use the standard RSI indicator to generate an entry signal:
1) Add the stock RSI indicator and configure it to your desire.
2) Select the "RSI" indicator in the "Chart/Indicator Data Point" input.
3) Select "Chart/Indicator Data Point" in the "Start Deal When" input.
4) Select "Less Than" in the "Is" input.
5) Select "Custom Value(s)" in the "The Value Of" input.
6) Enter "25" in the "Custom Value 1 (Single or Lower Bound)" input.
7) Select "Trading View Custom Signal" in the "Open new trade" input (in the DEAL START CONDITION section).
8) Lastly, check the checkbox with a horizontal straight line above the "Start Deal When" input.
This means that the indicator will start a deal when the "RSI indicator" is "Less Than" the value of "25".
Strategy Results
The default settings are designed to ensure that the indicator will render chart elements when first loaded as well as to allow the backtester to gather order executions and display performance summary. The chart above is is using $10,000 initial capital, a commission rate of 0.1% for both entries and exits, and a 1 tick slippage setting. It is also using 3.22581% of the equity for the Base Order Size, 6.45161% of equity for the first Safety Order Size. The Maximum Safety Trade Count is 4 with a Safety Order Volume Scale of 2, a Safety Order Step Scale of 1.53, Price Deviation To Option Safety Orders at 5.3, and a take profit of 4.5% with Trailing turned on at a deviation of 1.5%. All other settings are defaults.
It is recommended that the indicator be "tuned" for your specific market in order to best implement the strategy and obtain better desirable results. You do so by using the backtester and statistics table and observe the output values and learn how the indicator is performing in the chart history. Using this information, you can adjust the settings accordingly until you find the settings acceptable to your trading goals and risk tolerance.
Always keep in mind that past performance may not be indicative of future results. Settings that seem favorable for one market may be found to be disastrous in another. Therefore, do take the time needed to understand how the settings will behave with the given chart symbol.
Enjoy! 😊👍
How to obtain access to the script?
You have two choices:
Use the "Website" link below to obtain access to this indicator, or
Send us a private message (PM) in TradingView itself.
