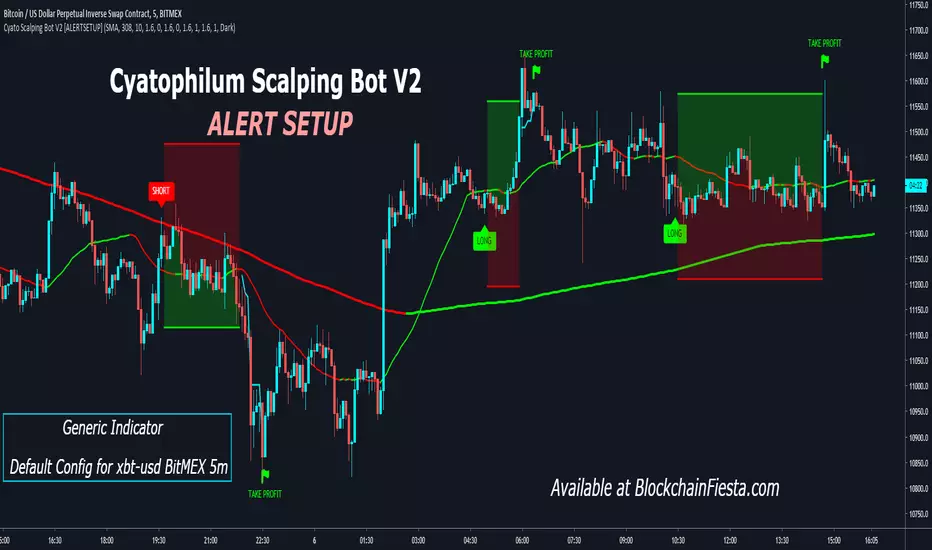
Cyatophilum Scalping Bot V2 [ALERTSETUP]Alert Setup version of Cyatophilum Scalping Bot V2.
Improved version of Cyatophilum Scalping Bot
Default settings for BITMEX:XBTUSD 5m
2% stop loss
2% trailing take profit
Release Notes: Added SMA, EMA and TEMA to the Trend Detector options.
3commas
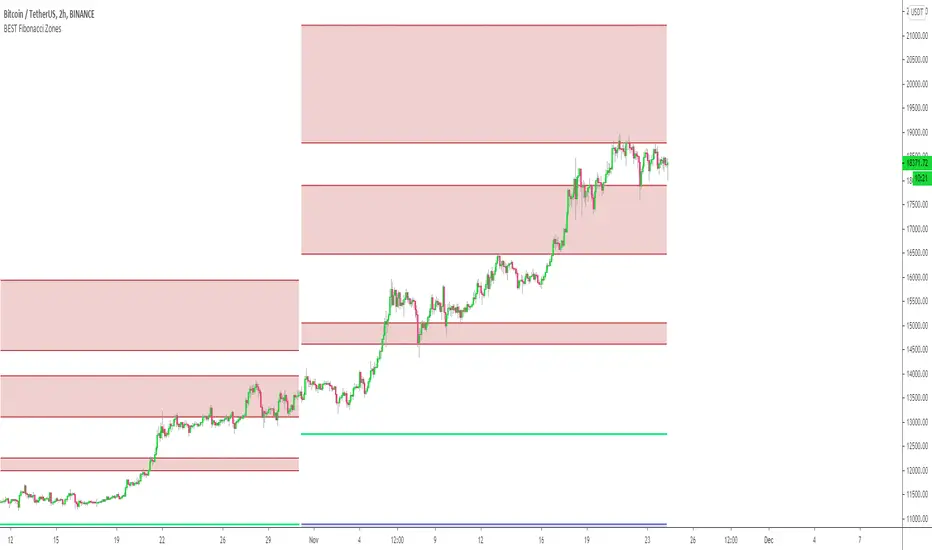
Automatic Multi-timeframes fibonacci zonesHello traders
This is a fancy indicators that will draw for you the fibonacci zones on either daily/weely/monthly timeframes
I use those zones to define my take profit levels for my intraday trading
Hope it will help
Love you all
David
Ichimoku Cloud Trend Long AlertsFantastic trading system allowing for high probability trading.
I prefer to use lesser timeframes, like in this example, for lower probability per trade but higher % profits over time. On some timeframes probability can be between 70-100%.
Settings for cryptocurrency:
Conversion: 20
Base: 60
Span B: 120
Displacement: 30
Enjoy!
TIP: I've noticed that when a new coin launches after IEO this script can work on small timeframes (15m) and with the Base and Span settings halved. This usually gives good results if ran for approx. five days from launch. Particularly with Huobi and Binance launches.

Ichimoku Trend Long StrategyFantastic trading system allowing for high probability trading.
I prefer to use lesser timeframes, like in this example, for lower probability per trade but higher % profits over time. On some timeframes probability can be between 70-100%.
Settings for cryptocurrency:
Conversion: 20
Base: 60
Span B: 120
Displacement: 30
Enjoy!
Please contact me for version with alerts for use on bots like ProfitTrailer, 3Commas, Gunbot etc.


Cryptocurrency trend following EMA Ribbon LONG only studyThis strategy is based on EMA Ribbon and uses multiple indicators to find optimal time to enter/exit the trade and filter out false signals. The script with default setting is developed mainly for trading altcoins/stable coin pair such as ADA(USDT etc on 4h timeframe but it can be applied to any pair/any timeframe with some settings adjustments.
For plot on chart features make sure that you have both study and strategy scripts on chart with same settings.
Strategy settings description:
1. Signal EMA Length - Value for exponencial moving average (slowest from EMA Ribbon)
1a. Buy price toleration (%) - Price deviation for filtering bounces of EMA - price must close defined percents above EMA to open long trade
1b. Sell price toleration (%) - Price deviation for filtering bounces of EMA - price must close defined percents bellow EMA to close long trade
1c. EMA deelay - EMA id delayed by defined bars for smoothening
2. Filter by Fast EMA - Strategy filters signals to prevent buy while coin is dropping
2a. Fast EMA Length - Value for fast exponencial moving average
3. Filter by SMA - Strategy filters signals to confirm trend change
3a. SMA Length - Value for simple moving average
4. Filter by RSI - Strategy filters signals to prevent buing/selling overbought/oversold coins
4a. RSI Length - Length of RSI identificator
4b. RSI Source candle - What price of candle is used for RSI calculation (open, close, high, low)
4c. RSI Long condition - When buy, RSI indicator must be below this value to prevent of buying already overbought coin
4d. RSI Short condition - When sell, RSI indicator must be above this value to prevent of selling already oversold coin
5. RSI Close Trade Condition - Strategy sell coin once RSI reach defined value
5a. RSI close trade condition - Sell once RSI indicator acquires defined value
6. Close trade by Take Profit or Stop Loss Condition (STRATEGY ONLY) - Strategy sell coin once defined take profit / stoploss level is reached
6a. Take Profit (%) - Take profit value in percent
6b. Stop Loss (%) - Stop loss value in percent
6c. Plot targets on chart - defined targets will be plotted as lines on chart
7. Date range from
7a From Year - To run strategy in interval
7b From Month - To run strategy in interval
7c From Day - To run strategy in interval
8. Date range to
8a To Year - To run strategy in interval
8b To Month - To run strategy in interval
8c To Day - To run strategy in interval
9. Wait to confirm the signal
9a Wait candless to buy - strategy will wait defined candless to confirm the signal before buy
9b Wait candless to sell - strategy will wait defined candless to confirm the signal before sell
10. Plotting on chart (STUDY ONLY)
10a Plot signal line channel with bows on chart
10b Plot simple moving average on chart
10c Plot EMA Ribbon on chart
10d Plot recent support and resistance levels on chart
11. Show Every signal (STUDY ONLY) - Unchecked shows only first signal based on strategy. But if you use take profit/stoploss settings within your bot, you might want to rebuy on next signal. Checked shows signal on each candle.
Throw on chart also buld-in RSI indicator and set the same as strategy
Notice that there might be false signals, especially when the coin is not trending or is strongly manipulated. Overall strategy is profitable though. You just take some minor loses and wont miss the big move.
You may also consider to compare buy&hold return vs profit from trading this strategy. In downtrend as we have seen recently, profit may not be as high as you expect but it is still much better than just hold and hope.
You can use the strategy script for fine tunning settings and find best settings for yourself.
Study script helps you to automate trading with use of alerts perharps with 3commas bot or even trade manually based on email/sms notification setted by tradingview
Notice that study script does not handle takeprofit/stoploss order. That is why sell arrows could be plotted by study script later than strategy script. To rebuy after takeprofit/stop-loss use "11. Show Every signal (STUDY ONLY)" setting
Make sure that you keep same settings for strategy and study scripts.
If you need any help with settings do not hesitate to ask. I would also appriciate any feedback and ideas how to improve this script.
Here is backtest result from 1. Nov 2018 using constant 100USD Buy ammount:
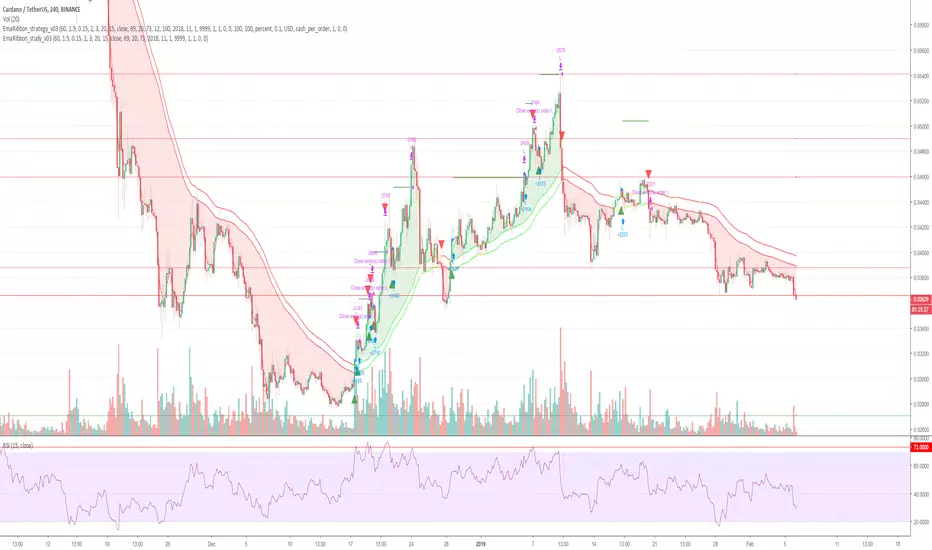
Cryptocurrency trend following EMA Ribbon LONG only strategyThis strategy is based on EMA Ribbon and uses multiple indicators to find optimal time to enter/exit the trade and filter out false signals. The script with default setting is developed mainly for trading altcoins/stable coin pair such as ADA/USDT etc on 4h timeframe but it can be applied to any pair/any timeframe with some settings adjustments.
For plot on chart features make sure that you have both study and strategy scripts on chart with same settings.
Strategy settings description:
1. Signal EMA Length - Value for exponencial moving average (slowest from EMA Ribbon)
1a. Buy price toleration (%) - Price deviation for filtering bounces of EMA - price must close defined percents above EMA to open long trade
1b. Sell price toleration (%) - Price deviation for filtering bounces of EMA - price must close defined percents bellow EMA to close long trade
1c. EMA deelay - EMA id delayed by defined bars for smoothening
2. Filter by Fast EMA - Strategy filters signals to prevent buy while coin is dropping
2a. Fast EMA Length - Value for fast exponencial moving average
3. Filter by SMA - Strategy filters signals to confirm trend change
3a. SMA Length - Value for simple moving average
4. Filter by RSI - Strategy filters signals to prevent buing/selling overbought/oversold coins
4a. RSI Length - Length of RSI identificator
4b. RSI Source candle - What price of candle is used for RSI calculation (open, close, high, low)
4c. RSI Long condition - When buy, RSI indicator must be below this value to prevent of buying already overbought coin
4d. RSI Short condition - When sell, RSI indicator must be above this value to prevent of selling already oversold coin
5. RSI Close Trade Condition - Strategy sell coin once RSI reach defined value
5a. RSI close trade condition - Sell once RSI indicator acquires defined value
6. Close trade by Take Profit or Stop Loss Condition (STRATEGY ONLY) - Strategy sell coin once defined take profit / stoploss level is reached
6a. Take Profit (%) - Take profit value in percent
6b. Stop Loss (%) - Stop loss value in percent
6c. Plot targets on chart - defined targets will be plotted as lines on chart
7. Date range from
7a From Year - To run strategy in interval
7b From Month - To run strategy in interval
7c From Day - To run strategy in interval
8. Date range to
8a To Year - To run strategy in interval
8b To Month - To run strategy in interval
8c To Day - To run strategy in interval
9. Wait to confirm the signal
9a Wait candless to buy - strategy will wait defined candless to confirm the signal before buy
9b Wait candless to sell - strategy will wait defined candless to confirm the signal before sell
10. Plotting on chart (STUDY ONLY)
10a Plot signal line channel with bows on chart
10b Plot simple moving average on chart
10c Plot EMA Ribbon on chart
10d Plot recent support and resistance levels on chart
11. Show Every signal (STUDY ONLY) - Unchecked shows only first signal based on strategy. But if you use take profit/stoploss settings within your bot, you might want to rebuy on next signal. Checked shows signal on each candle.
Throw on chart also buld-in RSI indicator and set the same as strategy
Notice that there might be false signals, especially when the coin is not trending or is strongly manipulated. Overall strategy is profitable though. You just take some minor loses and wont miss the big move.
You may also consider to compare buy&hold return vs profit from trading this strategy. In downtrend as we have seen recently, profit may not be as high as you expect but it is still much better than just hold and hope.
You can use the strategy script for fine tunning settings and find best settings for yourself.
Study script helps you to automate trading with use of alerts perharps with 3commas bot or even trade manually based on email/sms notification setted by tradingview
Notice that study script does not handle takeprofit/stoploss order. That is why sell arrows could be plotted by study script later than strategy script. To rebuy after takeprofit/stop-loss use "11. Show Every signal (STUDY ONLY)" setting
Make sure that you keep same settings for strategy and study scripts.
If you need any help with settings do not hesitate to ask. I would also appriciate any feedback and ideas how to improve this script.
Here is backtest result from 1. Nov 2018 using constant 100USD Buy ammount:

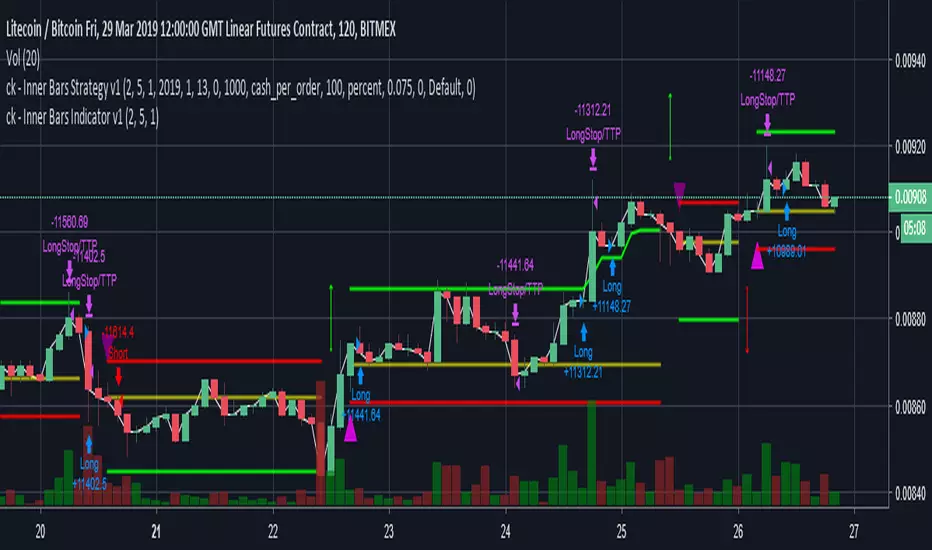
ck - Inner Bars Indicator with Alerts and Trailing Stop v1*** Please check out the matching Strategy to accompany this Indicator to allow you to fully backtest! ***
Inner Bar trading strategy is where the "inside" bar (or candle to the right) within a pair is smaller and within the high to low range of the prior bar, as this pattern tends to be somewhat predictable; especially in "chop" or sideways trading, it is useful to have in your tool box.
Features include:
Complimentary strategy you can add as well as the indicator to backtest and tune your settings before live trading
Trailing Stoploss to wring every cent from a trade
Clear Alert labels have been coded in for use with trading bots, 3commas is recommended.
Enable/Disable Shorts in addition to Longs
Visual chart shapes - Pink Triangle = Long, Purple Triangle = Short, Thin Green Arrow = Profit, Thin Red Arrow = Loss
Realtime Deal Status - Plotlines include Yellow = Entry Price, Green = Trailing Stop Profit, Red - Hard Stoploss
A further feature is that you can disable Shorts (therefore only Longing) for use with exchanges
that only allow you to Long, such as Binance & Coinbase.
Additionally, this Indicator will close a trade before opening the next, so a single exchange
account (BitMEX for example) is all that is required versus having separate accounts to long or
short on the same chart.
This strategy is intended to use $100 of capital, traded at 2.5% per order with 10x lev on Bitmex.
If you like my work, please use my referral links (you will receive discounts!)
3commas trading bots (now with Bitmex support and a lot more!) - 3commas.io
BitMEX - www.bitmex.com
If you have any comments or suggestions, please message me via TradingView.
Based on the core "Inner Bars" concept found at:
backtest-rookies.com
with original inspiration/idea from babypips.com

ck - Inner Bars Strategy v1*** Please check out the matching Indicator to accompany this Strategy to allow you to fully backtest! ***
Inner Bar trading strategy is where the "inside" bar (or candle to the right) within a pair is smaller and within the high to low range of the prior bar, as this pattern tends to be somewhat predictable; especially in "chop" or sideways trading, it is useful to have in your tool box.
Features include:
Complimentary Indicator you can add as well as this strategy to backtest and tune your settings before live trading
Trailing Stoploss to wring every cent from a trade
Indicator only: Clear Alert labels have been coded in for use with trading bots, 3commas is recommended.
Enable/Disable Shorts in addition to Longs
A further feature is that you can disable Shorts (therefore only Longing) for use with exchanges
that only allow you to Long, such as Binance & Coinbase.
Additionally, this Indicator will close a trade before opening the next, so a single exchange
account (BitMEX for example) is all that is required versus having separate accounts to long or
short on the same chart.
This strategy is intended to use $100 of capital, traded at 2.5% per order with 10x lev on Bitmex.
If you like my work, please use my referral links (you will receive discounts!)
3commas trading bots (now with Bitmex support and a lot more!) - 3commas.io
BitMEX - www.bitmex.com
If you have any comments or suggestions, please message me via TradingView.
Based on the core "Inner Bars" concept found at:
backtest-rookies.com
with original inspiration/idea from babypips.com
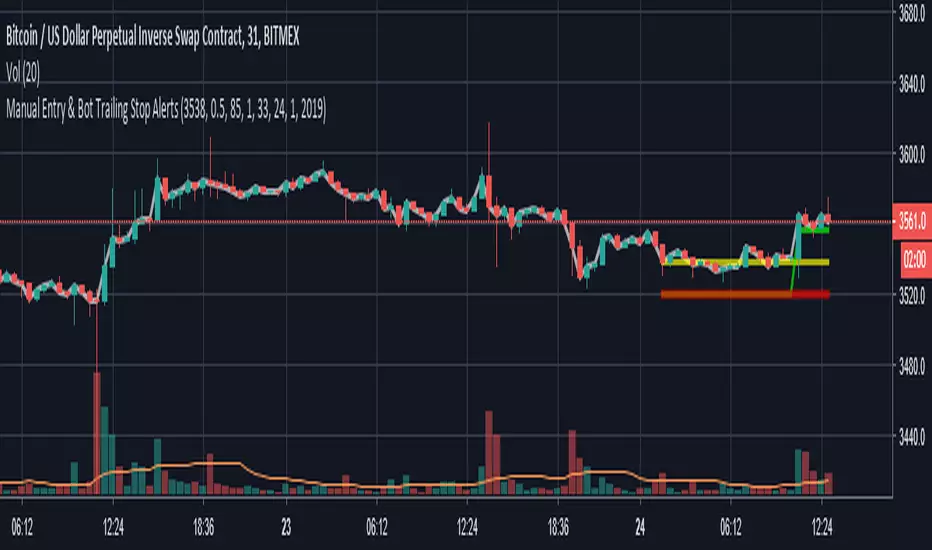
Manual Entry & Bot Trailing Stop AlertsHello all,
Another useful script & indicator with alerts enabled for trailing stoploss in your toolbox!
If you manually start a deal on a bot or even manual trade, you can set your chart time frame, enter the price and the time and date of your entry, then configure an Alert to fire using the “Close Long”/“Close Short” alert trigger.
This indicator features:
Definable Hard Stoploss by % - if price drops to hit this value, immediately trigger a close
Definable “Trail” value using Ticks (one Tick = lowest tradeable unit for your chart)
Supports Longs and Shorts!
Ideal for connecting to your 3commas BitMEX bots for EthUSD or XbtUSD
The indicator plots onto the chart various signals, Red is the Hard Stoploss value, Yellow is your Entry price, Green is the Trailing Stop and White is the live Price Tracker.
Please Note: When you add this indicator to your chart you need to click the Cog/Settings icon to configure it!
Let me know what you think!
Thanks,
Chris
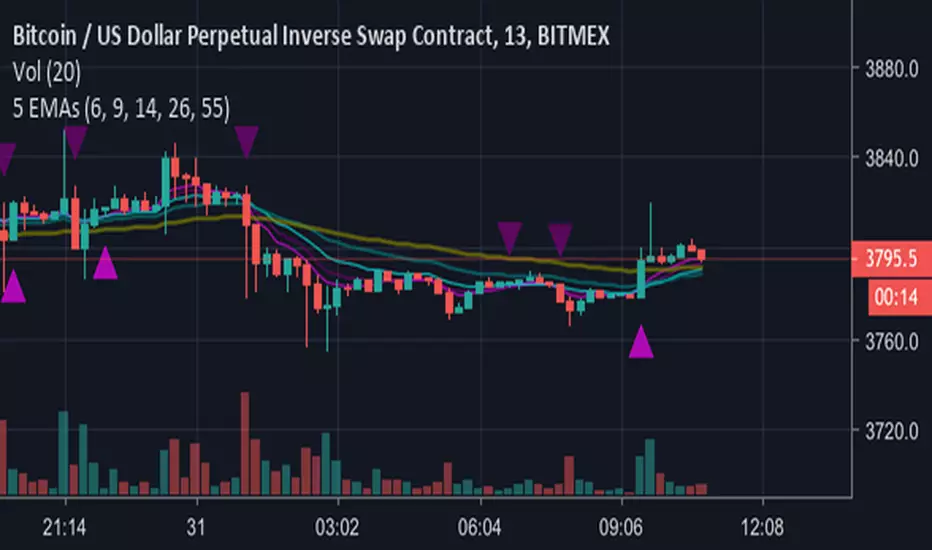
5 EMAs plus Crossing AlertsHi all,
This is a simple indicator that plots 5 EMA lines of your choice to the screen.
Can be used to trigger scalping Bots (stoploss around 0.5% recommended, take profit 1% or higher, please backtest!)
Also can be used for manual scalping, 1 or 2 candles at a time.
Features:
1) Alerts are triggered when EMAs 1 (Signal line) and 2 (Baseline) cross - a Long signal is called if the cross is above EMA 3 (Trendline), a short if the cross is below EMA3
2) Signals are represented visually as a triangle on the chart, below the candles is a long, above is a short
3) TradingView Alerts can be easily set as I have labelled the signals clearly as many other Indicators like this aren’t easy to work out if trying to create alerts to trigger a 3commas bot, for example!
Each EMA is fully customisable and if you wish to take advantage of the alerts, only a few simple rules need to be followed:
EMA1 needs to be less than EMA2.
EMA2 needs to be the same or greater than EMA3
That’s it, happy trading!
Big shout out to B and the gang over at Crypto Trading Group!
EMA Bot Trigger - 14,26,55Work In Progress - Currently will send Long/Short triggers when EMA 14 Crosses EMA 26 - whether the cross is above the EMA 55 determines whether to Long or Short.
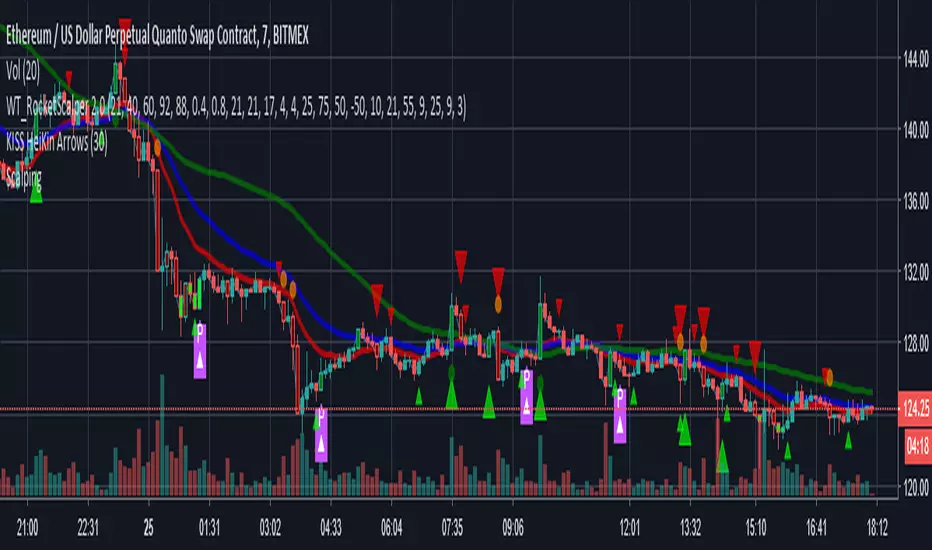
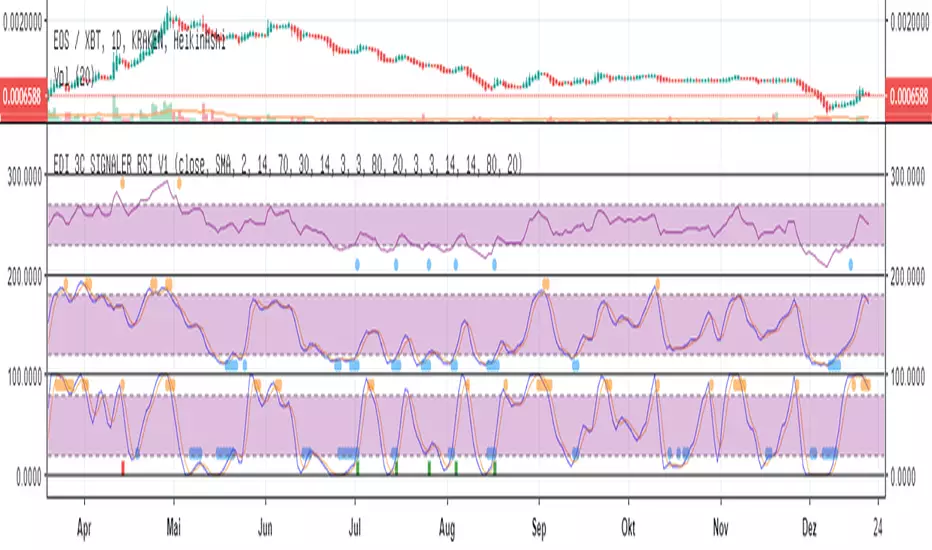
Eds Bot Signaler on Basis of RSI Stoch StochRSIEDS AWESOME BOT SIGNALER
Specially for use with e.g. 3commas or autoview
But can also be used just in normal manual (visual) mode
This Script is very early Beta. Works for visual manual use....
and also for 3Commas Bot as "Signaler" (how to connect with Bot, see the docu on 3commas).
... but can use as Signaler for any Bot who is able to get Tradingview sms-mails. (e.g. autoview)
It combines RSI, Stoch and Stoch-RSI.
You can choose normal RSI, or " returning RSI " (signals when leaving the sell/buy-zone. much higher profits with this)
You can choose how many of the indicators are needed to "fire".
You can choose if one of the indicators is a "must"
For Stoch & Stoch-RSI you can Choose sma or ema calculations of the moving average.
All the Values speak for themselves, if you are used to technical analyses (stay away in the moment, if you dont know, what rsi, stoch etc is used.
The Signals are also shown in the chart, the single ones, but also the combined which fires the Bot-Signal (shown as green and red column-candle at bottom)
Enjoy !! Free use in the moment.
More detailled Explanation in the future. Just play around!
If you wanna give something back:
BTC: 15buigKjh4JYnuVwcEWiYMpYvP3Lbp4ypL