Sentinel Nexus Dashboard [AGP] Ver.1.5Sentinel Nexus Dashboard is a versatile Pine Script designed as a comprehensive technical analysis tool. It condenses a variety of key indicators and metrics into a single, intuitive visual dashboard, providing an integrated view of market trends, momentum, volatility, and liquidity, all neatly organized on your TradingView chart.
Key Features and Benefits
All-in-One Dashboard: This script centralizes relevant information, offering a clean, efficient control panel that helps you make quick decisions without cluttering your chart with multiple overlays.
Trend Analysis with ADX: It incorporates the Average Directional Index (ADX) to measure trend strength. The dashboard displays ADX, DI+, and DI- values with dynamic color-coding to highlight trend intensity (e.g., blue for a very strong trend).
Momentum Analysis with MACD: The dashboard shows MACD line and signal line values in a table. The background color of the MACD values reflects the histogram's direction, allowing you to quickly identify crosses and shifts in market momentum.
Multi-Timeframe RSI Analysis: The RSI (Relative Strength Index) dashboard displays values across multiple timeframes (from 1 minute to 1 month). Overbought (77) and oversold (23) levels are color-coded for immediate identification of market conditions, making it an ideal tool for multi-timeframe analysis.
Smart and Dynamic Volume: The script uses a bar coloring algorithm based on average volume. Chart bars change color according to volume magnitude (extreme, high, average, or low) relative to the average, distinguishing between bullish and bearish bars. This helps you identify significant, liquidity-driven price movements.
Fair Value Analysis: The script calculates an asset's "fair value" using a noise filter (similar to a Kalman filter) on recent highs and lows to determine a midpoint. The price dashboard's background color changes to indicate if the current price is above or below this fair value.
Fibonacci EMA Analysis: A table displays several Exponential Moving Averages (EMAs) based on the Fibonacci sequence. The values are color-coded to show whether the current price is above (white) or below (orange) each EMA, helping you quickly identify dynamic support and resistance levels.
CME Futures Data Integration: For Bitcoin, the script can show a chart label with the Bitcoin futures price (CME:BTC1!), allowing you to compare the spot price with the CME futures market.
Potential Uses and Applications
The Sentinel Nexus Dashboard is an excellent support tool for trading. It is not a signal system but rather a suite of confirmation tools that can be used to:
Confirm Trend Strength: Before entering a trade, use the ADX data to ensure the trend has enough strength for your expected move.
Detect Reversal Points: Multi-timeframe RSI data can alert you to potential overbought or oversold conditions, indicating possible exhaustion of a price move.
Validate Price Movements: Bar coloring based on volume helps you determine if a price move is genuine and supported by strong market participation. High volume can confirm a breakout or reversal.
Identify Support and Resistance: The Fibonacci EMAs allow you to quickly visualize key levels where price might find support or resistance, aiding in planning entries and exits.
In short, this script is perfect for traders who want a comprehensive market overview without chart clutter. It efficiently integrates trend, momentum, and volume analysis in one place.
Legal Disclaimer
RISK WARNING:
This Pine Script is a technical analysis tool and should not be considered financial advice. Past performance of any indicator is no guarantee of future results. Trading in financial markets involves a high risk of loss and is not suitable for all investors. By using this indicator, you accept full responsibility for your trading decisions and acknowledge that any financial loss is your sole responsibility.
IMPORTANT:
Some script functions, such as the CME price label, may not work correctly if your TradingView subscription plan is not a paid one. Please check your plan's limitations to ensure the indicator's optimal functionality.
ADX

ADX Tide ZonesADX Tide Zones – Adaptive Momentum & Trend Strength Framework
Overview
ADX Tide Zones – Professional is a dynamic trend-strength visualizer designed for traders who want to interpret momentum with precision and context. By combining the Average Directional Index (ADX) with adaptive threshold logic, the indicator segments price action into distinct “tide zones” that reflect varying levels of market strength: Calm, Rising, Strong, and Falling Tides. These zones transform raw ADX readings into an interpretable framework that highlights when markets are consolidating, building momentum, trending strongly, or losing strength.
Unlike standard ADX readings, which can be difficult to interpret in real time, ADX Tide Zones translate momentum shifts into a continuous, color-coded system that traders can instantly read. Whether applied to scalping, intraday, or swing trading, the indicator offers a consistent methodology for identifying actionable opportunities across assets and timeframes.
How It Works
The foundation of ADX Tide Zones lies in momentum analysis via the ADX. By measuring the strength (not direction) of a trend, ADX provides an objective read on when markets are gaining or losing energy. ADX Tide Zones enhances this by applying threshold logic to classify ADX values into four distinct states:
Calm Tide : Low ADX values indicate sideways or consolidating conditions.
Rising Tide : ADX increases past a threshold, signaling momentum building.
Strong Tide : ADX remains elevated, confirming robust and sustained trend strength.
Falling Tide : ADX declines after strength, hinting at exhaustion or early reversal setups.
These states are displayed on the chart through adaptive visualizations (zones, bar colors, or overlays), offering real-time clarity on when to expect expansion, continuation, or contraction in price action.
Interpretation
Trend Analysis : By mapping transitions between tides, traders can instantly gauge whether markets are in accumulation, expansion, or exhaustion phases. Rising/Strong Tides reinforce trend continuation, while Falling Tides highlight weakening conditions.
Volatility & Risk Assessment : Shifts between Calm → Rising Tide often precede volatility expansions. Falling Tides can signal a period of compression or corrective moves, warning traders to manage risk proactively.
Market Context : The indicator does not dictate direction; instead, it overlays strength on top of price action, allowing traders to combine it with directional tools such as moving averages, order blocks, or liquidity zones for confirmation.
Strategy Integration
ADX Tide Zones adapts seamlessly to a wide range of trading strategies by translating momentum dynamics into actionable frameworks:
Trend Following : Traders can align with dominant flows by entering positions when the indicator confirms a Rising Tide or Strong Tide. These conditions signal persistent directional strength, making them ideal for continuation setups. Combining directional bias with ADX confirmation reduces the risk of trading against prevailing momentum.
Breakout Trading : When the market transitions from Calm Tide into a Rising Tide, it often precedes a volatility expansion. This shift highlights breakout conditions where accumulation gives way to impulsive price movement. Traders can use this transition as a timing tool to catch early entries into new momentum phases.
Exhaustion Reversals : Strong Tide phases don’t last forever—when they begin to fade into Falling Tide, it can mark trend fatigue or liquidity exhaustion. This offers contrarian traders an early edge in spotting overextended moves and positioning for corrective pullbacks or full reversals.
Multi-Timeframe Analysis : By overlaying higher timeframe tide zones on intraday or scalping charts, traders can filter noise and trade in alignment with larger flows. For example, combining a daily Rising Tide bias with a 15-minute breakout confirmation can significantly improve entry precision while reducing exposure to false signals.
Advanced Techniques
For traders seeking an extra edge, ADX Tide Zones can be pushed further with advanced methods:
Volume & Liquidity Confirmation : Pair the tide transitions with volume spikes, order flow, or liquidity sweep tools. When directional strength confirmed by the ADX coincides with institutional activity, it validates setups and increases probability of follow-through.
Cross-Asset Synchronization : Momentum rarely exists in isolation. Monitoring tide shifts across correlated instruments (e.g., majors vs. USD, or indices vs. risk assets) can uncover synchronized volatility events. These correlations help traders identify whether a move is isolated noise or part of a broader systemic trend.
Threshold Optimization : The sensitivity of ADX Tide Zones can be fine-tuned for different trading objectives. Lower thresholds heighten responsiveness, capturing micro-moves suitable for scalpers. Higher thresholds filter minor fluctuations, isolating major structural swings that align with swing or position trading.
Contextual Trade Management : Instead of using static stops or targets, traders can adapt risk management dynamically by tracking tide progression. For example, a trade initiated during Rising Tide may remain valid as long as conditions sustain, but partial profits or tighter stops can be applied once the zone shifts to Calm Tide.
Inputs & Customization
ADX Length : Define the lookback period for ADX calculation.
Threshold Levels : Adjust sensitivity for Calm, Rising, Strong, and Falling Tides.
Zone Visualization : Choose between bar coloring, background shading, or overlays.
Color Customization : Configure bullish, bearish, neutral, and tide-specific colors.
Multi-Timeframe Options : Enable tide readings from higher timeframes for confirmation.
Why Use ADX Tide Zones
ADX Tide Zones turns the complexity of momentum analysis into a visual system that highlights when markets are gearing up for moves, trending with conviction, or running out of steam. By combining adaptive ADX interpretation with customizable thresholds, traders can:
Anticipate breakouts before volatility expands.
Confirm the strength behind price trends.
Spot exhaustion phases early to secure profits or prepare for reversals.
Adapt strategies seamlessly between scalping, intraday, and swing trading.
With its balance of simplicity and depth, ADX Tide Zones provides a structured lens for reading market momentum, equipping traders with the clarity needed to execute with discipline and confidence.

T-Virus Sentiment [hapharmonic]🧬 T-Virus Sentiment: Visualize the Market's DNA
Remember the iconic T-Virus vial from the first Resident Evil? That powerful, swirling helix of potential has always fascinated me. It sparked an idea: what if we could visualize the market's underlying health in a similar way? What if we could capture the "genetic code" of market sentiment and contain it within a dynamic, 3D indicator? This project is the result of that idea, brought to life with Pine Script.
The indicator's main goal is to measure the strength and direction of market sentiment by analyzing the "genetic code" of price action through a variety of trusted indicators. The result is displayed as a liquid level within a DNA helix, a bubble density representing buying pressure, and a T-Virus mascot that reflects the overall mood.
🧐 Core Concept: How It Works
The primary output of the indicator is the "Active %" gauge you see on the right side of the vial. This percentage represents the overall sentiment score, calculated as an average from 7 different technical analysis tools. Each tool is analyzed on every bar and assigned a score from 1 (strong bearish pressure) to 5 (strong bullish potential).
In this indicator, we re-imagine market dynamics through the lens of a viral outbreak. A strong bear market is like a virus taking hold, pulling all technical signals down into a state of weakness. Conversely, a powerful bull market is like an antiviral serum ; positive signals rise and spread toward the top of the vial, indicating that the system is being injected with strength.
This is not just another line on a chart. It's a comprehensive sentiment dashboard designed to give an immediate, at-a-glance understanding of the confluence between 7 classic technical indicators. The incredible 3D model of the vial itself was inspired by a design concept found here .
⚛️ The 4 Core Elements of T-Virus Sentiment
These four elements work in harmony to give a complete, multi-faceted picture of market sentiment. Each component tells a different part of the story.
The Virus Mascot: An instant emotional cue. This character provides the quickest possible read on the overall market mood, combining sentiment with volume pressure.
The Antiviral Serum Level: The main quantitative output. This is the liquid level in the DNA helix and the percentage gauge on the right, representing the average sentiment score from all 7 indicators.
Buy Pressure & Bubble Density: This visualizes volume flow. The density of bubbles represents the intensity of accumulation (buying) versus distribution (selling). It's the "power" behind the move.
The Signal Distribution: This shows the confluence (or dispersion) of sentiment. Are all signals bullish and clustered at the top, or are they scattered, indicating a conflicted market? The position of the indicator labels is crucial, as each is assigned to one of five distinct zones:
Base Bottom: The market is at its weakest. Signals here suggest strong bearish control and distribution.
Lower Zone: The market is still bearish, but signals may be showing early signs of accumulation or bottoming.
Neutral Core (Center): A state of balance or sideways consolidation. The market is waiting for a new direction.
Upper Zone: Bullish momentum is becoming clear. Signals are strengthening and showing bullish control.
Top Cap: The market is "heating up" with strong bullish sentiment, potentially nearing overbought conditions.
🐂🐻 The Virus Mascot: The At-a-Glance Indicator
This character acts as a shortcut to confirm market health. It combines the sentiment score with volume, preventing false confidence in a low-volume rally.
Its state is determined by a dual-check: the overall "Antiviral Serum Level" and the "Buy Pressure" must both be above 50%.
Green & Smiling: The 'all clear' signal. This means that not only is the overall technical sentiment bullish, but it's also being supported by real buying pressure. This is a sign of a healthy bull market.
Red & Angry: A warning sign. This appears if either the sentiment is weak, or a bullish sentiment is not being confirmed by buying volume. The latter could indicate a potential "bull trap" or an exhaustive move.
This mascot can be disabled from the settings page under "Virus Mascot Styling" if a cleaner look is preferred.
🫧 Bubble Density: Gauging Buy vs. Sell Pressure
The bubbles visualize the battle between buyers and sellers. There are two modes to control how this is calculated:
Mode 1: Visible Range (The 'Big Picture' View)
This default mode is best for getting a broad, contextual understanding of the current session. It dynamically analyzes the volume of every single candlestick currently visible on the screen to calculate the buy/sell pressure ratio. It answers the question: "Over the entire period I'm looking at, who is in control?" As you zoom in or out, the calculation adapts.
Mode 2: Custom Lookback (The 'Precision' View)
This mode is for traders who need to analyze short-term pressure. You can define a fixed number of recent bars to analyze, which is perfect for scalping or understanding the volume dynamics leading into a key level. It answers the question: "What is happening right now ?" In the example above, a lookback of 2 focuses only on the most recent action, clearly showing intense, immediate selling pressure (few bubbles) and a corresponding drop in the sentiment score to 29%.
ℹ️ Interactive Tooltips: Dive Deeper
We believe in transparency, not 'black box' indicators. This feature transforms the indicator from a visual aid into an active learning tool.
Simply hover the mouse over any indicator label (like EMA, OBV, etc.) to get a detailed tooltip. It will explain the specific data points and thresholds that signal met to be placed in its current zone. This helps build trust in the signals and allows users to fine-tune the indicator settings to better match their own trading style.
🎯 The Scoring Logic Breakdown
The "Antiviral Serum Level" gauge is the average score from 7 technical analysis tools. Each is graded on a 5-point scale (1=Strong Bearish to 5=Strong Bullish). Here’s a detailed, transparent look at how each "gene" is evaluated:
Relative Strength Index (RSI)
Measures momentum and overbought/oversold conditions.
Group 1 (Strong Bearish): RSI > 80 (Extreme Overbought)
Group 2 (Bearish): 70 < RSI ≤ 80 (Overbought)
Group 3 (Neutral): 30 ≤ RSI ≤ 70
Group 4 (Bullish): 20 ≤ RSI < 30 (Oversold)
Group 5 (Strong Bullish): RSI < 20 (Extreme Oversold)
Exponential Moving Averages (EMA)
Evaluates the trend's strength and structure based on the alignment of multiple EMAs (9, 21, 50, 100, 200, 250).
Group 1 (Strong Bearish): A perfect bearish sequence (9 < 21 < 50 < ...)
Group 2 (Bearish Transition): Early signs of a potential reversal (e.g., 9 > 21 but still below 50)
Group 3 (Neutral / Mixed): MAs are intertwined or showing a partial bullish sequence.
Group 4 (Bullish): A strong bullish sequence is forming (e.g., 9 > 21 > 50 > 100)
Group 5 (Strong Bullish): A perfect bullish sequence (9 > 21 > 50 > 100 > 200 > 250)
Moving Average Convergence Divergence (MACD)
Analyzes the relationship between two moving averages to gauge momentum.
Group 1 (Strong Bearish): MACD & Histogram are negative and momentum is falling.
Group 2 (Weakening Bearish): MACD is negative but the histogram is rising or positive.
Group 3 (Neutral / Crossover): A crossover event is occurring near the zero line.
Group 4 (Bullish): MACD & Histogram are positive.
Group 5 (Strong Bullish): MACD & Histogram are positive, rising strongly, and accelerating.
Average Directional Index (ADX)
Measures trend strength, not direction. The score is based on both ADX value and the dominance of DI+ vs DI-.
Group 1 (Bearish / No Trend): ADX < 20 and DI- is dominant.
Group 2 (Developing Bearish Trend): 20 ≤ ADX < 25 and DI- is dominant.
Group 3 (Neutral / Indecision): Trend is weak or DI+ and DI- are nearly equal.
Group 4 (Developing Bullish Trend): 25 ≤ ADX ≤ 40 and DI+ is dominant.
Group 5 (Strong Bullish Trend): ADX > 40 and DI+ is dominant.
Ichimoku Cloud (IKH)
A comprehensive indicator that defines support/resistance, momentum, and trend direction.
Group 1 (Strong Bearish): Price is below the Kumo, Tenkan < Kijun, and Chikou is below price.
Group 2 (Bearish): Price is inside or below the Kumo, with mixed secondary signals.
Group 3 (Neutral / Ranging): Price is inside the Kumo, often with a Tenkan/Kijun cross.
Group 4 (Bullish): Price is above the Kumo with strong primary signals.
Group 5 (Strong Bullish): All signals are aligned bullishly: price above Kumo, bullish Tenkan/Kijun cross, bullish future Kumo, and Chikou above price.
Bollinger Bands (BB)
Measures volatility and relative price levels.
Group 1 (Strong Bearish): Price is below the lower band.
Group 2 (Bearish Territory): Price is between the lower band and the basis line.
Group 3 (Neutral): Price is hovering around the basis line.
Group 4 (Bullish Territory): Price is between the basis line and the upper band.
Group 5 (Strong Bullish): Price is above the upper band.
On-Balance Volume (OBV)
Uses volume flow to predict price changes. The score is based on OBV's trend and its position relative to its moving average.
Group 1 (Strong Bearish): OBV is below its MA and falling.
Group 2 (Weakening Bearish): OBV is below its MA but showing signs of rising.
Group 3 (Neutral): OBV is very close to its MA.
Group 4 (Bullish): OBV is above its MA and rising.
Group 5 (Strong Bullish): OBV is above its MA, rising strongly, and showing signs of a volume spike.
🧭 How to Use the T-Virus Sentiment Indicator
IMPORTANT: This indicator is a sentiment dashboard , not a direct buy/sell signal generator. Its strength lies in showing confluence and providing a quick, holistic view of the market's technical health.
Confirmation Tool: Use the "Active %" gauge to confirm a trade setup from your primary strategy. For example, if you see a bullish chart pattern, a high and rising sentiment score can add confidence to your trade.
Momentum & Trend Gauge: A consistently high score (e.g., > 75%) suggests strong, established bullish momentum. A consistently low score (< 25%) suggests strong bearish control. A score hovering around 50% often indicates a ranging or indecisive market.
Divergence & Warning System: Pay attention to divergences. If the price is making new highs but the sentiment score is failing to follow or is actively decreasing, it could be an early warning sign that the underlying momentum is weakening.
⚙️ Settings & Customization
The indicator is highly customizable to fit any trading style.
Position & Anchor: Control where the vial appears on the chart.
Styling (Vial, Helix, etc.): Nearly every visual element can be color-customized.
Signals: This is where the real power is. All underlying indicator parameters (RSI length, MACD settings, etc.) can be fine-tuned to match a personal strategy. The text labels can also be disabled if the chart feels cluttered.
Enjoy visualizing the market's DNA with the T-Virus Sentiment indicator

Market Regime Matrix [Alpha Extract]A sophisticated market regime classification system that combines multiple technical analysis components into an intelligent scoring framework to identify and track dominant market conditions. Utilizing advanced ADX-based trend detection, EMA directional analysis, volatility assessment, and crash protection protocols, the Market Regime Matrix delivers institutional-grade regime classification with BULL, BEAR, and CHOP states. The system features intelligent scoring with smoothing algorithms, duration filters for stability, and structure-based conviction adjustments to provide traders with clear, actionable market context.
🔶 Multi-Component Regime Engine Integrates five core analytical components: ADX trend strength detection, EMA-200 directional bias, ROC momentum analysis, Bollinger Band volatility measurement, and zig-zag structure verification. Each component contributes to a sophisticated scoring system that evaluates market conditions across multiple dimensions, ensuring comprehensive regime assessment with institutional precision.
// Gate Keeper: ADX determines market type
is_trending = adx_value > adx_trend_threshold
is_ranging = adx_value <= adx_trend_threshold
is_maximum_chop = adx_value <= adx_chop_threshold
// BULL CONDITIONS with Structure Veto
if price_above_ema and di_bullish
if use_structure_filter and isBullStructure
raw_bullScore := 5.0 // MAXIMUM CONVICTION: Strong signals + Bull structure
else if use_structure_filter and not isBullStructure
raw_bullScore := 3.0 // REDUCED: Strong signals but broken structure
🔶 Intelligent Scoring System Employs a dynamic 0-5 scale scoring mechanism for each regime type (BULL/BEAR/CHOP) with adaptive conviction levels. The system automatically adjusts scores based on signal alignment, market structure confirmation, and volatility conditions. Features decision margin requirements to prevent false regime changes and includes maximum conviction thresholds for high-probability setups.
🔶 Advanced Structure Filter Implements zig-zag based market structure analysis using configurable deviation thresholds to identify significant pivot points. The system tracks Higher Highs/Higher Lows (HH/HL) for bullish structure and Lower Lows/Lower Highs (LL/LH) for bearish structure, applying structure veto logic that reduces conviction when price action contradicts the underlying trend framework.
// Define Market Structure (Bull = HH/HL, Bear = LL/LH)
isBullStructure = not na(last_significant_high) and not na(prev_significant_high) and
not na(last_significant_low) and not na(prev_significant_low) and
last_significant_high > prev_significant_high and last_significant_low > prev_significant_low
isBearStructure = not na(last_significant_high) and not na(prev_significant_high) and
not na(last_significant_low) and not na(prev_significant_low) and
last_significant_low < prev_significant_low and last_significant_high < prev_significant_high
🔶 Superior Engine Components Features dual-layer regime stabilization through score smoothing and duration filtering. The score smoothing component reduces noise by averaging raw scores over configurable periods, while the duration filter requires minimum regime persistence before confirming changes. This eliminates whipsaws and ensures regime transitions represent genuine market shifts rather than temporary fluctuations.
🔶 Crash Detection & Active Penalties Incorporates sophisticated crash detection using Rate of Change (ROC) analysis with severity classification. When crash conditions are detected, the system applies active penalties (-5.0) to BULL and CHOP scores while boosting BEAR conviction based on crash severity. This ensures immediate regime response to major market dislocations and drawdown events.
// === CRASH OVERRIDE (Active Penalties) ===
is_crash = roc_value < crash_threshold
if is_crash
// Calculate crash severity
crash_severity = math.abs(roc_value / crash_threshold)
crash_bonus = 4.0 + (crash_severity - 1.0) * 2.0
// ACTIVE PENALTIES: Force bear dominance
raw_bearScore := math.max(raw_bearScore, crash_bonus)
raw_bullScore := -5.0 // ACTIVE PENALTY
raw_chopScore := -5.0 // ACTIVE PENALTY
❓How It Works
🔶 ADX-Based Market Classification The Market Regime Matrix uses ADX (Average Directional Index) as the primary gatekeeper to distinguish between trending and ranging market conditions. When ADX exceeds the trend threshold, the system activates BULL/BEAR regime logic using DI+/DI- crossovers and EMA positioning. When ADX falls below the ranging threshold, CHOP regime logic takes precedence, with maximum conviction assigned during ultra-low ADX periods.
🔶 Dynamic Conviction Scaling Each regime receives conviction ratings from UNCERTAIN to MAXIMUM based on signal alignment and score magnitude. MAXIMUM conviction (5.0 score) requires perfect signal alignment plus favorable market structure. The system progressively reduces conviction when signals conflict or structure breaks, ensuring traders understand the reliability of each regime classification.
🔶 Regime Transition Management Implements decision margin requirements where new regimes must exceed existing regimes by configurable thresholds before transitions occur. Combined with duration filtering, this prevents premature regime changes and maintains stability during consolidation periods. The system tracks both raw regime signals and final regime output for complete transparency.
🔶 Visual Regime Mapping Provides comprehensive visual feedback through colored candle overlays, background regime highlighting, and real-time information tables. The system displays regime history, conviction levels, structure status, and key metrics in an organized dashboard format. Regime changes trigger immediate visual alerts with detailed transition information.
🔶 Performance Optimization Features efficient array management for zig-zag calculations, smart variable updating to prevent recomputation, and configurable debug modes for strategy development. The system maintains optimal performance across all timeframes while providing institutional-grade analytical depth.
Why Choose Market Regime Matrix ?
The Market Regime Matrix represents the evolution of market regime analysis, combining traditional technical indicators with modern algorithmic decision-making frameworks. By integrating multiple analytical dimensions with intelligent scoring, structure verification, and crash protection, it provides traders with institutional-quality market context that adapts to changing conditions. The sophisticated filtering system eliminates noise while preserving responsiveness, making it an essential tool for traders seeking to align their strategies with dominant market regimes and avoid adverse market environments.

ZenAlgo - ADXThis open-source indicator builds upon the official Average Directional Index (ADX) implementation by TradingView. It preserves the core logic of the original ADX while introducing additional visualization features, configurability, and analytical overlays to assist with directional strength analysis.
Core Calculation
The script computes the ADX, +DI, and -DI based on smoothed directional movement and true range over a user-defined length. The smoothing is performed using Wilder’s method, as in the original implementation.
True Range is calculated from the current high, low, and previous close.
Directional Movement components (+DM, -DM) are derived by comparing the change in highs and lows between consecutive bars.
These values are then smoothed, and the +DI and -DI are expressed as percentages of the smoothed True Range.
The difference between +DI and -DI is normalized to derive DX, which is further smoothed to yield the ADX value.
The indicator includes a selectable signal line (SMA or EMA) applied to the ADX for crossover-based visualization.
Visualization Enhancements
Several plots and conditions have been added to improve interpretability:
Color-coded histograms and lines visualize DI relative to a configurable threshold (default: 25). Colors follow the ZenAlgo color scheme.
Dynamic opacity and gradient coloring are used for both ADX and DI components, allowing users to distinguish weak/moderate/strong directional trends visually.
Mirrored ADX is internally calculated for certain overlays but not directly plotted.
The script also provides small circles and diamonds to highlight:
Crossovers between ADX and its signal line.
DI crossing above or below the 25 threshold.
Rising ADX confirmed by rising DI values, with point size reflecting ADX strength.
Divergence Detection
The indicator includes optional detection of fractal-based divergences on the DI curve:
Regular and hidden bullish and bearish divergences are identified based on relative fractal highs/lows in both price and DI.
Detected divergences are optionally labeled with 'R' (Regular) or 'H' (Hidden), and color-coded accordingly.
Fractal points are defined using 5-bar patterns to ensure consistency and reduce false positives.
ADX/DI Table
When enabled, a floating table displays live values and summaries:
ADX value , trend direction (rising/falling), and qualitative strength.
DI composite , trend direction, and relative strength.
Contextual power dynamics , describing whether bulls or bears are gaining or losing strength.
The background colors of the table reflect current trend strength and direction.
Interpretation Guidelines
ADX indicates the strength of a trend, regardless of its direction. Values below 20 are often considered weak, while those above 40 suggest strong trending conditions.
+DI and -DI represent bullish and bearish directional movements, respectively. Crossovers between them are used to infer trend direction.
When ADX is rising and either +DI or -DI is dominant and increasing, the trend is likely strengthening.
Divergences between DI and price may suggest potential reversals but should be interpreted cautiously and not in isolation.
The threshold line (default 25) provides a basic filter for ignoring low-strength conditions. This can be adjusted depending on the market or timeframe.
Added Value over Existing Indicators
Fully color-graded ADX and DI display for better visual clarity.
Optional signal MA over ADX with crossover markers.
Rich contextual labeling for both divergence and threshold events.
Power dynamics commentary and live table help users contextualize current momentum.
Customizable options for smoothing type, divergence display, table position, and visual offsets.
These additions aim to improve situational awareness without altering the fundamental meaning of ADX/DI values.
Limitations and Disclaimers
As with any ADX-based tool, this indicator does not indicate market direction alone —it measures strength, not trend bias.
Divergence detection relies on fractal patterns and may lag or produce false positives in sideways markets.
Signal MA crossovers and DI threshold breaks are not entry signals , but contextual markers that may assist with timing or filtering other systems.
The table text and labels are for visual assistance and do not replace proper technical analysis or market context.

Advanced Trend Panel v3.1This is a comprehensive dashboard indicator designed to give traders a multi-faceted view of the market at a single glance. It combines key indicators across multiple timeframes, calculates trend duration, and presents all information in a clean, color-coded table. This tool is perfect for confirming trade ideas, identifying trend alignment, and understanding the underlying market dynamics.
#### Key Features:
* **All-in-One Dashboard:** A convenient on-chart table summarizes the state of multiple key indicators, saving you screen space and time.
* **Multi-Timeframe (MTF) Forecast:** Analyzes the long-term trend on a higher timeframe (e.g., Daily) to provide context for the current chart's trend.
* **Trend Analysis:** Uses dual sets of EMAs (long-term and short-term) to define the primary and immediate trend directions.
* **Trend Duration:** A unique feature that calculates how long the current short-term and long-term trends have been active, helping you gauge trend maturity.
* **Core Indicators Included:**
* **ADX:** Measures trend strength to differentiate between strong trends and weak or sideways markets.
* **RSI:** Identifies overbought and oversold conditions.
* **Point of Control (POC):** Shows the price level with the highest traded volume over a lookback period, acting as a key level of support/resistance.
* **Volume:** Compares current volume to its moving average to spot unusual activity.
* **Customizable Alerts:** Set up alerts for trend changes (long-term or short-term), RSI crossing into overbought/oversold zones, or shifts in ADX trend strength.
#### How to Use:
1. Apply the indicator to your chart.
2. In the settings, configure the timeframes, indicator lengths, and display options to match your trading style.
3. Use the table to quickly assess if the long-term trend, short-term trend, and momentum are aligned.
4. Enable alerts to be notified of key changes in market conditions without having to watch the chart constantly.
**Disclaimer:** This script is for educational purposes only and should not be considered financial advice. All trading involves risk. Past performance is not indicative of future results. Please backtest and use this tool as part of a comprehensive trading plan with proper risk management.
Feedback is always welcome! If you find this indicator useful, please leave a like.

PRO Investing - Apex EnginePRO Investing - Apex Engine
1. Core Concept: Why Does This Indicator Exist?
Traditional momentum oscillators like RSI or Stochastic use a fixed "lookback period" (e.g., 14). This creates a fundamental problem: a 14-period setting that works well in a fast, trending market will generate constant false signals in a slow, choppy market, and vice-versa. The market's character is dynamic, but most tools are static.
The Apex Engine was built to solve this problem. Its primary innovation is a self-optimizing core that continuously adapts to changing market conditions. Instead of relying on one fixed setting, it actively tests three different momentum profiles (Fast, Mid, and Slow) in real-time and selects the one that is most synchronized with the current price action.
This is not just a random combination of indicators; it's a deliberate synthesis designed to create a more robust momentum tool. It combines:
Volatility analysis (ATR) to generate adaptive lookback periods.
Momentum measurement (ROC) to gauge the speed of price changes.
Statistical analysis (Correlation) to validate which momentum measurement is most effective right now.
Classic trend filters (Moving Average, ADX) to ensure signals are only taken in favorable market conditions.
The result is an oscillator that aims to be more responsive in volatile trends and more stable in quiet periods, providing a more intelligent and adaptive signal.
2. How It Works: The Engine's Three-Stage Process
To be transparent, it's important to understand the step-by-step logic the indicator follows on every bar. It's a process of Adapt -> Validate -> Signal.
Stage 1: Adapt (Dynamic Length Calculation)
The engine first measures market volatility using the Average True Range (ATR) relative to its own long-term average. This creates a volatility_factor. In high-volatility environments, this factor causes the base calculation lengths to shorten. In low-volatility, they lengthen. This produces three potential Rate of Change (ROC) lengths: dynamic_fast_len, dynamic_mid_len, and dynamic_slow_len.
Stage 2: Validate (Self-Optimizing Mode Selection)
This is the core of the engine. It calculates the ROC for all three dynamic lengths. To determine which is best, it uses the ta.correlation() function to measure how well each ROC's movement has correlated with the actual bar-to-bar price changes over the "Optimization Lookback" period. The ROC length with the highest correlation score is chosen as the most effective profile for the current moment. This "active" mode is reflected in the oscillator's color and the dashboard.
Stage 3: Signal (Normalized Velocity Oscillator)
The winning ROC series is then normalized into a consistent oscillator (the Velocity line) that ranges from -100 (extreme oversold) to +100 (extreme overbought). This ensures signals are comparable across any asset or timeframe. Signals are only generated when this Velocity line crosses its signal line and the trend filters (explained below) give a green light.
3. How to Use the Indicator: A Practical Guide
Reading the Visuals:
Velocity Line (Blue/Yellow/Pink): The main oscillator line. Its color indicates which mode is active (Fast, Mid, or Slow).
Signal Line (White): A moving average of the Velocity line. Crossovers generate potential signals.
Buy/Sell Triangles (▲ / ▼): These are your primary entry signals. They are intentionally strict and only appear when momentum, trend, and price action align.
Background Color (Green/Red/Gray): This is your trend context.
Green: Bullish trend confirmed (e.g., price above a rising 200 EMA and ADX > 20). Only Buy signals (▲) can appear.
Red: Bearish trend confirmed. Only Sell signals (▼) can appear.
Gray: No clear trend. The market is likely choppy or consolidating. No signals will appear; it is best to stay out.
Trading Strategy Example:
Wait for a colored background. A green or red background indicates the market is in a tradable trend.
Look for a signal. For a green background, wait for a lime Buy triangle (▲) to appear.
Confirm the trade. Before entering, confirm the signal aligns with your own analysis (e.g., support/resistance levels, chart patterns).
Manage the trade. Set a stop-loss according to your risk management rules. An exit can be considered on a fixed target, a trailing stop, or when an opposing signal appears.
4. Settings and Customization
This script is open-source, and its settings are transparent. You are encouraged to understand them.
Synaptic Engine Group:
Volatility Period: The master control for the adaptive engine. Higher values are slower and more stable.
Optimization Lookback: How many bars to use for the correlation check.
Switch Sensitivity: A buffer to prevent frantic switching between modes.
Advanced Configuration & Filters Group:
Price Source: The data source for momentum calculation (default close).
Trend Filter MA Type & Length: Define your long-term trend.
Filter by MA Slope: A key feature. If ON, allows for "buy the dip" entries below a rising MA. If OFF, it's stricter, requiring price to be above the MA.
ADX Length & Threshold: Filters out non-trending, choppy markets. Signals will not fire if the ADX is below this threshold.
5. Important Disclaimer
This indicator is a decision-support tool for discretionary traders, not an automated trading system or financial advice. Past performance is not indicative of future results. All trading involves substantial risk. You should always use proper risk management, including setting stop-losses, and never risk more than you are prepared to lose. The signals generated by this script should be used as one component of a broader trading plan.

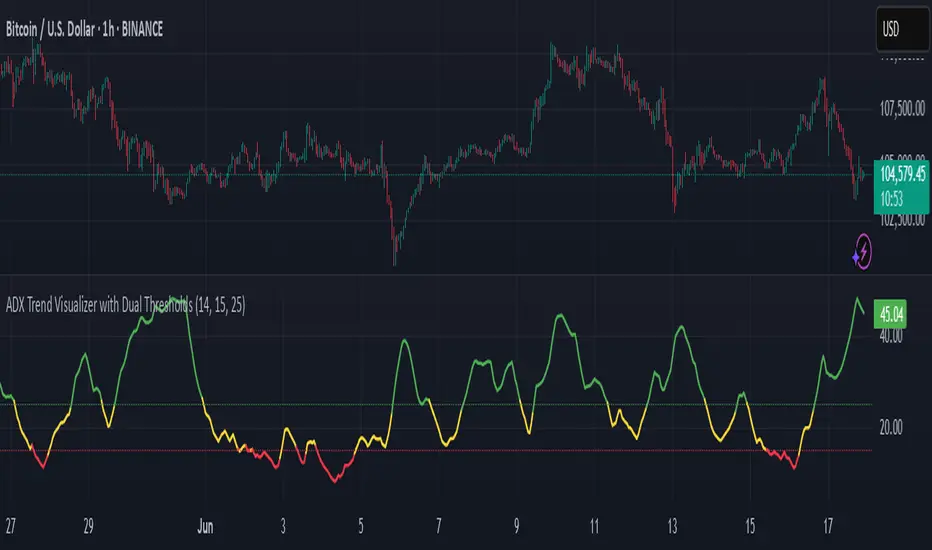
ADX Trend Visualizer with Dual ThresholdsADX Trend Visualizer with Dual Thresholds
A minimal, color coded ADX indicator designed to filter market conditions into weak, moderate, or strong trend phases.
Uses a dual threshold system for separating weak, moderate, and strong trend conditions.
Color coded ADX line:
Green– Strong trend (above upper threshold)
Yellow – Moderate trend (between thresholds)
Red – Weak or no trend (below lower threshold)
Two horizontal reference lines plotted at threshold levels
Optional +DI and -DI lines (Style tab)
Recommended Use:
Use on higher time frames (1h and above) as a trend filter
Combine with entry/exit signals from other indicators or strategies
Avoid possible false entries when ADX is below the weak threshold
This trend validator helps highlight strong directional moves and avoid weak market conditions
ADX Supertrend | [DeV]The "ADX Supertrend" indicator is a user-friendly tool that blends two popular trading indicators—the Supertrend and the Average Directional Index (ADX)—to help traders spot trends and make smarter trading decisions. By combining these two, it offers a clearer picture of when a market is trending strongly and in which direction, while cutting down on misleading signals. Here’s a straightforward explanation of how each part works, how they team up, the benefits of using them together, and why the ADX makes the Supertrend even better.
Supertrend:
It's like a guide that follows the market’s price movements to tell you whether prices are trending up or down. It creates two lines, one above and one below the price, based on how much the market is bouncing around (its volatility). When the price moves above the upper line, it signals an uptrend (a good time to buy), and the indicator draws a line below the price to show support. When the price drops below the lower line, it signals a downtrend (a potential time to sell), and the line appears above the price as resistance. The Supertrend is great because it adjusts to market conditions, widening the gap between lines in wild markets and tightening it in calm ones.
Average Directional Index:
The ADX is all about measuring how strong a trend is, without caring whether it’s going up or down. Think of it as a meter that tells you if the market is charging forward with purpose or just drifting aimlessly. It uses a scale from 0 to 100, where higher numbers mean a stronger trend. For example, an ADX above 25 often suggests a solid trend worth paying attention to, while a low ADX signals a sleepy, sideways market. The ADX also looks at whether buyers or sellers are in control to confirm the trend’s direction.
Confluence:
The Supertrend is great at spotting trends, but it can be a bit trigger-happy, giving signals in markets that aren’t really trending. That’s where the ADX shines. It acts like a quality control check, making sure the Supertrend’s signals only count when the market is moving with conviction. By filtering out weak or messy trends, the ADX helps you avoid wasting time on trades that fizzle out. It also double-checks the trend’s direction, so you’re not just guessing whether buyers or sellers are in charge. This teamwork means you get signals that are more reliable and less likely to lead you astray, especially in tricky markets where prices bounce around without a clear path.
ADX Forecast [Titans_Invest]ADX Forecast
This isn’t just another ADX indicator — it’s the most powerful and complete ADX tool ever created, and without question the best ADX indicator on TradingView, possibly even the best in the world.
ADX Forecast represents a revolutionary leap in trend strength analysis, blending the timeless principles of the classic ADX with cutting-edge predictive modeling. For the first time on TradingView, you can anticipate future ADX movements using scientifically validated linear regression — a true game-changer for traders looking to stay ahead of trend shifts.
1. Real-Time ADX Forecasting
By applying least squares linear regression, ADX Forecast projects the future trajectory of the ADX with exceptional accuracy. This forecasting power enables traders to anticipate changes in trend strength before they fully unfold — a vital edge in fast-moving markets.
2. Unmatched Customization & Precision
With 26 long entry conditions and 26 short entry conditions, this indicator accounts for every possible ADX scenario. Every parameter is fully customizable, making it adaptable to any trading strategy — from scalping to swing trading to long-term investing.
3. Transparency & Advanced Visualization
Visualize internal ADX dynamics in real time with interactive tags, smart flags, and fully adjustable threshold levels. Every signal is transparent, logic-based, and engineered to fit seamlessly into professional-grade trading systems.
4. Scientific Foundation, Elite Execution
Grounded in statistical precision and machine learning principles, ADX Forecast upgrades the classic ADX from a reactive lagging tool into a forward-looking trend prediction engine. This isn’t just an indicator — it’s a scientific evolution in trend analysis.
⯁ SCIENTIFIC BASIS LINEAR REGRESSION
Linear Regression is a fundamental method of statistics and machine learning, used to model the relationship between a dependent variable y and one or more independent variables 𝑥.
The general formula for a simple linear regression is given by:
y = β₀ + β₁x + ε
β₁ = Σ((xᵢ - x̄)(yᵢ - ȳ)) / Σ((xᵢ - x̄)²)
β₀ = ȳ - β₁x̄
Where:
y = is the predicted variable (e.g. future value of RSI)
x = is the explanatory variable (e.g. time or bar index)
β0 = is the intercept (value of 𝑦 when 𝑥 = 0)
𝛽1 = is the slope of the line (rate of change)
ε = is the random error term
The goal is to estimate the coefficients 𝛽0 and 𝛽1 so as to minimize the sum of the squared errors — the so-called Random Error Method Least Squares.
⯁ LEAST SQUARES ESTIMATION
To minimize the error between predicted and observed values, we use the following formulas:
β₁ = /
β₀ = ȳ - β₁x̄
Where:
∑ = sum
x̄ = mean of x
ȳ = mean of y
x_i, y_i = individual values of the variables.
Where:
x_i and y_i are the means of the independent and dependent variables, respectively.
i ranges from 1 to n, the number of observations.
These equations guarantee the best linear unbiased estimator, according to the Gauss-Markov theorem, assuming homoscedasticity and linearity.
⯁ LINEAR REGRESSION IN MACHINE LEARNING
Linear regression is one of the cornerstones of supervised learning. Its simplicity and ability to generate accurate quantitative predictions make it essential in AI systems, predictive algorithms, time series analysis, and automated trading strategies.
By applying this model to the ADX, you are literally putting artificial intelligence at the heart of a classic indicator, bringing a new dimension to technical analysis.
⯁ VISUAL INTERPRETATION
Imagine an ADX time series like this:
Time →
ADX →
The regression line will smooth these values and extend them n periods into the future, creating a predicted trajectory based on the historical moment. This line becomes the predicted ADX, which can be crossed with the actual ADX to generate more intelligent signals.
⯁ SUMMARY OF SCIENTIFIC CONCEPTS USED
Linear Regression Models the relationship between variables using a straight line.
Least Squares Minimizes the sum of squared errors between prediction and reality.
Time Series Forecasting Estimates future values based on historical data.
Supervised Learning Trains models to predict outputs from known inputs.
Statistical Smoothing Reduces noise and reveals underlying trends.
⯁ WHY THIS INDICATOR IS REVOLUTIONARY
Scientifically-based: Based on statistical theory and mathematical inference.
Unprecedented: First public ADX with least squares predictive modeling.
Intelligent: Built with machine learning logic.
Practical: Generates forward-thinking signals.
Customizable: Flexible for any trading strategy.
⯁ CONCLUSION
By combining ADX with linear regression, this indicator allows a trader to predict market momentum, not just follow it.
ADX Forecast is not just an indicator — it is a scientific breakthrough in technical analysis technology.
⯁ Example of simple linear regression, which has one independent variable:
⯁ In linear regression, observations ( red ) are considered to be the result of random deviations ( green ) from an underlying relationship ( blue ) between a dependent variable ( y ) and an independent variable ( x ).
⯁ Visualizing heteroscedasticity in a scatterplot against 100 random fitted values using Matlab:
⯁ The data sets in the Anscombe's quartet are designed to have approximately the same linear regression line (as well as nearly identical means, standard deviations, and correlations) but are graphically very different. This illustrates the pitfalls of relying solely on a fitted model to understand the relationship between variables.
⯁ The result of fitting a set of data points with a quadratic function:
_______________________________________________________________________
🥇 This is the world’s first ADX indicator with: Linear Regression for Forecasting 🥇_______________________________________________________________________
_________________________________________________
🔮 Linear Regression: PineScript Technical Parameters 🔮
_________________________________________________
Forecast Types:
• Flat: Assumes prices will remain the same.
• Linreg: Makes a 'Linear Regression' forecast for n periods.
Technical Information:
ta.linreg (built-in function)
Linear regression curve. A line that best fits the specified prices over a user-defined time period. It is calculated using the least squares method. The result of this function is calculated using the formula: linreg = intercept + slope * (length - 1 - offset), where intercept and slope are the values calculated using the least squares method on the source series.
Syntax:
• Function: ta.linreg()
Parameters:
• source: Source price series.
• length: Number of bars (period).
• offset: Offset.
• return: Linear regression curve.
This function has been cleverly applied to the RSI, making it capable of projecting future values based on past statistical trends.
______________________________________________________
______________________________________________________
⯁ WHAT IS THE ADX❓
The Average Directional Index (ADX) is a technical analysis indicator developed by J. Welles Wilder. It measures the strength of a trend in a market, regardless of whether the trend is up or down.
The ADX is an integral part of the Directional Movement System, which also includes the Plus Directional Indicator (+DI) and the Minus Directional Indicator (-DI). By combining these components, the ADX provides a comprehensive view of market trend strength.
⯁ HOW TO USE THE ADX❓
The ADX is calculated based on the moving average of the price range expansion over a specified period (usually 14 periods). It is plotted on a scale from 0 to 100 and has three main zones:
• Strong Trend: When the ADX is above 25, indicating a strong trend.
• Weak Trend: When the ADX is below 20, indicating a weak or non-existent trend.
• Neutral Zone: Between 20 and 25, where the trend strength is unclear.
______________________________________________________
______________________________________________________
⯁ ENTRY CONDITIONS
The conditions below are fully flexible and allow for complete customization of the signal.
______________________________________________________
______________________________________________________
🔹 CONDITIONS TO BUY 📈
______________________________________________________
• Signal Validity: The signal will remain valid for X bars .
• Signal Sequence: Configurable as AND or OR .
🔹 +DI > -DI
🔹 +DI < -DI
🔹 +DI > ADX
🔹 +DI < ADX
🔹 -DI > ADX
🔹 -DI < ADX
🔹 ADX > Threshold
🔹 ADX < Threshold
🔹 +DI > Threshold
🔹 +DI < Threshold
🔹 -DI > Threshold
🔹 -DI < Threshold
🔹 +DI (Crossover) -DI
🔹 +DI (Crossunder) -DI
🔹 +DI (Crossover) ADX
🔹 +DI (Crossunder) ADX
🔹 +DI (Crossover) Threshold
🔹 +DI (Crossunder) Threshold
🔹 -DI (Crossover) ADX
🔹 -DI (Crossunder) ADX
🔹 -DI (Crossover) Threshold
🔹 -DI (Crossunder) Threshold
🔮 +DI (Crossover) -DI Forecast
🔮 +DI (Crossunder) -DI Forecast
🔮 ADX (Crossover) +DI Forecast
🔮 ADX (Crossunder) +DI Forecast
______________________________________________________
______________________________________________________
🔸 CONDITIONS TO SELL 📉
______________________________________________________
• Signal Validity: The signal will remain valid for X bars .
• Signal Sequence: Configurable as AND or OR .
🔸 +DI > -DI
🔸 +DI < -DI
🔸 +DI > ADX
🔸 +DI < ADX
🔸 -DI > ADX
🔸 -DI < ADX
🔸 ADX > Threshold
🔸 ADX < Threshold
🔸 +DI > Threshold
🔸 +DI < Threshold
🔸 -DI > Threshold
🔸 -DI < Threshold
🔸 +DI (Crossover) -DI
🔸 +DI (Crossunder) -DI
🔸 +DI (Crossover) ADX
🔸 +DI (Crossunder) ADX
🔸 +DI (Crossover) Threshold
🔸 +DI (Crossunder) Threshold
🔸 -DI (Crossover) ADX
🔸 -DI (Crossunder) ADX
🔸 -DI (Crossover) Threshold
🔸 -DI (Crossunder) Threshold
🔮 +DI (Crossover) -DI Forecast
🔮 +DI (Crossunder) -DI Forecast
🔮 ADX (Crossover) +DI Forecast
🔮 ADX (Crossunder) +DI Forecast
______________________________________________________
______________________________________________________
🤖 AUTOMATION 🤖
• You can automate the BUY and SELL signals of this indicator.
______________________________________________________
______________________________________________________
⯁ UNIQUE FEATURES
______________________________________________________
Linear Regression: (Forecast)
Signal Validity: The signal will remain valid for X bars
Signal Sequence: Configurable as AND/OR
Condition Table: BUY/SELL
Condition Labels: BUY/SELL
Plot Labels in the Graph Above: BUY/SELL
Automate and Monitor Signals/Alerts: BUY/SELL
Linear Regression (Forecast)
Signal Validity: The signal will remain valid for X bars
Signal Sequence: Configurable as AND/OR
Table of Conditions: BUY/SELL
Conditions Label: BUY/SELL
Plot Labels in the graph above: BUY/SELL
Automate & Monitor Signals/Alerts: BUY/SELL
______________________________________________________
📜 SCRIPT : ADX Forecast
🎴 Art by : @Titans_Invest & @DiFlip
👨💻 Dev by : @Titans_Invest & @DiFlip
🎑 Titans Invest — The Wizards Without Gloves 🧤
✨ Enjoy!
______________________________________________________
o Mission 🗺
• Inspire Traders to manifest Magic in the Market.
o Vision 𐓏
• To elevate collective Energy 𐓷𐓏

Directional Movement Index (DMI) + AlertsThis is a Study with associated visual indicators and Bullish/Bearish Alerts for Directional Movement (DMI). It consists of an Average Directional Index (ADX), Plus Directional Indicator (+DI) and Minus Directional Indicator (-DI).
Published by J. Welles Wilder in 1978 for use with currencies and commodities which are typically more volatile than stocks and have stronger trends.
Development Notes
---------------------------
This indicator, and most of the descriptions below, were derived largely from the TradingView reference manual. Feedback and suggestions for improvement are more than welcome, as well are recommended Input settings and best practices for use.
tradingview.com/chart/?solution=43000502250
Strategy Description
---------------------------
ADX defines whether or not there is a trend present; +DI and -DI compliment the ADX by taking direction into account. An ADX above 25 indicates a strong trend, and a Bullish alert is subsequently triggered when +DI is above -DI and a Bearish alert when -DI is above +DI.
Note that the Bullish or Bearish crossover alert will only trigger if ADX is simultaneously above 25 during the crossover event. If ADX later rises to 25 and +DI is still greater than -DI, or -DI greater than +DI, then a delayed alert will not trigger by design.
Basic Use
---------------------------
Acceptable DMI values are up to the trader's interpretation and may change depending on the financial instrument being examined. Recommend not changing any default values without being first familiar with their purpose and impact on the indicator at large.
Confidence in price action and trend is higher when two or more indicators are in agreement -- therefore we recommend not using this indicator by itself to determine entry or exit trade opportunities.
Recommend also choosing 'Once Per Bar Close' when creating alerts.
Inputs
---------------------------
ADX Smoothing - the time period to be used in calculating the ADX which has a smoothing component (14 is the Default).
DI Length - the time period to be used in calculating the DI (14 is the Default).
Key Level - any trade with the ADX above the key level is a strong indicator that it is trending (23 to 25 is the suggested setting).
Sensitivity - an incremental variable to test whether the past n candles are in the same bullish or bearish state before triggering a delayed crossover alert (3 is the Default). Filter out some noise and reduces active alerts.
Show ADX Option - two visual styles are provided for user preference, a visible ADX line or a background overlay (green or red when ADX is above the key level, for bullish or bearish, and gray when below).
Color Candles - an option to transpose the bullish and bearish crossovers to the main candle bars. Can be turned off in the Style Tab by deselecting 'Bar Colors'. Dark blue is bullish, dark purple is bearish, and the black inner color is neutral. Note that the outer red and green border will still be distinguished by whether each individual candle is bearish or bullish during the specified timeframe.
Indicator Visuals
---------------------------
Bullish or Bearish plot based on DMI strategy (ADX and +/-DI values).
Visual cues are intended to improve analysis and decrease interpretation time during trading, as well as to aid in understanding the purpose of this study and how its inclusion can benefit a comprehensive trading strategy.
Trend Strength
---------------------------
To analyze trend strength, the focus should be on the ADX line and not the +DI or -DI lines. An ADX reading above 25 indicates a strong trend, while a reading below 20 indicates a weak or non-existent trend. A reading between those two values would be considered indeterminable. Though what is truly a strong trend or a weak trend depends on the financial instrument being examined; historical analysis can assist in determining appropriate values.
Bullish DI Cross
---------------------------
1. ADX must be over 25 (strong trend) (value is determined by the trader)
2. +DI cross above -DI
3. Set Stop Loss at the current day's low (any +DI cross-backs below -DI should be ignored)
4. Set trailing stop if ADX strengthens (i.e., signal rises)
Bearish DI Cross
---------------------------
1. ADX must be over 25 (strong trend) (value is determined by the trader)
2. -DI cross above +DI
3. Set Stop Loss at the current day's high (any -DI cross-backs below +DI should be ignored)
4. Set trailing stop if ADX strengthens (i.e., signal rises)
Disclaimer
---------------------------
This post and the script are not intended to provide any financial advice. Trade at your own risk.
No known repainting.
Version 1.1
-------------------------
- Added multi-timeframe resolution using PineCoders secure security function to eliminate repainting.
- Cleaned up option for selecting ADX view; and added a colored line as a choice, based on same bullish, bearish, or neutral colors as the background.
- Added exit crossover indicator to aid in an overall strategy development. This ability pairs better with my CHOP Zone Entry Strategy which relies on DMI Exits. Note that exit conditions don't employ the sensitivity variable. Green labels are for Bullish exits and red are for Bearish.
-- Exit condition is triggered if in an active Bullish or Bearish position and ADX drops below 25, Or if either the -DI crosses above +DI (for previously Bullish) or +DI crosses above -DI (for previously Bearish).
- Added reverse position determination. Triggers when a Bullish entry occurs on the same candle as a Bearish exit, or vice versa. Green labels are for Bullish reverses and red are for Bearish.
- Added selectable option to choose visible labels -- Bearish, Bullish, Both, Exits, Reverses, or All.
-- Note that a reverse label will only show if the opposing entry and exit labels are set to show, otherwise the reverse will revert to the appropriate entry or exit on the chart.
- Added alerts to account for new conditions.
-- Note that alerts for crossovers, exits, and reverses will only be triggered if the associated labels are selected to be shown (i.e., what you choose to see on the chart is what you will be alerted to).
Version 1.2
-------------------------
- Changed exit condition to be decided on by whether ADX is below 25 and on a +/-DI crossover. Versus being either or. The previous version had too many false triggers. This variety can now show multiple Bullish or Bearish alerts before an Exit condition too. I'm tempted to simply make this condition based on ADX, and not DI … thoughts? See lines 138 and 139.
- Updated the Background view to have deeper shades of colors dependent upon the ADX trend strength.
- Added an Oscillator view for the ADX and momentum computations to color the histogram by trend. DI lines are hidden.
-- If ADX is Bullish, then the oscillator is colored light green in an uptrend and dark green in a downtrend; if Bearish, then its light red in an uptrend and dark redin a downtrend; if adx is below key level, then it is light gray in a downtrend and dark grey in the uptrend.
- Added option to Hide ADX in case only the Directional lines are desired. This could be useful if you would like to have the ADX oscillator in one panel and +/-DI crossovers in another.
- Added a Columnar view for the ADX. DI lines are hidden. This view is really simple and compact, with the trend strength still easily understood. Colors are the same as for the oscillator -- the deeper the shade of green or red, then the higher the ADX trend strength level.
- Added a Trend Strength label.
ADX Trend Strength Trade (Y/N) Setup Types
0 to 10 = Barely Breathing N N/A
10 to 20 = Weak Trend Y Range/Pre-Breakout
20 to 30 = Potentially Starting to Trend Y Early Stage Trend
30 to 50 = Strong Trend Y Ride the Wave
50 to 75 = Very Strong Trend N Exhaustion
75 to 100 = Extremely Strong Trend N N/A
Version 1.3
-------------------------
Updated to Pine Script v5 to resolve errors from the deprecated v4 version.
This is a reissue of a previously published script that was hidden due to a v4 compatibility issue.
'https://www.tradingview.com/script/9OoEHrv5-Directional-Movement-Index-DMI-Alerts/'

ADX Full [Titans_Invest]ADX Full
This is, without a doubt, the most complete ADX indicator available on TradingView — and quite possibly the most advanced in the world. We took the classic ADX structure and fully optimized it, preserving its essence while elevating its functionality to a whole new level. Every aspect has been enhanced — from internal logic to full visual customization. Now you can see exactly what’s happening inside the indicator in real time, with tags, flags, and informative levels. This indicator includes over 22 long entry conditions and 22 short entry conditions , covering absolutely every possibility the ADX can offer. Everything is transparent, adjustable, and ready to fit seamlessly into any professional trading strategy. This isn’t just another ADX — it’s the definitive ADX, built for traders who take the market seriously.
⯁ WHAT IS THE ADX❓
The Average Directional Index (ADX) is a technical analysis indicator developed by J. Welles Wilder. It measures the strength of a trend in a market, regardless of whether the trend is up or down.
The ADX is an integral part of the Directional Movement System, which also includes the Plus Directional Indicator (+DI) and the Minus Directional Indicator (-DI). By combining these components, the ADX provides a comprehensive view of market trend strength.
⯁ HOW TO USE THE ADX❓
The ADX is calculated based on the moving average of the price range expansion over a specified period (usually 14 periods). It is plotted on a scale from 0 to 100 and has three main zones:
Strong Trend: When the ADX is above 25, indicating a strong trend.
Weak Trend: When the ADX is below 20, indicating a weak or non-existent trend.
Neutral Zone: Between 20 and 25, where the trend strength is unclear.
⯁ ENTRY CONDITIONS
The conditions below are fully flexible and allow for complete customization of the signal.
______________________________________________________
🔹 CONDITIONS TO BUY 📈
______________________________________________________
• Signal Validity: The signal will remain valid for X bars .
• Signal Sequence: Configurable as AND or OR .
🔹 +DI > -DI
🔹 +DI < -DI
🔹 +DI > ADX
🔹 +DI < ADX
🔹 -DI > ADX
🔹 -DI < ADX
🔹 ADX > Threshold
🔹 ADX < Threshold
🔹 +DI > Threshold
🔹 +DI < Threshold
🔹 -DI > Threshold
🔹 -DI < Threshold
🔹 +DI (Crossover) -DI
🔹 +DI (Crossunder) -DI
🔹 +DI (Crossover) ADX
🔹 +DI (Crossunder) ADX
🔹 +DI (Crossover) Threshold
🔹 +DI (Crossunder) Threshold
🔹 -DI (Crossover) ADX
🔹 -DI (Crossunder) ADX
🔹 -DI (Crossover) Threshold
🔹 -DI (Crossunder) Threshold
______________________________________________________
______________________________________________________
🔸 CONDITIONS TO SELL 📉
______________________________________________________
• Signal Validity: The signal will remain valid for X bars .
• Signal Sequence: Configurable as AND or OR .
🔸 +DI > -DI
🔸 +DI < -DI
🔸 +DI > ADX
🔸 +DI < ADX
🔸 -DI > ADX
🔸 -DI < ADX
🔸 ADX > Threshold
🔸 ADX < Threshold
🔸 +DI > Threshold
🔸 +DI < Threshold
🔸 -DI > Threshold
🔸 -DI < Threshold
🔸 +DI (Crossover) -DI
🔸 +DI (Crossunder) -DI
🔸 +DI (Crossover) ADX
🔸 +DI (Crossunder) ADX
🔸 +DI (Crossover) Threshold
🔸 +DI (Crossunder) Threshold
🔸 -DI (Crossover) ADX
🔸 -DI (Crossunder) ADX
🔸 -DI (Crossover) Threshold
🔸 -DI (Crossunder) Threshold
______________________________________________________
______________________________________________________
🤖 AUTOMATION 🤖
• You can automate the BUY and SELL signals of this indicator.
______________________________________________________
______________________________________________________
⯁ UNIQUE FEATURES
______________________________________________________
Signal Validity: The signal will remain valid for X bars
Signal Sequence: Configurable as AND/OR
Condition Table: BUY/SELL
Condition Labels: BUY/SELL
Plot Labels in the Graph Above: BUY/SELL
Automate and Monitor Signals/Alerts: BUY/SELL
Signal Validity: The signal will remain valid for X bars
Signal Sequence: Configurable as AND/OR
Table of Conditions: BUY/SELL
Conditions Label: BUY/SELL
Plot Labels in the graph above: BUY/SELL
Automate & Monitor Signals/Alerts: BUY/SELL
______________________________________________________
📜 SCRIPT : ADX Full
🎴 Art by : @Titans_Invest & @DiFlip
👨💻 Dev by : @Titans_Invest & @DiFlip
🎑 Titans Invest — The Wizards Without Gloves 🧤
✨ Enjoy!
______________________________________________________
o Mission 🗺
• Inspire Traders to manifest Magic in the Market.
o Vision 𐓏
• To elevate collective Energy 𐓷𐓏

QuantumSync Pulse [ w.aritas ]QuantumSync Pulse (QSP) is an advanced technical indicator crafted for traders seeking a dynamic and adaptable tool to analyze diverse market conditions. By integrating momentum, mean reversion, and regime detection with quantum-inspired calculations and entropy analysis, QSP offers a powerful histogram that reflects trend strength and market uncertainty. With multi-timeframe synchronization, adaptive filtering, and customizable visualization, it’s a versatile addition to any trading strategy.
Key Features
Hybrid Signals: Combines momentum and mean reversion, dynamically weighted by market regime.
Quantum Tunneling: Enhances responsiveness in volatile markets using volatility-adjusted calculations.
3-State Entropy: Assesses market uncertainty across up, down, and neutral states.
Regime Detection: Adapts signal weights with Hurst exponent and volatility ROC.
Multi-Timeframe Alignment: Syncs with higher timeframe trends for context.
Customizable Histogram: Displays trend strength with ADX-based visuals and flexible styling.
How to Use and Interpret
Histogram Interpretation
Positive (Above Zero): Bullish momentum; color intensity shows trend strength.
Negative (Below Zero): Bearish momentum; gradients indicate weakness.
Overlaps: Alignment of final_z (signal) and ohlc4 (price) histograms highlights key price levels or turning points.
Regime Visualization
Green Background: Trending market; prioritize momentum signals.
Red Background: Mean-reverting market; focus on reversion signals.
Blue Background: Neutral state; balance both signal types.
Trading Signals
Buy: Histogram crosses above zero or shows positive divergence between histograms.
Sell: Histogram crosses below zero or exhibits negative divergence.
Confirmation: Match signals with regime background—green for trends, red for ranges.
Customization
Tweak Momentum Length, Entropy Lookback, and Hurst Exponent Lookback for sensitivity.
Adjust color themes and transparency to suit your charts.
Tips for Optimal Use
Timeframes: Use higher timeframes (1h, 4h) for trend context and lower (5m, 15m) for entries.
Pairing: Combine with RSI, MACD, or volume indicators for confirmation.
Backtesting: Test settings on historical data for asset-specific optimization.
Overlaps: Watch for histogram overlaps to identify support, resistance, or reversals.
Simulated Performance
Trending Markets: Histogram stays above/below zero, with overlaps at retracements for entries.
Range-Bound Markets: Oscillates around zero; overlaps signal reversals in red regimes.
Volatile Markets: Quantum tunneling ensures quick reactions, with filters reducing noise.
Elevate your trading with QuantumSync Pulse—a sophisticated tool that adapts to the market’s rhythm and your unique style.

Smart Market Matrix Smart Market Matrix
This indicator is designed for intraday, scalping, providing automated detection of price pivots, liquidity traps, and breakout confirmations, along with a context dashboard featuring volatility, trend, and volume.
## Summary Description
### Menu Settings & Their Roles
- **Swing Pivot Strength**: Controls the sensitivity for detecting High/Low pivots.
- **Show Pivot Points**: Toggles the display of HH/LL markers on the chart.
- **VWMA Length for Trap Volume** & **Volume Spike Multiplier**: Identify concentrated volume spikes for liquidity traps.
- **Wick Ratio Threshold** & **Max Body Size Ratio**: Detect candles with disproportionate wicks and small bodies (doji-ish) for traps.
- **ATR Length for Trap**: Measures volatility specific to trap detection.
- **VWMA Length for Breakout Volume**, **ATR Multiplier for Breakout**, **ATR Length for Breakout**, **Min Body/Range Ratio**: Set adaptive breakout thresholds based on volatility and volume.
- **OBV Smooth Length**: Smooths OBV momentum for breakout confirmation.
- **Enable VWAP Filter for Confirmations**: Optionally validate breakouts against the VWAP.
- **Enable Higher-TF Trend Filter** & **Trend Filter Timeframe**: Align breakout signals with the 1h/4h/Daily trend.
- **ADX Length**, **EMA Fast/Slow Length for Context**: Parameters for the context dashboard (Volatility, Trend, Volume).
- **Show Intraday VWAP Line**, **VWAP Line Color/Width**: Display the intraday VWAP line with custom style.
### Signal Interpretation Map
| Signal | Description | Recommended Action |
|--------------------------------|-----------------------------------------------------------|-------------------------------------------|
| 📌 **HH / LL (pivot)** | Market structure (support/resistance) | Note key levels |
| **Bull Trap(green diamond)** | Sweep down + volume spike + wick + rejection | Go long with trend filter
| **Bear Trap(red diamond)** | Sweep up + volume spike + wick + rejection | Go short with trend filter
| 🔵⬆️ **Breakout Confirmed Up** | Close > ATR‑scaled high + volume + OBV↑ | Go long with trend filter |
| 🔵⬇️ **Breakout Confirmed Down** | Close < ATR‑scaled low + volume + OBV↓ | Go short with trend filter |
| 📊 **VWAP Line** | Intraday reference to guide price | Use as dynamic support/resistance |
| ⚡ **Volatility** | ATR ratio High/Med/Low | Adjust position size |
| 📈 **Trend Context** | ADX+EMA Strong/Moderate/Weak | Confirm trend direction |
| 🔍 **Volume Context** | Breakout / Rising / Falling / Calm | Check volume momentum |
*This summary gives you a quick overview of the key settings and how to interpret signals for efficient intraday scalping.*
### Suggested Settings
- **Intraday Scalping (5m–15m)**
- `Swing Pivot Strength = 5`
- `VWMA Length for Trap Volume = 10`, `Volume Spike Multiplier = 1.6`
- `ATR Length for Trap = 7`
- `VWMA Length for Breakout Volume = 12`, `ATR Length for Breakout = 9`, `ATR Multiplier for Breakout = 0.5`
- `Min Body/Range Ratio for Breakout = 0.5`, `OBV Smooth Length = 7`
- `Enable Higher-TF Trend Filter = true` (TF = 60)
- `Show Intraday VWAP Line = true` (Color = orange, Width = 2)
- **Swing Trading (4h–Daily)**
- `Swing Pivot Strength = 10`
- `VWMA Length for Trap Volume = 20`, `Volume Spike Multiplier = 2.0`
- `ATR Length for Trap = 14`
- `VWMA Length for Breakout Volume = 30`, `ATR Length for Breakout = 14`, `ATR Multiplier for Breakout = 0.8`
- `Min Body/Range Ratio for Breakout = 0.7`, `OBV Smooth Length = 14`
- `Enable Higher-TF Trend Filter = true` (TF = D)
- `Show Intraday VWAP Line = false`
*Adjust these values based on the symbol and market volatility for optimal performance.*

Adv EMA Cloud v6 (ADX, Alerts)Summary:
This indicator provides a multi-faceted view of market trends using Exponential Moving Averages (EMAs) arranged in visually intuitive clouds, enhanced with an optional ADX-based range filter and configurable alerts for key market conditions. It aims to help traders quickly gauge trend alignment across short, medium, and long timeframes while filtering signals during potentially choppy market conditions.
Key Features:
Multiple EMAs: Displays 10-period (Fast), 20-period (Mid), and 50-period (Slow) EMAs.
Long-Term Trend Filter: Includes a 200-period EMA to provide context for the overall dominant trend direction.
Dual EMA Clouds:
Fast/Mid Cloud (10/20 EMA): Fills the area between the 10 and 20 EMAs. Defaults to Green when 10 > 20 (bullish short-term momentum) and Red when 10 < 20 (bearish short-term momentum).
Mid/Slow Cloud (20/50 EMA): Fills the area between the 20 and 50 EMAs. Defaults to Aqua when 20 > 50 (bullish mid-term trend) and Fuchsia when 20 < 50 (bearish mid-term trend).
Optional ADX Range Filter: Uses the Average Directional Index (ADX) to identify potentially non-trending or choppy markets. When enabled and ADX falls below a user-defined threshold, the EMA clouds will turn grey, visually warning that trend-following signals may be less reliable.
Configurable Alerts: Provides several built-in alert conditions using Pine Script's alertcondition function:
Confluence Condition: Triggers when a 10/20 EMA crossover occurs while both EMA clouds show alignment (both bullish/green/aqua or both bearish/red/fuchsia) and price respects the 200 EMA filter and the ADX filter indicates a trend (if filters are enabled).
MA Filter Cross: Triggers when price crosses above or below the 200 EMA filter line.
Full Alignment Start: Triggers on the first bar where full bullish or bearish alignment occurs (both clouds aligned + MA filter respected + ADX trending, if filters are enabled).
How It Works:
EMA Calculation: Standard Exponential Moving Averages are calculated for the 10, 20, 50, and 200 periods based on the closing price.
Cloud Creation: The fill() function visually shades the area between the 10 & 20 EMAs and the 20 & 50 EMAs.
Cloud Coloring: The color of each cloud is determined by the relationship between the two EMAs that define it (e.g., if EMA 10 is above EMA 20, the first cloud is bullish-colored).
ADX Filter Logic: The script calculates the ADX value. If the "Use ADX Trend Filter?" input is checked and the calculated ADX is below the specified "ADX Trend Threshold", the script considers the market potentially ranging.
ADX Visual Effect: During detected ranging periods (if the ADX filter is active), the plotCloud12Color and plotCloud23Color variables are assigned a neutral grey color instead of their normal bullish/bearish colors before being passed to the fill() function.
Alert Logic: Boolean variables track the specific conditions (crossovers, cloud alignment, filter positions, ADX state). The alertcondition() function creates triggerable alerts based on these pre-defined conditions.
Potential Interpretation (Not Financial Advice):
Trend Alignment: When both clouds share the same directional color (e.g., both bullish - Green & Aqua) and price is on the corresponding side of the 200 EMA filter, it may suggest a stronger, more aligned trend. Conversely, conflicting cloud colors may indicate indecision or transition.
Dynamic Support/Resistance: The EMA lines themselves (especially the 20, 50, and 200) can sometimes act as dynamic levels where price might react.
Range Warning: Greyed-out clouds (when ADX filter is enabled) serve as a visual warning that trend-based strategies might face increased difficulty or whipsaws.
Confluence Alerts: The specific confluence alerts signal moments where multiple conditions align (crossover + cloud agreement + filters), which some traders might view as higher-probability setups.
Customization:
All EMA lengths (10, 20, 50, 200) are adjustable via the Inputs menu.
The ADX length and threshold are configurable.
The MA Trend Filter and ADX Trend Filter can be independently enabled or disabled.
Disclaimer:
This indicator is provided for informational and educational purposes only. Trading financial markets involves significant risk. Past performance is not indicative of future results. Always conduct your own thorough analysis and consider your risk tolerance before making any trading decisions. This indicator should be used in conjunction with other analysis methods and tools. Do not trade based solely on the signals or visuals provided by this indicator.

Adaptive Trend FinderAdaptive Trend Finder - The Ultimate Trend Detection Tool
Introducing Adaptive Trend Finder, the next evolution of trend analysis on TradingView. This powerful indicator is an enhanced and refined version of Adaptive Trend Finder (Log), designed to offer even greater flexibility, accuracy, and ease of use.
What’s New?
Unlike the previous version, Adaptive Trend Finder allows users to fully configure and adjust settings directly within the indicator menu, eliminating the need to modify chart settings manually. A major improvement is that users no longer need to adjust the chart's logarithmic scale manually in the chart settings; this can now be done directly within the indicator options, ensuring a smoother and more efficient experience. This makes it easier to switch between linear and logarithmic scaling without disrupting the analysis. This provides a seamless user experience where traders can instantly adapt the indicator to their needs without extra steps.
One of the most significant improvements is the complete code overhaul, which now enables simultaneous visualization of both long-term and short-term trend channels without needing to add the indicator twice. This not only improves workflow efficiency but also enhances chart readability by allowing traders to monitor multiple trend perspectives at once.
The interface has been entirely redesigned for a more intuitive user experience. Menus are now clearer, better structured, and offer more customization options, making it easier than ever to fine-tune the indicator to fit any trading strategy.
Key Features & Benefits
Automatic Trend Period Selection: The indicator dynamically identifies and applies the strongest trend period, ensuring optimal trend detection with no manual adjustments required. By analyzing historical price correlations, it selects the most statistically relevant trend duration automatically.
Dual Channel Display: Traders can view both long-term and short-term trend channels simultaneously, offering a broader perspective of market movements. This feature eliminates the need to apply the indicator twice, reducing screen clutter and improving efficiency.
Fully Adjustable Settings: Users can customize trend detection parameters directly within the indicator settings. No more switching chart settings – everything is accessible in one place.
Trend Strength & Confidence Metrics: The indicator calculates and displays a confidence score for each detected trend using Pearson correlation values. This helps traders gauge the reliability of a given trend before making decisions.
Midline & Channel Transparency Options: Users can fine-tune the visibility of trend channels, adjusting transparency levels to fit their personal charting style without overwhelming the price chart.
Annualized Return Calculation: For daily and weekly timeframes, the indicator provides an estimate of the trend’s performance over a year, helping traders evaluate potential long-term profitability.
Logarithmic Adjustment Support: Adaptive Trend Finder is compatible with both logarithmic and linear charts. Traders who analyze assets like cryptocurrencies, where log scaling is common, can enable this feature to refine trend calculations.
Intuitive & User-Friendly Interface: The updated menu structure is designed for ease of use, allowing quick and efficient modifications to settings, reducing the learning curve for new users.
Why is this the Best Trend Indicator?
Adaptive Trend Finder stands out as one of the most advanced trend analysis tools available on TradingView. Unlike conventional trend indicators, which rely on fixed parameters or lagging signals, Adaptive Trend Finder dynamically adjusts its settings based on real-time market conditions. By combining automatic trend detection, dual-channel visualization, real-time performance metrics, and an intuitive user interface, this indicator offers an unparalleled edge in trend identification and trading decision-making.
Traders no longer have to rely on guesswork or manually tweak settings to identify trends. Adaptive Trend Finder does the heavy lifting, ensuring that users are always working with the strongest and most reliable trends. The ability to simultaneously display both short-term and long-term trends allows for a more comprehensive market overview, making it ideal for scalpers, swing traders, and long-term investors alike.
With its state-of-the-art algorithms, fully customizable interface, and professional-grade accuracy, Adaptive Trend Finder is undoubtedly one of the most powerful trend indicators available.
Try it today and experience the future of trend analysis.
This indicator is a technical analysis tool designed to assist traders in identifying trends. It does not guarantee future performance or profitability. Users should conduct their own research and apply proper risk management before making trading decisions.
// Created by Julien Eche - @Julien_Eche
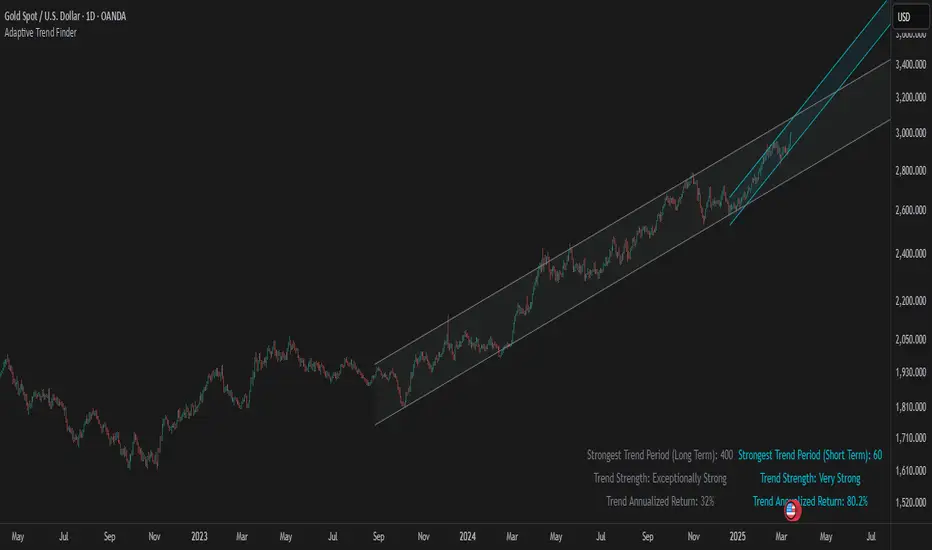
ADX with Moving AverageADX with Moving Average is a powerful indicator that enhances trend analysis by combining the standard Average Directional Index (ADX) with a configurable moving average.
The ADX helps traders identify the strength of a trend. In general:
ADX 0-20 – Absent or Weak Trend
ADX 25-50 – Strong Trend
ADX 50-75 – Very Strong Trend
ADX 75-100 – Extremely Strong Trend
By adding a moving average we can judge if the ADX itself is trending upwards or downwards, i.e. if a new trend is emerging or an existing one is weakening.
This combination allows traders to better confirm strong trends and filter out weak or choppy market conditions.
Key Features & Customization:
✔ Configurable DI & ADX Lengths – Adjust how quickly the ADX reacts to price movements (default: 14, 14).
✔ Multiple Moving Average Options – Choose between SMA, EMA, WMA, VWMA, or T3 for trend confirmation.
✔ Custom MA Length – Fine-tune the sensitivity of the moving average to match your strategy.
🔹 Use this indicator to confirm strong trends before entering trades, filter out false signals, or refine existing strategies with a dynamic trend-strength component. 🚀

TrendMasterPro_FekonomiTrend Change and Start Signals with Weighted Conditions
The Trend Change and Start Signals with Weighted Conditions indicator leverages various technical analysis tools to generate reliable buy and sell signals. This indicator helps investors more accurately identify trend changes and start signals in the market.
Features:
Utilizes popular technical analysis tools such as MACD, RSI, EMA, and Ichimoku Cloud.
Enhances signal accuracy with additional indicators like ADX and Volume Increase.
Allows users to adjust the weights of each condition to set their importance.
The Confidence Level parameter lets you adjust the accuracy rate of the signals.
Visual Signals make it easy to track buy and sell points directly on the chart.
How It Works:
Condition Weights: Users assign weights to indicators like MACD, RSI, EMA, and Ichimoku Cloud. If you have no idea, use default settings.
Condition Fulfillment: Checks if the conditions for each indicator are met.
Confidence Level: The total weight of the fulfilled conditions must exceed the user-defined confidence level.
Signal Generation: When these conditions are met, a buy or sell signal is generated and visually displayed on the chart.
Customization:
Personalize Signals: By adjusting the weights of the indicators used, you can personalize the signals to match your trading strategy and preferences.
Use Cases:
Short-Term Investments: Identify quick trend changes for short-term trading decisions.
Long-Term Investments: Detect long-term trend starts and changes for strategic investment decisions.
Technical Analysis: Combine different technical analysis tools for more comprehensive and reliable analyses.
With this indicator, you can better understand market movements and make more informed investment decisions. Try it now and enhance your trading strategy!
by Fekonomi

Catalyst TrendCatalyst Trend – A Comprehensive Trend and Regime Analyzer
The Catalyst Trend indicator was designed to dynamically and intuitively merge various classic analytical techniques. The goal is to filter out short-term market noise and reveal reliable trend phases or potential turning points. Below is a detailed explanation of its core elements and practical usage.
1. Concept and Idea
Multidimensional Trend Detection
This indicator goes beyond a simple momentum or volatility focus. It factors in multiple measurements to provide a more well-rounded market perspective.
Versatile Indicator Fusion
Linear Regression (LinReg): Multiple LinReg calculations are combined to smooth out price fluctuations and produce a robust trendline—known here as the “Cycle Reduced Line.”
ADX (Average Directional Index): Measures trend strength.
RSI (Relative Strength Index): Flags potential overbought or oversold conditions, in both the current timeframe and a higher timeframe.
ATR (Average True Range): Assesses volatility; used to dynamically adjust calculation lengths.
By weaving these elements together, the indicator adds value beyond simply stacking multiple indicators. It adapts to real-time market conditions, aiming to highlight genuine trends and reduce false signals.
2. Key Functions and Calculations
Dynamic Length & Smoothing
A blend of volatility (ATR), ADX values, and RSI inputs determines how many candles are used in the LinReg calculations and how heavily the data is smoothed.
This allows the indicator to respond promptly during periods of high volatility, while automatically adjusting to filter out unnecessary noise in quieter phases.c
Cycle Reduced Line
The script averages several offset LinReg calculations to produce a cleaner overall signal. Random outliers are thus minimized, making the trend path more visually consistent.
An additional EMA smoothing (“Final Smoothing”) further stabilizes this trendline, reducing the impact of minor price fluctuations.
Channel Bands (Optional)
These bands are derived from the standard deviation of the price residual (the difference between the smoothed price and the trendline).
They highlight potential over-extension zones: the upper band can mark short-term overbought areas, while the lower band might indicate oversold conditions.
Trend and Sideways Determination
Slope Calculation: The slope of the trendline (comparing the current bar to the previous one) helps identify short-term directional shifts.
DX Threshold: Once the ADX surpasses a user-defined threshold and the slope is positive, it may indicate a developing uptrend. Similarly, if the slope is negative and ADX > threshold, it could signal a potential downtrend.
Multi-Level Color Coding
Original Mode: Interpolated colors reflect uptrends, downtrends, and sideways phases, factoring in metrics like ADX and RSI.
Single Color: For a neutral look, the indicator can be displayed in one uniform color.
HTF RSI: This mode uses the higher-timeframe RSI to color the trendline (Long/Short/Neutral), offering a quick gauge of overarching market pressure.
3. Use Cases and Interpretation
Timeframes & Markets
The indicator is versatile and adapts well to different intervals, from 5-minute charts to weekly views.
It can be applied to various markets—crypto, forex, stocks—since volatility and trend strength are universal concepts.
Signal Recognition
Color Swings into a more pronounced upward hue (e.g., green) may signal mounting strength.
Neutral or mixed tones often point to sideways phases, which breakout traders might watch for potential price surges.
A shift to downward colors (e.g., red) may indicate a growing bearish trend.
Channel Bands & Volatility
When the bands spread widely, it’s wise to proceed with caution: abrupt spikes above the upper band or below the lower band can flag rapid short-term extremes.
These bands are more of a reference for potential overextension than a strict buy or sell trigger.
Additional Confirmations
Not a standalone panacea: The Catalyst Trend indicator is an analytical tool, best used alongside other methods such as volume analysis or price action (candlestick patterns, support/resistance levels) to bolster confidence in trading decisions.
4. Practical Tips
Parameter Adjustments
Depending on the market—crypto vs. traditional currency pairs—different ADX, RSI, or smoothing periods may be more effective. Experiment with the settings to tailor the indicator to your preferred timeframe.
Strategic Integration
Trailing Stops: For those riding a trend, the trendline or the channel bands may serve as a reference to trail stop-loss orders.
Trend Confirmation: Using RSI and ADX filters can help traders avoid sideways markets or stay the course when the trend is strong.
5. Important Final Notes
No Guarantee of Profits
No indicator can predict the future. Markets are inherently volatile and often unpredictable.
Responsible Risk Management
Test the indicator in a demo environment or with smaller positions before committing to large trades.

Alpine Predictive BandsAlpine Predictive Bands - ADX & Trend Projection is an advanced indicator crafted to estimate potential price zones and trend strength by integrating dynamic support/resistance bands, ADX-based confidence scoring, and linear regression-based price projections. Designed for adaptive trend analysis, this tool combines multi-timeframe ADX insights, volume metrics, and trend alignment for improved confidence in trend direction and reliability.
Key Calculations and Components:
Linear Regression for Price Projection:
Purpose: Provides a trend-based projection line to illustrate potential price direction.
Calculation: The Linear Regression Centerline (LRC) is calculated over a user-defined lookbackPeriod. The slope, representing the rate of price movement, is extended forward using predictionLength. This projected path only appears when the confidence score is 70% or higher, revealing a white dotted line to highlight high-confidence trends.
Adaptive Prediction Bands:
Purpose: ATR-based bands offer dynamic support/resistance zones by adjusting to volatility.
Calculation: Bands are calculated using the Average True Range (ATR) over the lookbackPeriod, multiplied by a volatilityMultiplier to adjust the width. These shaded bands expand during higher volatility, guiding traders in identifying flexible support/resistance zones.
Confidence Score (ADX, Volume, and Trend Alignment):
Purpose: Reflects the reliability of trend projections by combining ADX, volume status, and EMA alignment across multiple timeframes.
ADX Component: ADX values from the current timeframe and two higher timeframes assess trend strength on a broader scale. Strong ADX readings across timeframes boost the confidence score.
Volume Component: Volume strength is marked as “High” or “Low” based on a moving average, signaling trend participation.
Trend Alignment: EMA alignment across timeframes indicates “Bullish” or “Bearish” trends, confirming overall trend direction.
Calculation: ADX, volume, and trend alignment integrate to produce a confidence score from 0% to 100%. When the score exceeds 70%, the white projection line is activated, underscoring high-confidence trend continuations.
User Guide
Projection Line: The white dotted line, which appears only when the confidence score is 70% or higher, highlights a high-confidence trend.
Prediction Bands: Adaptive bands provide potential support/resistance zones, expanding with market volatility to help traders visualize price ranges.
Confidence Score: A high score indicates a stronger, more reliable trend and can support trend-following strategies.
Settings
Prediction Length: Determines the forward length of the projection.
Lookback Period: Sets the data range for calculating regression and ATR.
Volatility Multiplier: Adjusts the width of bands to match volatility levels.
Disclaimer: This indicator is for educational purposes and does not guarantee future price outcomes. Additional analysis is recommended, as trading carries inherent risks.

Mars Signals - SSL Trend AnalyzerIntroduction
The "Mars Signals - Precision Trend Analyzer with SSL Baseline & Price Action Zones" is a comprehensive technical analysis tool designed for traders seeking to enhance their market analysis and trading strategies. This indicator integrates multiple advanced trading concepts, including dynamic moving averages, trend detection algorithms, momentum indicators, volume analysis, higher timeframe confirmation, candlestick pattern recognition, and precise price action zones. By combining these elements, the indicator aims to provide clear and actionable buy and sell signals, helping traders to make informed decisions in various market conditions.
Core Components and Functionality
1.Dynamic Baseline Calculation
Moving Average Types: The indicator allows users to select from a variety of moving average types for the baseline calculation, including Simple Moving Average (SMA), Exponential Moving Average (EMA), Hull Moving Average (HMA), Weighted Moving Average (WMA), Double EMA (DEMA), Triple EMA (TEMA), Least Squares Moving Average (LSMA), Triangular Moving Average (TMA), Kijun (from Ichimoku Kinko Hyo), and McGinley's Dynamic.
Baseline Length: Users can customize the length of the moving average, providing flexibility to adjust the sensitivity of the baseline to market movements.
Signal Line Generation: The indicator computes a dynamic signal line based on the relationship between the close price and the moving averages of the high and low prices. This signal line adapts to market volatility and trend changes.
2.SSL Baseline Integration
SSL Baseline: In addition to the primary baseline, the indicator incorporates an SSL (Semaphore Signal Level) Baseline, which further refines trend detection by considering the highs and lows over a specified period.
Dual Confirmation: The combination of the primary baseline and the SSL baseline enhances the reliability of the trend signals by requiring agreement between both baselines before generating a signal.
3.Momentum and Trend Filters
Relative Strength Index (RSI): The indicator uses the RSI to assess the momentum of price movements, filtering out signals that occur during overbought or oversold conditions.
Moving Average Convergence Divergence (MACD): The MACD is employed to identify the direction and strength of the trend, adding another layer of confirmation to the signals.
Average Directional Index (ADX): The ADX measures the strength of the trend, ensuring that signals are generated only when the market shows significant directional movement.
4.Volume Analysis
Volume Filter: An optional volume filter compares the current volume to its moving average, allowing traders to focus on signals that occur during periods of higher market activity.
5.Higher Timeframe Confirmation
Multi-Timeframe Analysis: The indicator can incorporate data from a higher timeframe, comparing the current price to the higher timeframe's baseline and signal line. This feature helps traders align their trades with the broader market trend.
6.Candlestick Pattern Recognition
Bullish Patterns: The indicator detects bullish patterns such as Bullish Engulfing, Piercing Line, Hammer, and Doji.
Bearish Patterns: It also identifies bearish patterns like Bearish Engulfing, Dark Cloud Cover, Shooting Star, and Doji.
Pattern Prioritization: The patterns are prioritized to highlight the most significant formations, which can serve as additional confirmation for trade entries and exits.
7.Price Action Zones
Support and Resistance Levels: The indicator automatically identifies pivot highs and lows to establish dynamic support and resistance levels.
Zone Visualization: It draws shaded rectangles on the chart to represent these zones, providing a clear visual aid for potential reversal or breakout areas.
ATR-Based Zone Width: The zones' thickness is dynamically calculated using the Average True Range (ATR), adjusting to the current market volatility.
Background Coloring: The chart background changes color when the price is above the maximum resistance or below the minimum support, alerting traders to significant price movements.
Interpreting the Signals
1.Buy Signals
Conditions:
Price crosses above the signal line.
RSI is below 70 (not overbought).
MACD line is above the signal line (indicating bullish momentum).
ADX is above the user-defined threshold (default is 20), confirming a strong trend.
(Optional) Volume is above its moving average if the volume filter is enabled.
(Optional) Price is above the higher timeframe baseline and signal line if the higher timeframe filter is enabled.
(Optional) A bullish candlestick pattern is detected if the candlestick pattern filter is enabled.
Visual Indicators:
An upward-pointing label with the text "BUY" appears below the price bar.
The baseline and SSL baseline lines turn to colors indicating bullish conditions.
2.Sell Signals
Conditions:
Price crosses below the signal line.
RSI is above 30 (not oversold).
MACD line is below the signal line (indicating bearish momentum).
ADX is above the user-defined threshold, confirming a strong trend.
(Optional) Volume is above its moving average if the volume filter is enabled.
(Optional) Price is below the higher timeframe baseline and signal line if the higher timeframe filter is enabled.
(Optional) A bearish candlestick pattern is detected if the candlestick pattern filter is enabled.
Visual Indicators:
A downward-pointing label with the text "SELL" appears above the price bar.
The baseline and SSL baseline lines turn to colors indicating bearish conditions.
3.Support and Resistance Zones
Interpretation:
Resistance Zones: Represent areas where the price may face selling pressure. A break above these zones can signal a strong bullish move.
Support Zones: Represent areas where the price may find buying interest. A break below these zones can signal a strong bearish move.
Background Color:
The background turns red when the price is above the maximum resistance, indicating potential overextension.
The background turns green when the price is below the minimum support, indicating potential undervaluation.
Effective Usage Strategies
1.Customization
Adjusting Baseline and SSL Settings: Traders should experiment with different moving average types and lengths to match their trading style and the specific characteristics of the asset being analyzed.
Filtering Parameters: Modify RSI, MACD, and ADX settings to fine-tune the sensitivity of the signals.
Volume and Higher Timeframe Filters: Enable these filters to add robustness to the signals, especially in volatile markets or when trading higher timeframes.
2.Combining with Other Analysis
Fundamental Analysis: Use the indicator in conjunction with fundamental insights to validate technical signals.
Risk Management: Always apply proper risk management techniques, such as setting stop-loss and take-profit levels based on the support and resistance zones provided by the indicator.
3.Backtesting
Historical Analysis: Utilize the indicator's settings to backtest trading strategies on historical data, helping to identify the most effective configurations before applying them in live trading.
4.Monitoring Market Conditions
Volatility Awareness: Pay attention to the ATR and ADX readings to understand market volatility and trend strength, adjusting strategies accordingly.
Event Considerations: Be cautious around major economic announcements or events that may impact market behavior beyond technical indications.
Indicator Inputs and Customization Options
Baseline Type and Length: Select from multiple moving average types and specify the period length.
ADX Settings: Adjust the length, smoothing, and threshold for trend strength confirmation.
Volume Filter: Enable or disable the volume confirmation filter.
Higher Timeframe Filter: Choose to incorporate higher timeframe analysis and specify the desired timeframe.
Candlestick Patterns: Enable or disable the detection of candlestick patterns for additional signal confirmation.
SSL Baseline Type and Length: Customize the SSL baseline settings separately from the primary baseline.
Price Action Zones Settings:
Zone Thickness: Adjust the visual thickness of the support and resistance zones.
Lookback Period: Define how far back the indicator looks for pivot points.
ATR Multiplier for Zone Width: Set the multiplier for ATR to determine the dynamic width of the zones.
Maximum Number of Zones: Limit the number of support and resistance zones displayed.
Pivot Bars: Customize the number of bars to the left and right used for identifying pivot highs and lows.
Conclusion
The "Mars Signals - Precision Trend Analyzer with SSL Baseline & Price Action Zones" is a versatile and powerful tool that amalgamates essential technical analysis techniques into a single, user-friendly indicator. By providing clear visual signals and incorporating multiple layers of confirmation, it assists traders in identifying high-probability trading opportunities. Whether you are a day trader, swing trader, or long-term investor, this indicator can be tailored to suit your trading style and enhance your decision-making process.
To maximize the benefits of this indicator:
Understand Each Component: Familiarize yourself with how each part of the indicator contributes to the overall signal generation.
Customize Thoughtfully: Adjust the settings based on the asset class, market conditions, and your risk tolerance.
Practice Diligently: Use demo accounts or paper trading to practice and refine your strategy before deploying it in live markets.
Stay Informed: Continuously educate yourself on technical analysis and market dynamics to make the most informed decisions.
Disclaimer
Trading financial markets involves risk, and past performance is not indicative of future results. This indicator is a tool to aid in analysis and should not be the sole basis for any trading decision. Always conduct your own research and consider consulting with a licensed financial advisor.

Fibonacci Retracements & Trend Following Strategy V2This Pine Script strategy generates trading signals using Fibonacci levels and trend-following indicators.
1. Strategy Summary
This strategy analyzes price movements using a combination of Fibonacci levels and trend-following indicators, providing potential trading signals. The strategy includes Fibonacci levels as well as EMA (Exponential Moving Average) and ADX (Average Directional Index) indicators.
2. Indicators and Parameters
Fibonacci Levels
Fibonacci Level 1, Level 2, Level 3, Level 4: Used as Fibonacci retracement levels. These levels are typically set at 0.236, 0.382, 0.618, and 0.786. Users can adjust these values according to their preferences.
Trend-Following Indicator
Trend Length: The period for calculating the EMA used as the trend-following indicator. For example, if set to 20, the EMA will be calculated over 20 periods.
ADX (Average Directional Index)
ADX Length: The period for calculating the ADX. ADX measures the strength of the price trend and is usually set to 14 periods.
ADX Threshold: A threshold value for the ADX. This value determines when trading signals will be activated.
3. Usage Steps
Displaying the Indicator on the Chart:
On the TradingView platform, paste the code into the Pine Editor and click the "Add to Chart" button to add it to the chart.
Analyzing the Indicators:
Fibonacci Levels: Show retracement levels of price movements. When the price reaches one of these levels, potential reversals may occur.
Trend-Following Indicator: EMAs determine the direction of the trend. Green EMA represents an uptrend, while red EMA represents a downtrend.
ADX: Measures the strength of the trend. When ADX surpasses the threshold value, it indicates a strong trend.
Trading Signals:
Long Signal: Generated when the price is above the second Fibonacci level and the trend is upward. Additionally, the ADX value must be above the set threshold.
Short Signal: Generated when the price is below the second Fibonacci level and the trend is downward. Additionally, the ADX value must be above the set threshold.
Target Prices:
Long Targets: Determines upward targets based on Fibonacci levels. These targets indicate expected prices if the price reverses from Fibonacci levels.
Short Targets: Determines downward targets based on Fibonacci levels. These targets indicate expected prices if the price reverses from Fibonacci levels.
4. Chart Displays
Trend Up (Green Line): Shows the rising EMA.
Trend Down (Red Line): Shows the falling EMA.
Fibonacci Levels (Blue Lines): Shows Fibonacci retracement levels.
Long Targets (Green Circles): Shows targets for long positions.
Short Targets (Red Circles): Shows targets for short positions.
Long Signal (Green Label): Buy signal.
Short Signal (Red Label): Sell signal.
5. Important Notes
Retracement and Target Levels: Fibonacci levels can act as potential retracement or support/resistance levels. However, they should always be used in conjunction with other technical analysis tools.
Trend and ADX: ADX is used to determine the strength of the trend. Be aware that when ADX is low, trends may be weak.
6. Example Scenarios
Example 1: If the trend is upward (green EMA) and the price is above the second Fibonacci level, you may receive a long position signal. If the ADX value is above the threshold, the signal may be stronger.
Example 2: If the trend is downward (red EMA) and the price is below the second Fibonacci level, you may receive a short position signal. If the ADX value is above the threshold, the signal may be stronger.
This updated version contains significant improvements in both technical aspects and user experience. Innovations such as ADX calculations and dynamic Fibonacci levels make the strategy more robust and flexible. The code's readability and comprehensibility have been enhanced, and errors have been corrected.
This guide will help you understand the basic operation of the strategy. It is always recommended to conduct your own research and test the strategy before using it.
GOOD LUCK. // halilvarol

Advanced ADX [CryptoSea]The Advanced ADX Analysis is a sophisticated tool designed to enhance market analysis through detailed ADX calculations. This tool is built for traders who seek to identify market trends, strength, and potential reversals with higher accuracy. By leveraging the Average Directional Index (ADX), Directional Indicator Plus (DI+), and Directional Indicator Minus (DI-), this indicator offers a comprehensive view of market dynamics.
New Overlay Feature: This script uses the new 'force overlay' feature which lets you plot on the chart as well as plotting in an oscillator pane at the same time.
force_overlay=true
Key Features
Comprehensive ADX Tracking: Tracks ADX values along with DI+ and DI- to provide a complete view of market trend strength and direction. The ADX measures the strength of the trend, while DI+ and DI- indicate the trend direction. This combined analysis helps traders identify strong and weak trends with precision.
Trend Duration Monitoring: Monitors the duration of strong and weak trends, offering insights into trend persistence and potential reversals. By keeping track of how long the ADX has been above or below a certain threshold, traders can gauge the sustainability of the current trend.
Customizable Alerts: Features multiple alert options for strong trends, weak trends, and DI crossovers, ensuring traders are notified of significant market events. These alerts can be tailored to notify traders when certain conditions are met, such as when the ADX crosses a threshold or when DI+ crosses DI-.
Adaptive Display Options: Includes customizable background color settings and extended statistics display for in-depth market analysis. Users can choose to highlight strong or weak trends on the chart background, making it easier to visualize market conditions at a glance.
In the example below, we have a bullish scenario play out where the DI+ has been above the DI- for 11 candles and our dashboard shows the average is 10.48 candles. With the ADX above its threshold this would be a bullish signal.
This ended up in a 20%+ move to the upside. The dashboard will help point out things to consider when looking to exit the position, the DI+ getting close to the max DI+ duration would be a sign that momentum is weakening and that price may cool off or even reverse.
How it Works
ADX Calculation: Computes the ADX, DI+, and DI- values using a user-defined period. The ADX is derived from the smoothed average of the absolute difference between DI+ and DI-. This calculation helps determine the strength of a trend without considering its direction.
Trend Duration Analysis: Tracks and calculates the duration of strong and weak trends, as well as DI+ and DI- durations. This analysis provides a detailed view of how long a trend has been in place, helping traders assess the reliability of the trend.
Alert System: Provides a robust alert system that triggers notifications for strong trends, weak trends, and DI crossovers. The alerts are based on specific conditions such as the duration of the trend or the crossover of directional indicators, ensuring traders are informed about critical market movements.
Visual Enhancements: Utilizes color gradients and background settings to visually represent trend strength and duration. This feature enhances the visual analysis of trends, making it easier for traders to identify significant market changes at a glance.
In the example below, we see the ADX weakening after we have just had a move up, if you are looking to get into this position you want to see the ADX growing with either the DI+ or DI- breaking their average durations.
As you can see below, although the ADX manages to move above the threshold, there are no DI+/- breaks which is shown by price moving sideways. Not something most traders would be interested in.
Application
Strategic Decision-Making: Assists traders in making informed decisions by providing detailed analysis of ADX movements and trend durations. By understanding the strength and direction of trends, traders can better time their entries and exits.
Trend Confirmation: Reinforces trading strategies by confirming potential reversals and trend strength through ADX and DI analysis. This confirmation helps traders validate their trading signals, reducing the risk of false signals.
Customized Analysis: Adapts to various trading styles with extensive input settings that control the display and sensitivity of trend data. Traders can customize the indicator to suit their specific needs, making it a versatile tool for different trading strategies.
The Advanced ADX Analysis by is an invaluable addition to a trader's toolkit, offering depth and precision in market trend analysis to navigate complex market conditions effectively. With its comprehensive tracking, alert system, and customizable display options, this indicator provides traders with the tools they need to stay ahead of the market.
