RedK_Directional Index / K xDMIHere's a modern take on the famous DMI/ADX. i first wrote this on another platform few years ago, so i'm happy to be able to share it on TradingView
quick refresher: what does DMI/ADX tell us:
------------------------------------------------------
in simple terms, at the core of this indicator, there are 3 main calculations / lines: the Plus Directional Index ( +DI ) which represents how much the bulls are able to push the high of a bar compared to previous one, the Minus Directional Index ( -DI ), showing how much the bears are able to push the low of a bar from previous one, then the Average Directional index ( ADX ) line, which creates an oscillator of the +DI and -DI to represent the strength of a trend -- usually the lines will be colored accordingly (bulls = green, bears = red, and any different color for the ADX )
Similar to my version of the RSI , we take a classic concept, then use the computing and visualization "super powers" available to us today, to extend and improve on what those masters created in the past. I guess they sort of expected us to do exactly that :)
this "extended" version of DMI/ADX provides couple of highly needed features (in my opinion) -- let's explore:
trying as much as possible to avoid jargon - pls forgive me if i failed in some places.
-------------------------------------------------------------------------------------------------
1 - the big change: the ability to visualize the ADX in a way that makes some more sense.
- the original calculation restricted the ADX to oscillate below zero - i'm sure they had a good reason to build it that way in the past - but to me, it becomes super hard to interpret what the ADX line means, especially when a negative trend (the bears) take over. by removing that restriction and allowing the ADX to oscillate up or down (and we're free to do that, so the indicator shows *us* what *we need* to see), we end up with an improved representation of the trend and the trend strength.
- also the original calculation applies a moving average (default 14 bars) of a moving average (another 14 of the Directional Indexes, which represent the strength of bulls vs bears) to calculate the ADX - that makes the ADX very "removed" from the base price values - i change that, and just smooth the initial +Di / -Di then calculate the ADX from there. again, this shows me the outcome of the (relatively) immediate moves.
2 - i use weighted average WMA () in all my averaging calculations .. i believe this type of average is the best to express the importance of recent days / bars vs the ones further in the past, compared to other averaging techniques
3 - ability to make the DMI volume-weighted .. but contrary to my RSI , this is not set by default.
4 - couple of options to view the unrestricted ADX (as an area or as histogram/columns .. which i call Vertical Bars) for improved visualization
other stuff:
5 - a "step" option for the ADX .. you can set the step option to an increment of, say 5 or 10. this is in case you prefer to see the trend more in "quality" terms - so the equivalent of weak, medium, strong, v. strong...etc -- since in reality, a number like 47.7683 doesn't really mean anything specific
6 - optional "strong trend" adjustable level
Settings & usage suggestion:
-----------------------------------
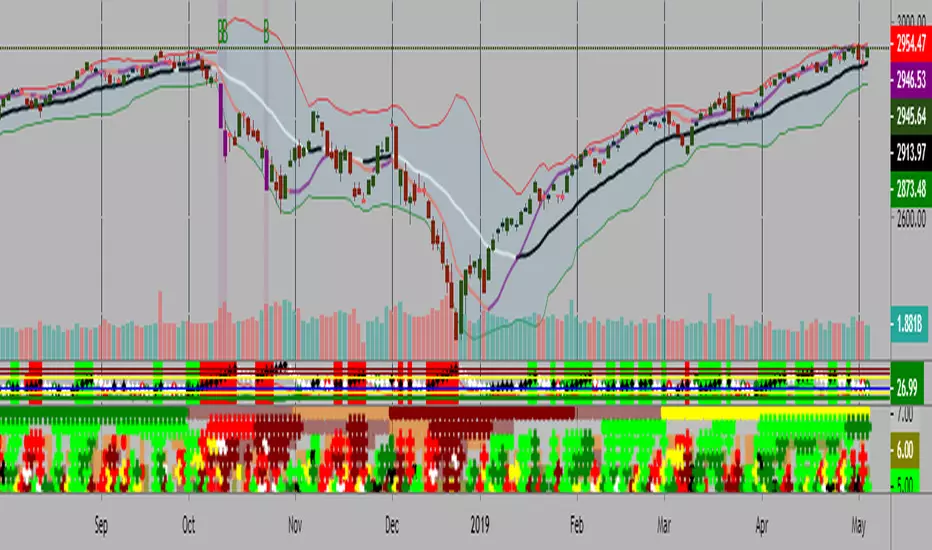
i prefer to use the defaults (length = 7, smoothing = 3, ..etc) -- i believe these are more suitable to the much faster trading that we have now. you can review the comparison chart and see if this works for you, and adjust as you need.
from a "signal" standpoint, you can use the xDMI as you use the classic DMI/ADX, bulls (or bears) are in control when the corresponding DI line crosses the other going up, *AND* moving above the "strong trend" level that you can set as an extra filter (usually a value between 20 to 30), while ADX will show the quality/strength of the trend.
i suggest you also utilize this indicator with other trend / momentum confirmation methods, and additional analysis and not in isolation - as well as inspecting the prevailing / longer time frame to ensure you're acting in the direction of the broader move / trend.
the above chart includes a side-by-side comparison between our new xDMI with the classic DMI/ADX using the same settings - then we add at the bottom panel also the xDMI, but with my default (faster) settings and showing other visualization options that can be utilized - the Moving Averages on the top / price panel is just to help put the price movement into perspective in terms of trend and trend strength.
The code is open and commented - please feel free to use, share, comment & provide feedback. if you're a DMI fan, and you find this useful in your trading, i would be more than happy to hear about it
Good luck!
ADX

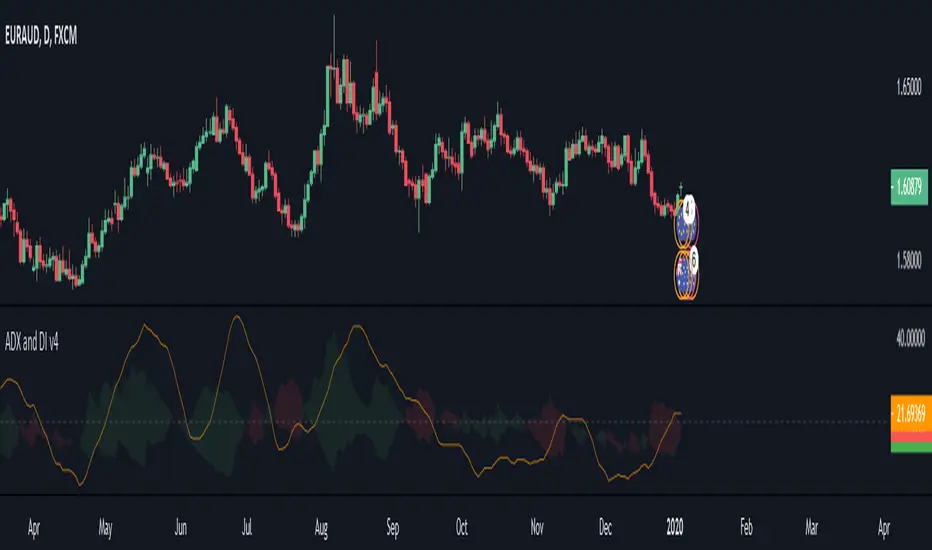
[PX] ADX and DI v4Hey guys,
I recently used the "ADX and DI" indicator in a variety of my own scripts. Because I keep on developing version 4 scripts and the "ADX and DI" indicator is developed in one of the previous PineScript versions, I had to update the old script every time I wanted to use it. I decided to publish the updated version and also changed a few things:
- ADX color is now orange
- Instead of plotting the DI+ and DI- lines, it's filling the space between the two (can be changed in the "style"-section)
Maybe some of you find it useful. If so, leave a like or follow :)
Happy trading,
paaax
P.S: The original indicator was developed by the user @MasaNakamura. Thanks for your great work!

$ SuPeR-RePaNoCHa $ [Alerts]Script for automatic trading (Alerts). This is the second part of the previous RePanoCHa script but with Take Profit.
It Use 6 indicators + volume:
-JURIK MOVING AVERAGE
-RANGE FILTER (DONOVAN WALL)
-ADX (ORIGINAL VERSION)
-PARABOLIC SAR
-RSI + VOLUME WEIGHTED (LAZYBEAR)
-MACD
-VOLUME
To close the position you can choose between Take Profit only, Trailing Stop only or both at the same time.
Example of bot syntax: (alerts once per bar)
LONG | e=BINANCEFUTURES a=ACCOUNT s=BTCUSDT c=order | delay=1 | e=BINANCEFUTURES a=ACCOUNT s=BTCUSDT c=position b=short t=market ro=1 | delay=1 | e=BINANCEFUTURES a=ACCOUNT s=BTCUSDT b=long q=100% t=market | delay=1 | e=BINANCEFUTURES a=ACCOUNT s=BTCUSDT c=position b=long p=0.7% q=50% t=post ro=1
SHORT | e=BINANCEFUTURES a=ACCOUNT s=BTCUSDT c=order | delay=1 | e=BINANCEFUTURES a=ACCOUNT s=BTCUSDT c=position b=long t=market ro=1 | delay=1 | e=BINANCEFUTURES a=ACCOUNT s=BTCUSDT b=short q=100% t=market | delay=1 | e=BINANCEFUTURES a=ACCOUNT s=BTCUSDT c=position b=short p=-0.7% q=50% t=post ro=1
LONG TP | e=BINANCEFUTURES a=ACCOUNT s=BTCUSDT c=position q=50% t=market ro=1 (if you set the TP from entry this alert is not necessary)
SHORT TP | e=BINANCEFUTURES a=ACCOUNT s=BTCUSDT c=position q=50% t=market ro=1 (if you set the TP from entry this alert is not necessary)
LONG TS | e=BINANCEFUTURES a=ACCOUNT s=BTCUSDT c=position q=10% t=market // (alerts once per minute)
SHORT TS | e=BINANCEFUTURES a=ACCOUNT s=BTCUSDT c=position q=10% t=market // (alerts once per minute)
XLONG/STOP-LOSS | e=BINANCEFUTURES a=ACCOUNT s=BTCUSDT c=order | delay=1 | e=BINANCEFUTURES a=ACCOUNT s=BTCUSDT c=position b=long t=market ro=1
XSHORT/STOP-LOSS | e=BINANCEFUTURES a=ACCOUNT s=BTCUSDT c=order | delay=1 | e=BINANCEFUTURES a=ACCOUNT s=BTCUSDT c=position b=short t=market ro=1

(JS)DMI BarsAlright - so this is my own version of John Carter's "10x Bars"... I have done multiple things that are different from his version so they are slightly different..
So first of all the main indicator is based off of the ADX and the DMI;
For those who aren't familiar with it, Directional Movement is what you'd pull up under "built-in's" from the indicators tab (if you want to check it out).
The standard interpretation of this however, is when the ADX is above 20 that suggests the trend is strong, whereas under 20 suggests it is weak.
Also, when the D+ is above the D- that suggests a bullish trend, and D- above D+ suggests a bearish trend.
These bars take away the need to have it at the bottom of your screen, and places the data on the bars on your chart instead.
=========================================================================================================================================
So here's what the colors stand for -
Yellow - The ADX is under 20, no strength in trend
Shades of green occur when the ADX is above 20 and there's a bullish trend (D+ higher than D-)
Bright Green (Lime) - Bullish trend, D+ above 30
Green - Bullish Trend
Yellow Green - Bullish trend, D+ below 15
Shades of red occur when the ADX is above 20 and there's a bearish trend (D- higher than D+)
Bright Red - Bearish trend, D- above 30
Red - Bearish Trend
Orange - Bearish trend, D- below 15
=========================================================================================================================================
I have also added multiple time frame labels (label script used is the one created by Ricardo Santos)
These labels are color coded the same as the bars/candles, and they appear off to the right of your screen using every built in time increment from TradingView.
The purpose is to show you in real time, and on any chart resolution, what the current trend is on every individual time frame.
So using just one single chart you'll see your current resolutions candles, but also on the labels you'll see:
1 Minute
3 Minute
5 Minute
15 Minute
30 Minute
45 Minute
1 Hour
2 Hour
3 Hour
4 Hour
Daily
Weekly
Monthly
There is an input I added that allows you to adjust where your labels appear on the side of your screen as well!
=========================================================================================================================================
Now onto the volume spike portion of the indicator. This will plot a blue dot under each bar that has a spike in volume which meets your specified criteria.
I have 500% as the default setting.
What that means is that this indicator looks back and gets the 50 bar volume average and then applies dots where volume is 500% above average.
=========================================================================================================================================
Now finally, the reversal arrows. This is another simple to understand concept that I first read in John Carter's book "Mastering the Trade" that he calls "HOLP/LOHP".
I have added the ability to change the look back period you'd like the indicator to watch for highs and lows on.
What that stands for is 'High of Low Period' and 'Low of High Period', and it is used like this-
Whenever a bar makes a new high the indicator watches the low on that highest bar. Then when a bar afterwards makes a lower low then the one on the high bar,
a reversal arrow is given. Apply this same concept in the other direction in for the highs on the lowest bars.
=========================================================================================================================================
Now, I didn't want to make a "set" or have a bunch of different indicators out there that are all intended for the same package, so I took the time to put them together,
and if there's a part of it you don't care for they can easily be turned off in the settings.
Enjoy!

Stochastic RSI 3in1 & Volatility peaks + ADX by AGUDescription:
3 Lines are Stochastic RSI's, strongest move is when all crosses and moves to one direction (from top or bottom).
Orange is original Stochastic of the timeline. (Live movement of price).
Green is original Stoch x 6. (Short term movement).
Red is original Stoch x27 (Long term price movement).
Transparent columns are ADX signal.
Higher the mountain, stronger the signal. When the mountain tops, trend usually change.
And finally the volatility peaks. Green peak HIGHEST volatility , RED peak LOWEST volatility .
I use it on 1 min BTC chart. But it works on all.
TIPS >> 3HCQ41cRpxcq2MJdRUSYoq9N1RnEy98xD2

Directional Movement Index with double exponential moving averagThe Directional system is a trend-following method developed by J. Welles Wilder,
in the mid-1970s. It identifies trends and shows
when a trend is moving fast enough to make it worth following. It helps traders to
profit by taking chunks out of the middle of important trends.
Trading Rules
1. Trade only from the long side when the positive Directional line is above the
negative one. Trade only from the short side when the negative Directional line
is above the positive one. The best time to trade is when the ADX is rising, show-
ing that the dominant group is getting stronger.
2. When ADX declines, it shows that the market is becoming less directional. There
are likely to be many whipsaws. When ADX points down, it is better not to use
a trend-following method.
3. When ADX falls below both Directional lines, it identifies a flat, sleepy mar-
ket. Do not use a trend-following system but get ready to trade, because major
trends emerge from such lulls.
4. The single best signal of the Directional system comes after ADX falls below
both Directional lines. The longer it stays there, the stronger the base for the
next move. When ADX rallies from below both Directional lines, it shows that
the market is waking up from a lull. When ADX rises by four steps
from its lowest point below both Directional lines, it “rings a bell” on a
new trend . It shows that a new bull market or bear market is being
born, depending on what Directional line is on top.
5. When ADX rallies above both Directional lines, it identifies an overheated mar-
ket. When ADX turns down from above both Directional lines, it shows that the
major trend has stumbled. It is a good time to take profits on a directional trade.
If you trade large positions, you definitely want to take partial profits.
This particular version uses DEMA (double exponential moving averages) in attempt to catch moves sooner.
ADX Di+ Di- [Gu5]Fill indicates Strong Trend
Cross indicates End of Trend
--
El relleno indica una fuerte tendencia cuando el Di supera "Level Trend"
El cruce de Di+ con Di- indica el fin de la tendencia
Cuando el valor del ADX es menor a "Level Range", estamos en Rango

🐮 🆚 🐻 [Alerts]It's a remake of the previous script but for use in reverse positions at the same time.
In this script the reality could be even better than the Backtest, because, only close the position with profit, so profitability should be 100%, and Longs and Shorts don't mix because they are independent.
In real trade, you need an exchange that allows you to go in reverse positions at the same time or where you can have two independent sub-accounts: one for long and one for short and with margin trading. Although, if TP is small and does not mix with other inverse positions, it's not necessary. (With this script, you can go long and short at the same time and with independent configurations)
Settings for ETH at 5 minutes. (If you find good settings please comment)
Enjoy!

BO ADX Binary Option strategy based on ADX/DI cross, Put or Call at the beginning of the next candle, expire 5m for 5m candle.


ADX Free-The line control represents, if the ADX is greater than the line of 20, the price trend is considered strong, some people increase it to 25
-Dynamic adx color to better differentiate movements

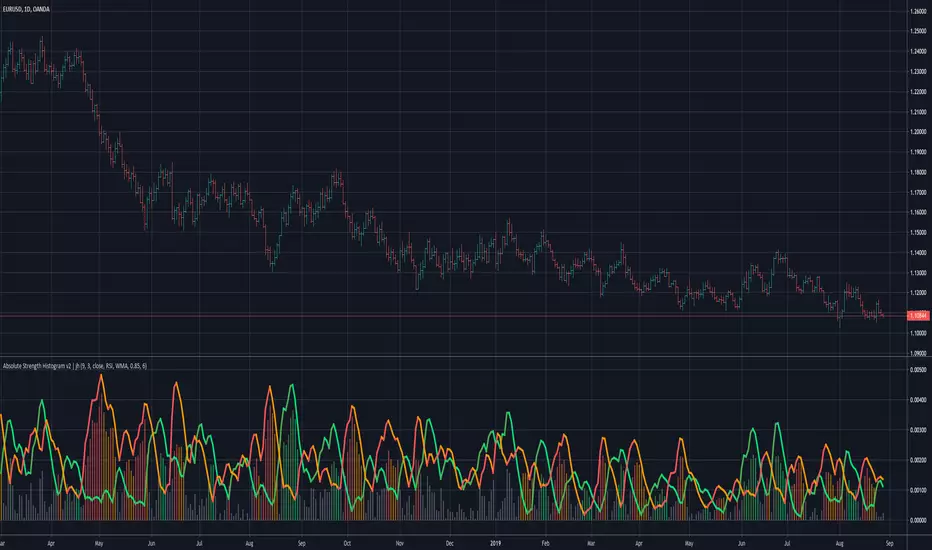
Absolute Strength Histogram v2 | jhv2 changes the way the histogram is plotted.
Histogram shows the strength and can be used to identify trending or ranging periods.

Absolute Strength Histogram | jhOriginal ASH code from alexgrover
Some changes:
- Change the price to SMA with Period of 1 with reference to the original MT4 code
- Added a few more MAs

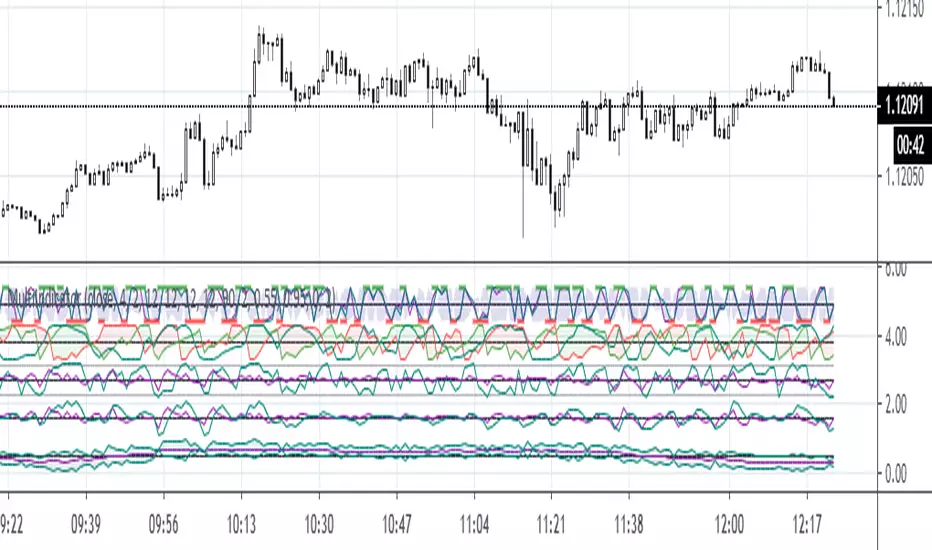
MultiIndicatorThis is just a bunch of useful funtions and
a recommenation how to construct a multiindicator for the sake of economy :))
RePaNoCHa V4 [Alerts]Script for automatic trading with Alerts.
LG --> Long (green: not confirmed) (lime: confirmed)
ST --> Short (maroon: not confirmed) (red: confirmed)
TS --> Trailing Stop
xL --> Close Long Position
xS --> Close Short Position
SL --> Stop Loss
The trailing stop closes the trade if the price changes direction by a specified percentage or offset. There is no ideal distance because markets and price are always changing and we know that is impossible to exit on the top or bottom. This script interpolate the trailing Stop Offset with profit, higher profit --> higher Trailing Stop Offset. Despite this, it's difficult to catch the price but not impossible. It has a TS delay too. It take a snapshot every X seconds, if the TS is activated the alert is triggered, otherwise the price keeps fluctuating until a new snapshot.
It can be easily converted to Backtest. Just delete "//" on the corresponding part.
Default settings for XBT:USD at 1H.

ONLY LONG V4 [Alerts]Let's try the Version 4 ...
This script is only for long positions.
It's based on the conjunction of RMI + ADX + RSI for entries and only with Take Profit to close the position.
It doesn't have security (), nor Heikin Ashi, so the Backtest is Real.
Use always 'Once per bar'.
It doesn't repaint absolutely nothing at all.
Timeframe: 15 minutes
Have fun improving it ...
Enjoy!
Tips ...
BTC: 3LEUP3WjQctdbFjBavcmRGUVRBje8bptCd
ETH: 0x518AAD4746912ae506c82B747488306186c4d546

ADX and DI With Coloured Histogram BUY/SELLWe display here the ADX has a colored histogram, which is
- green when ADX and DI+ are higher then DI-, while the ADX is increasing, meaning that we are in a potential uptrend--> we should rather be long (only buy if you have other concordant signals !)
- red when ADX and DI- are higher then DI+, while the ADX is increasing, meaning that we are in a potential downtrend --> we should rather be short (only sell if you have other concordant signals !)
- not visible if none of these conditions are met, meaning that the indicator do not show a potential trend --> don't use this indicator to buy or sell at this stage

Kal’s MTF ADX Rangoli RollerKaly MTF ADX Rangoli Roller is a method/study for finding trending stocks, indexes and cryptocurrencies using two different data periods (10, 5) of ADX Overlap over different time-frames (10m, 1H, 4H, 1D, 1W, 1M). In the study, I used 5-Period ADX for all mentioned time-frames. You may use 10-Period ADX for lower time-frames especially 10m and 1H.
Sample Image of the pinescript code(at the end of this post) in Tradingview looks as follows:
Note: Kal's MTF ADX Rangoli Roller is the lower Plot. The upper plot is KAL’s ADX Overlap Technical Study with MACD Filter( )
Description:
----------------
In the study plot, the lowest row is 10m, row above is 1H, row above is 4H, then 1D, then 1W and highest row is 1M
Lime(Bright Green) dot implies Trending Uptrend for that time-frame (first phase)
Green dot implies Trending Uptrend for that time-frame (second phase near exhaustion)
Red dot implies Trending Downward for that time-frame (first phase)
Maroon dot implies Trending Downward for that time-frame (second phase near exhaustion)
Lime cross implies Strong Trending Uptrend for that time-frame (first phase)
Green cross implies Strong Trending Uptrend for that time-frame (second phase near exhaustion)
Red cross implies Trending Strong Downward for that time-frame (first phase)
Maroon cross implies Trending Strong Downward for that time-frame (second phase near exhaustion)
Yellow is ‘Squeeze On’ setting. During the squeeze period, the ADX signals are almost always ineffective. One may wait and watch over during this time. Once the Squeeze is released (i.e. no longer yellow), the trend corresponds to the color of the dots and crosses.
Black is CRSI Overbought condition for that time-frame. It’s best to wait and research for possibility of trend reversal because
1. Profit-booking/trimming happens after CRSI Overbought condition.
2. Large Short-sellers may take huge positions during this time pushing the stock prices up.
White is CRSI Oversold condition for that time-frame. It’s best to wait and research for possibility of trend reversal because
1. Profit-booking/trimming happens after CRSI Oversold conditions.
2. Large buyers may take huge positions during this time pushing the stock prices down.
I am a disabled man. Therefore, I am not able to write in detail here today. More Details will follow as time permits. Please let me know if I am missing anything…
Legal Disclaimer: I published here so I get replies from fellow viewers to educate myself and for my daily expenses. Hence, if anyone uses this script for making their decisions, I am not responsible for any failures incurred.
Safe Trading!
Kal Gandikota
PS: If you found this script interesting and edifying please follow and upvote.
PS2: Please kindly donate for my daily expenses (atleast as you would on streets) at the following addresses:
BTC Wallet: 1NeDC1GvpFa49DFLuT1v28ohFjqtoWXNQ5
ETH Wallet: 0x35e557F39A998e7d35dD27c6720C3553e1c65053
NEO Wallet: AUdiNJDW7boeUyYYNhX86p2T8eWwuELSGr
PS3: For more information on ADX and CRSI, please 'Google' or search here yourself.
PS4: This study is intended for research in creating automated Python Trading Systems using Pandas( steemit.com ).
Screenshots of the pinescript code looks as follows:
10minute Screenshot of Kal's MTF ADX Rangoli Roller (Above)
1 Hour Screenshot of Kal's MTF ADX Rangoli Roller (Above)
4 Hour Screenshot of Kal's MTF ADX Rangoli Roller (Above)
1 Day Screenshot of Kal's MTF ADX Rangoli Roller (Above)
1 Week Screenshot of Kal's MTF ADX Rangoli Roller (Above)
1 Month Screenshot of Kal's MTF ADX Rangoli Roller (Above)
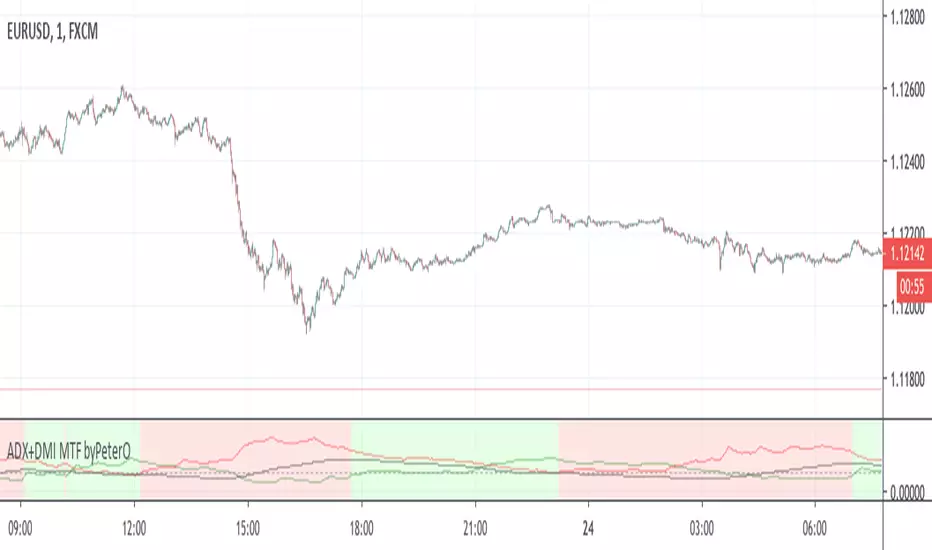
ADX+DMI MTF byPeterOThe goal of this study was to use ADX from Higher Timeframe - to determine trend direction
Why? Because ADX is very sensitive, able to show trend ending without any delay, but not in the middle of it.
Being able to see such immediate trend change on higher timeframe, is a great indicator of trend direction.
Adding just security() calls to 'highest', 'lowest' and 'close' didn't seem right, because it produced some ugly ADX, D+ and D- plotlines.
I wanted to see plotlines, which look exactly like those on actual higher timeframe. Therefore I modified the calculations.
You can read more about my take on (not) using security() calls in my other source code indicator RSI MTF: link in comments.
On top of all that, I added interpretation of DMI readings, because it is not as simple as plus>minus + ADXrising = uptrend.
So GREEN background means higher timeframe uptrend and RED background means downtrend.
ADX-DI Multi-TimeframePlots the multiple time frame version of the classic ADX-DI indicoator.
ADX
DI+ and DI-
ADX Threshold
DI Histogram difference with 2 threshold lookback values
For a similar multiple time frame indicator see the following scripts. They both use the historical + projection approach to yield non-repainting indicators.
Fisher Transform Multi-Timeframe
Laguerre RSI Multi-Timeframe
