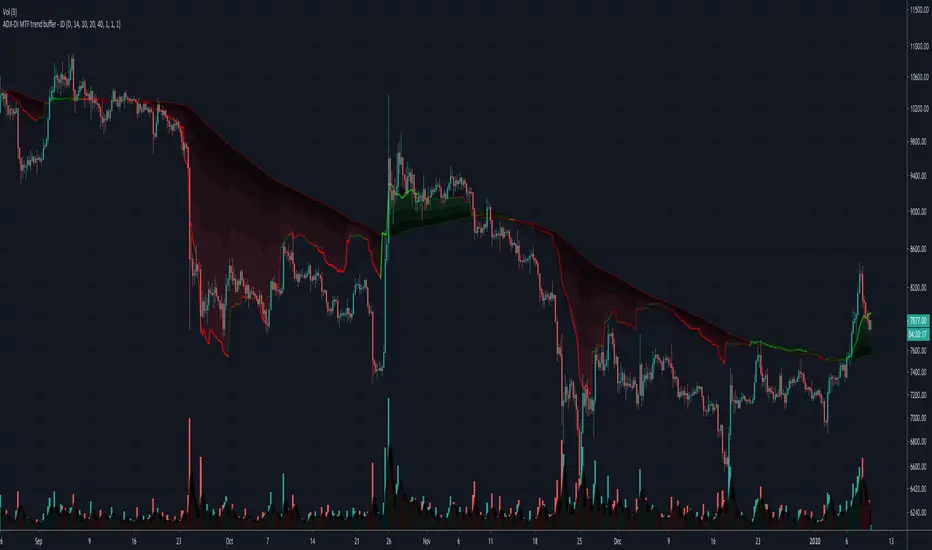
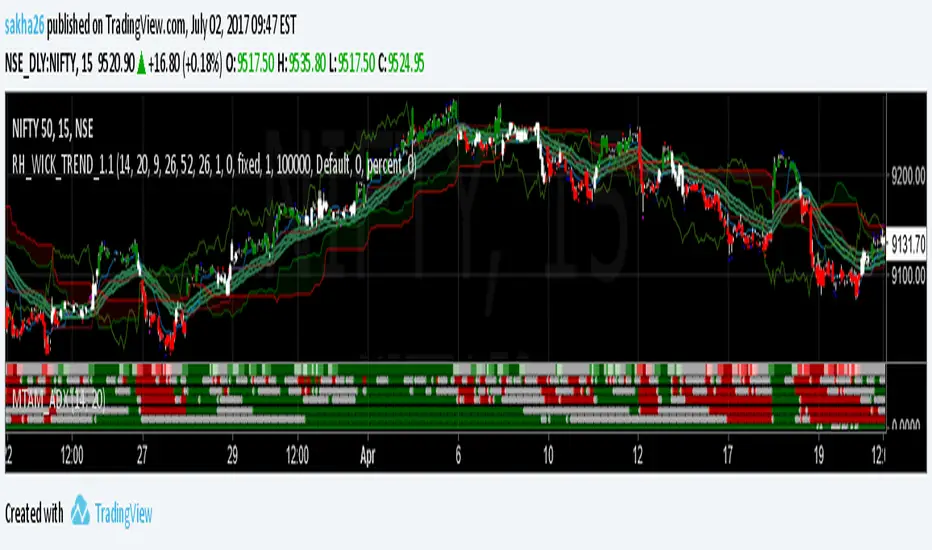
ADX-DI MTF trend buffer - JDThe indicator gives a multiplication of ADX and the DI+ and DI-values, color coded for bullish or bearish momentum
the indicator was optimised for use with HA-candles, but works with regular candles as well
and shows general market direction en divergence in a simpler visual way than the normal ADX-DI lines
a threshold mask can be shown or omitted as preferred
version 3. the indicator is now plotted relative to the 200 ema and can be seen as a "buffer" against price reversal
The timeframe of the indicator can be the current one or custom selected but gives better visual information if a longer timeframe than the current one is used.
The colors can be changed to fit with "Dark mode" or "Light mode"
a scaling option is available to downscale the trend indication relative to the price bars
JD
ADX
Average Directional Index with DI SpreadThis indicator converts conventional triple lined ADX, DI+ and DI- into two lines. First line is the
original ADX line and second line is obtained by subtracting DI- from DI+ which named DI Spread(DIS)
If ADX is greater than 20 there is a trend and if greater than 40 there is a strong trend but ADX does not tell
the trend direction
To determine trend direction, DIS can be used with ADX; Sımply; If DIS is greater than 0, it is an uptrend and If DIS
is less than 0, it is a downtrend.
To sum up;
If ADX is greater than 20 and especially greater than 40 with positive DIS value, this implies an uptrend.
If ADX is greater than 20 and especially greater than 40 with negative DIS value, this implies a downtrend.
*Because of coloration and reference levels used, this indicator is really simple and efficient to analyze trend direction.

ADX-DI MTF trend indication - JD version 2Version 2 added support for MTF, to see the trend direction on the lower or higher timeframe.
As an example to see the difference, the indicator is added three times, one time for the current TF, one set at the higher and one at the lower TF.
Cudo's to Chris Moody for the MTF-switching-code!!
JD.

ADX-DI trend indication - JDThis indicator is based on the formulas in the original "ADX and DI" script of Masa Nakamuro
The indicator gives a multiplication of ADX and the DI+ and DI-values, color coded for bullish or bearish momentum.
The indicator was optimised for use with HA-candles, but works with regular candles as well and shows general market direction en divergence in a simpler visual way than the normal ADX-DI lines.
A threshold mask and the actual DI-lines kan be shown or omitted as preferred
JD.

ADX-DI trend indication - JDThis indicator is based on the formulas in the original "ADX and DI" script of Masa Nakamuro
The indicator gives a multiplication of ADX and the DI+ and DI- values, color coded for bullish or bearish momentum.
The indicator was optimised for use with HA-candles, but works with regular candles as well and shows general market direction en divergence in a simpler visual way than the normal ADX-DI lines.
A threshold mask and the actual DI-lines kan be shown or omitted as preferred
JD.

ADX and DI (Average Directional Index) - CORRECT FORMULASo... the popular version of "ADX and DI" shown on tradingview by masanakamura uses some wacky and incorrect formula for DI and uses SMA instead of the Wilder's MA that ADX/DI is supposed to use, and doesn't give the correct ADX and DI values. The Tradingview "Average Directional Index" uses the correct calculation but doesn't show DI+ and DI-. So, here it is with the DI+ and DI- visible. Enjoy!

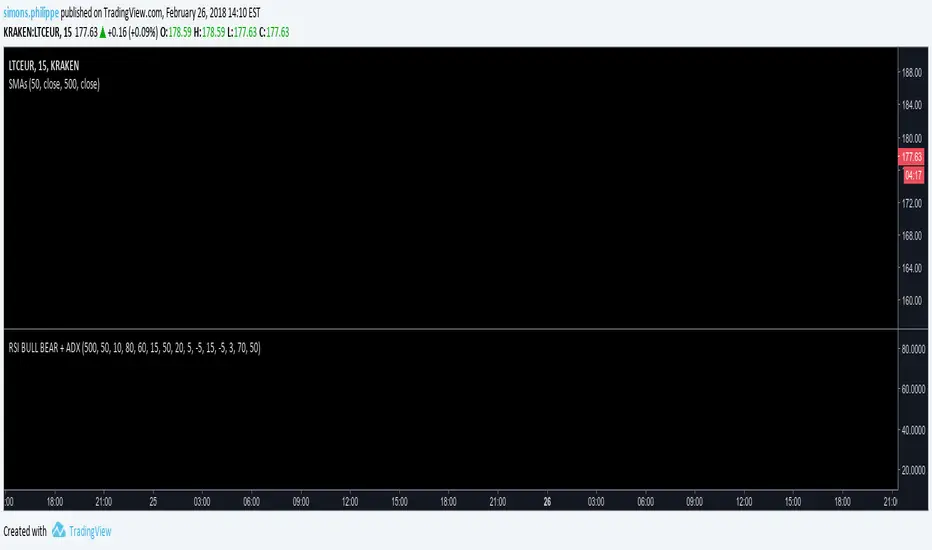
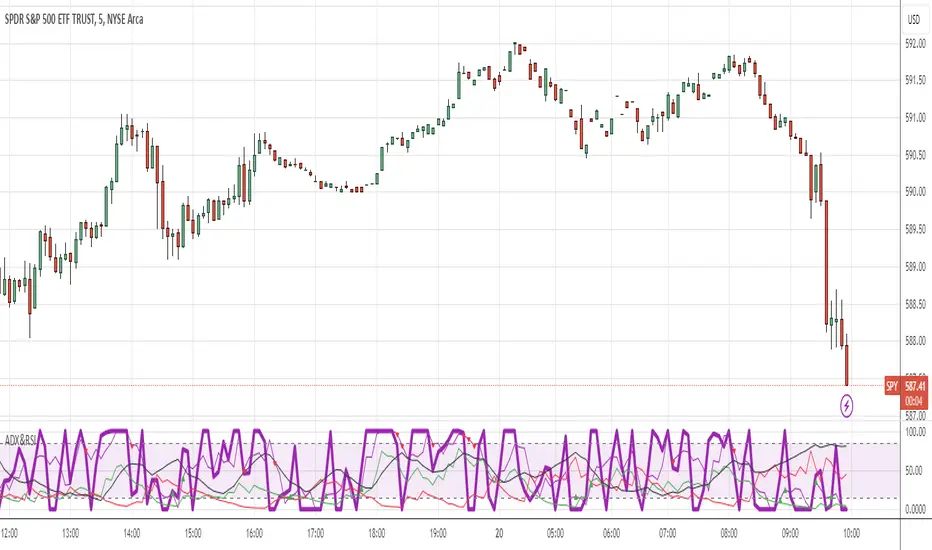
RSI BULL BEAR + ADXlong-signal when crossig the lower threshold
short-signal when crossing the upper threshold
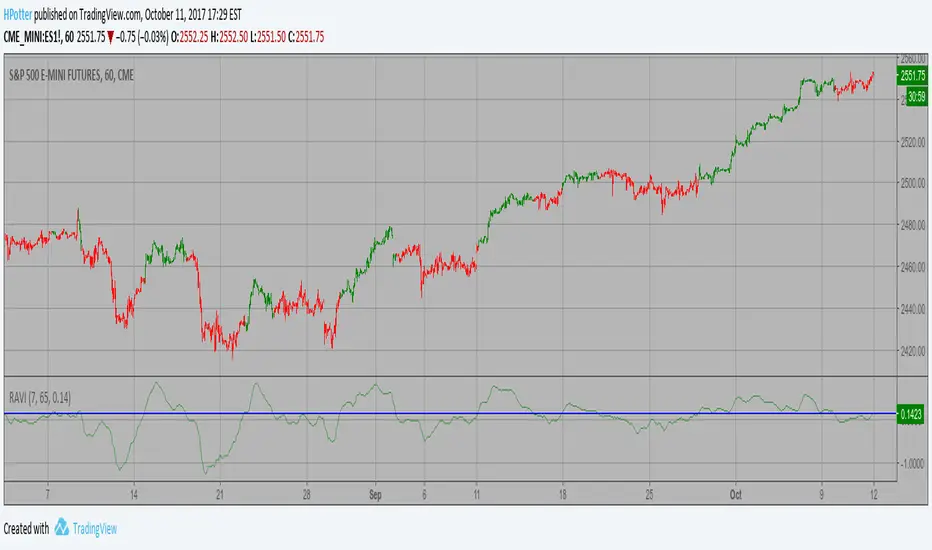
Range Action Verification Index (RAVI) Strategy The indicator represents the relative convergence/divergence of the moving
averages of the financial asset, increased a hundred times. It is based on
a different principle than the ADX. Chande suggests a 13-week SMA as the
basis for the indicator. It represents the quarterly (3 months = 65 working days)
sentiments of the market participants concerning prices. The short moving average
comprises 10% of the one and is rounded to seven.
WARNING:
- This script to change bars colors.
ADX and RSI ComboThis indicator combines two separate Simple RSI indicators so you can show different periods together, as well as an ADX indicator with DI+ and DI-. I prefer to use one indicator to show the whole thing, instead of stacking the individual indicators.
[naoligo] Simple ADXI'm publishing this indicator just for study purposes, because the result is exactly the same as DMI without the smoothing factor. It is exactly the same as ADX Wilder from MT5.
I was looking for the algorithm all over and it was a pain to find the right formula, meaning: one that would match with the built-in ones. After several study and comparison, I still didn't find the algorithm that match with the MT5's built-in simple ADX ...
Enjoy!

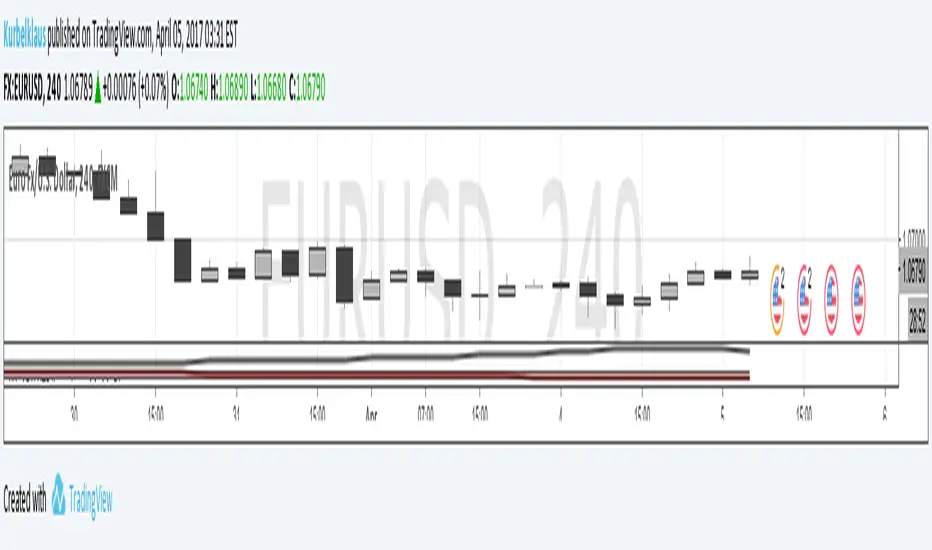
KK_Average Directional Index (ADX) Higher TFHey guys,
sometimes you just want to plot an Indicator value from a higher Timeframe on your Chart. For most Indicators this is pretty straightforward however there is one Indicator that has been giving me quite a headache while trying to do this: The Average Directional Index . Anyway after going through almost 200 versions of this script I finally found a solution that works and thought I would share this with you, since I'm sure some of you have encountered the same problem.
How it works
Go to your desired Instrument/Timeframe and add the Script
Under Settings in the field for "Higher ADX TF" put the Timeframe-code you want to pull the ADX Values from.
- Codes: Monthly - M, Weekly W, Daily - D
- Codes Intraday: The amount of hours in minutes, e.g. if you want to pull values from the 4h-Chart the code is 240 (60 for 1h, 15 for 15m ...)
In some cases (see below) the calculation might not be correct. So make sure the values are correct:
a) Write down the latest ADX of the higher TF while you are on the lower TF
b) Switch the Resolution to the higher TF
c) Compare the value you have just written down to the next to last value. They should be the same.
d) Switch back the Resolution to the lower TF and you're good to go.
Limitations
You can only pull values from higher Timeframes, e.g. you're on a 4h Chart, so you can only pull values from the Daily, Weekly and Monthly Chart. You can't pull values from the 1h Chart.
You can only pull values from Timeframes, where the higher Timeframe Close always has a corresponding Close on the lower Timeframe, e.g. you can't pull values from the 3h Chart when you are on a 2h Chart. This should be pretty rare.
The Script needs a certain amount of Data from the Higher TF before the calculated values are correct. I have tested this on several Instruments and the Script usually needs approximately 100 Bars on the higher Timeframe (often less) for the values to be correct (error < 1%).
So when the difference between your lower Timeframe and you higher Timeframe is large, e.g. you want to pull the Daily ADX value on a 15m-Chart, the calculation can be wrong. This can lead to errors in 2 Cases:
a) Backtesting: When you go over old data and get close to the last available Bar the Data will be wrong. This will limit the amount of data you can backtest.
b) Live values: When the difference between the two Timeframes is too large, it is possible that even live values are wrong, e.g. this will be the case when you are trying to pull the Daily ADX value on a 5 minute Chart. Always check if the calculation works with your desired combination of Timeframes before using it (see above).
I hope this is useful for you and whish all of you successful trading!
Best regards
Kurbelklaus
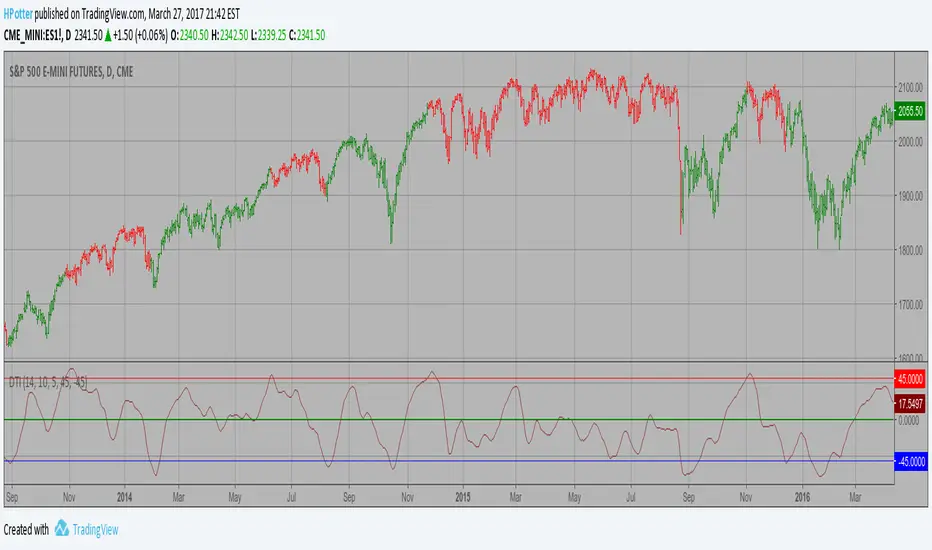
Directional Trend Index (DTI) Strategy This technique was described by William Blau in his book "Momentum,
Direction and Divergence" (1995). His book focuses on three key aspects
of trading: momentum, direction and divergence. Blau, who was an electrical
engineer before becoming a trader, thoroughly examines the relationship between
price and momentum in step-by-step examples. From this grounding, he then looks
at the deficiencies in other oscillators and introduces some innovative techniques,
including a fresh twist on Stochastics. On directional issues, he analyzes the
intricacies of ADX and offers a unique approach to help define trending and
non-trending periods.
Directional Trend Index is an indicator similar to DM+ developed by Welles Wilder.
The DM+ (a part of Directional Movement System which includes both DM+ and
DM- indicators) indicator helps determine if a security is "trending." William
Blau added to it a zeroline, relative to which the indicator is deemed positive or
negative. A stable uptrend is a period when the DTI value is positive and rising, a
downtrend when it is negative and falling.
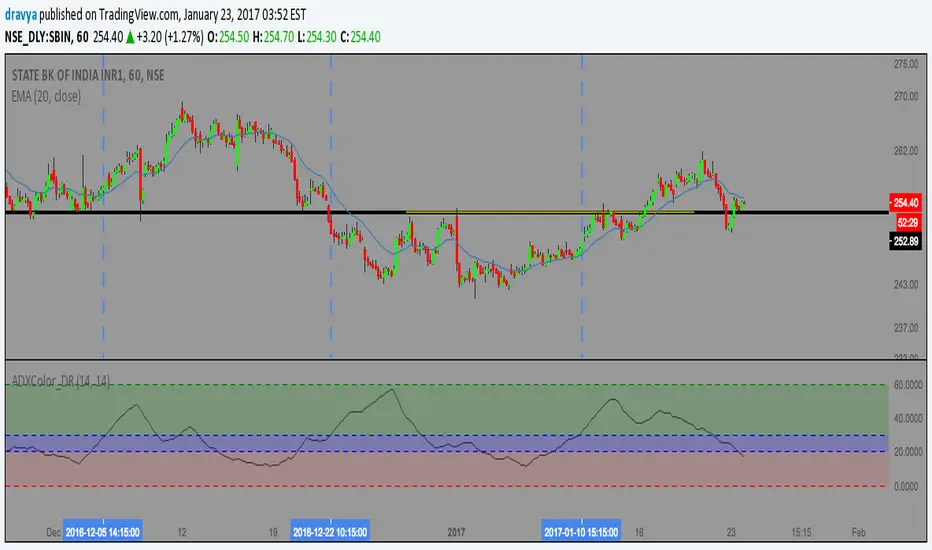
ADX Color Easy [Dravya]Script #1
So,
here is my first script.
This is the normal 14 period ADX,
but with a color twist, to make it extremely easy on eyes.
and then,
easily spot the strength.
ADX, as you know, shows the strength of the trend.
As short term traders, we need price movement and a strong trend.
How to use this script ?
1. We don't trade when ADX is in the red zone (0-20)
2. We get ready for trading when it enters the blue zone (20-30)
3. We trade when the ADX enters the green zone (>30)
Simple, right !
Now, in the green zone,
in which direction you should trade?
Here are a few links, to help you use ADX as a strategy ,
www.tradingsetupsreview.com
www.babypips.com
Other than this, you can combine this with your own strategies.
Personally, I like to use it on stocks on 1H timeframe.
Thanks.
Would love to hear from you.
Please like it to support the project,
and help spread it.

Directional Movement Index 4 colors (DMI 4c)It is a normal Directional Movement Index, but instead of using lines for +DI and -DI it uses histogram and 4 colors. It also contains an horizontal line (default value @20) to indicate when a trend is confirmed or not.

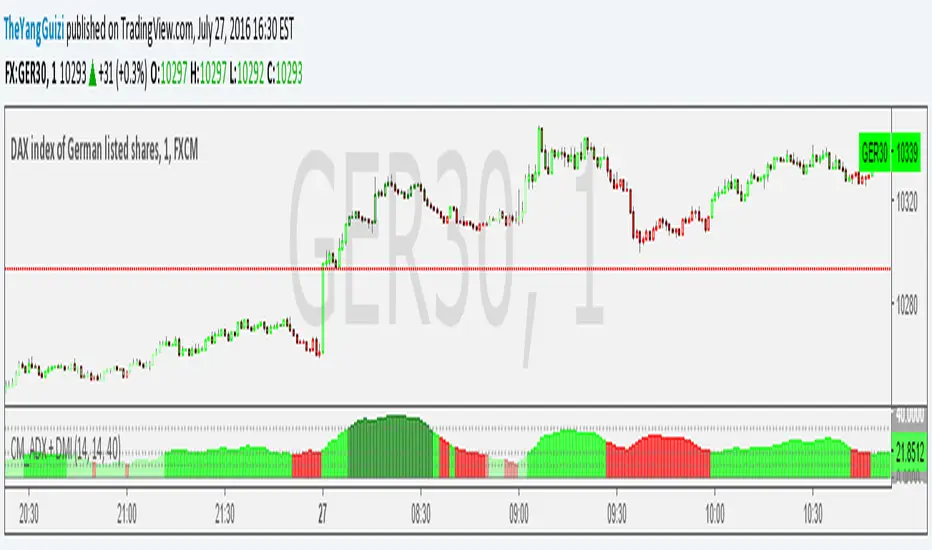
CM_ADX+DMI ModMashed together Chris Moody's ADX thing with his DMI thing.
So you can see trend strength + direction
green-ish = uptrend-ish//red-ish = downtrend-ish
Colors can be adjusted though.
below 10 = gray, not much going on
10 - 20 = light green/light red, could be the beginning o something
20 - 40 = bright green / bright red, something is going on
above 40 = dark green, dark red, exhaustion (default is 40, can be adjusted to whatever)
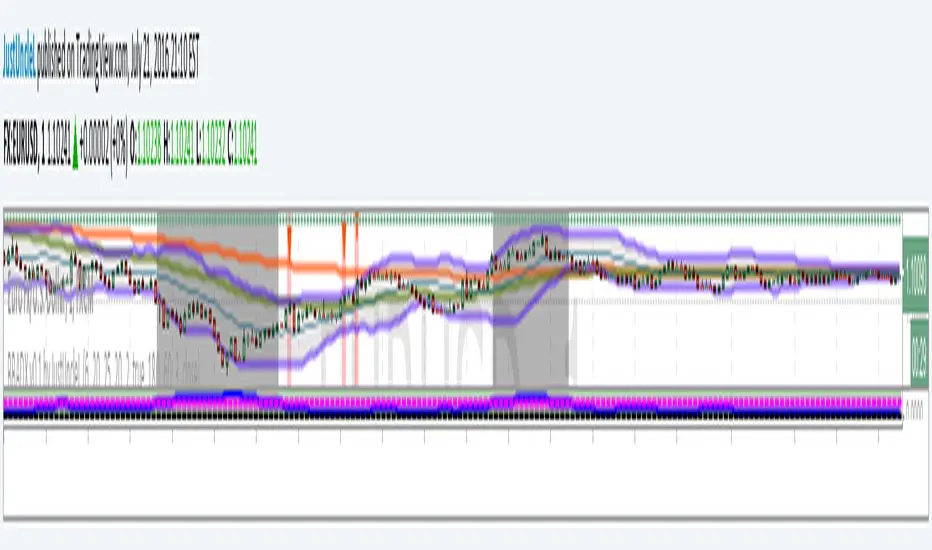
Bollinger Band and ADX Retrace Alert v0.1 by JustUncleLThis script is an implementation of a well known Bollinger band + ADX retracement strategy for 1min to 15min charts. This variation uses my own settings, a market direction filter and has an alert that can be added to your trading alarms.
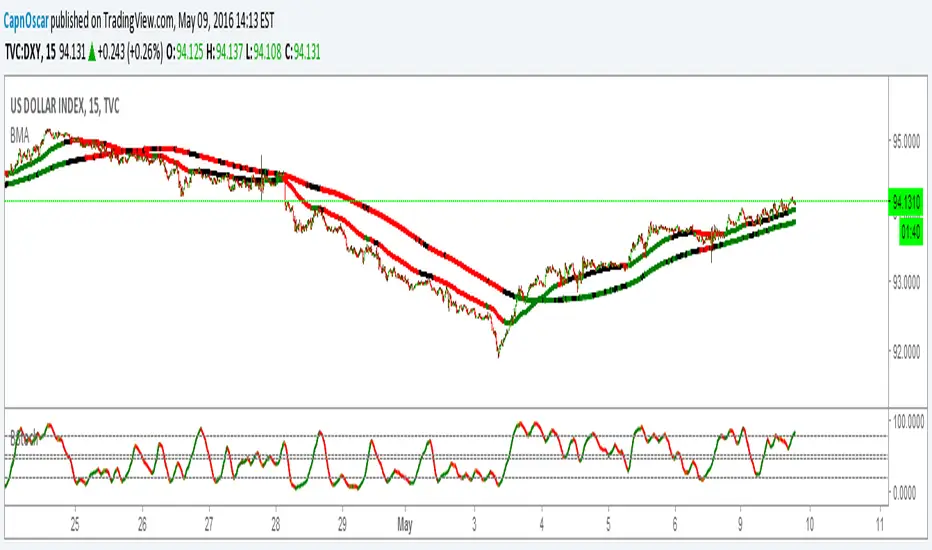
ZeroLag ema + adx = trueCombined LazyBears ZeroLag EMA and CapnOscars moving average ADX. Here's the result.
I figured it could be used as a trend trendtrading system,
ADX red + ema cross downards = short.
ADX green + ema cross up = long.
ADX black + ema cross = no trade
Or something along those line. A way filter out whipsaws.
This is just something I threw together in 5 min, so din't go all in tho. Haven't had time to test.
2 ADX
3 Z-EMAs
Colors/settings can be customized.


Kay_BBandsV3This is the 3rd version of Kay_BBands.
When +DI (Directional Index ) is above -DI , then Upper band will be visible and vice-versa.
This is when the ADX is above the threshold. 28 is the default in this version. I found its more appealing in 5M time frame.
BLUE - ADX under 10
GREEN - Uptrend, ADX over 10
RED - Downtrend, ADX over 10
Use it with another band with setting 20, 0.6 deviation. Prices keeping above or below the 2nd bands upper or lower bounds shows trending conditions.
I didn't know how to update the old script so published it again.
Changes - :
1) Updated default settings for the indicator
2) ADX setting are now DI (28), ADX (10), adx level to check is 10.
3) IMPORTANT one - When DI is up/down, lower/upper band will also have color (more visible that way.)
Play around the settings.. It really eliminates extra indicator checking visually... Please like if you think idea is good.

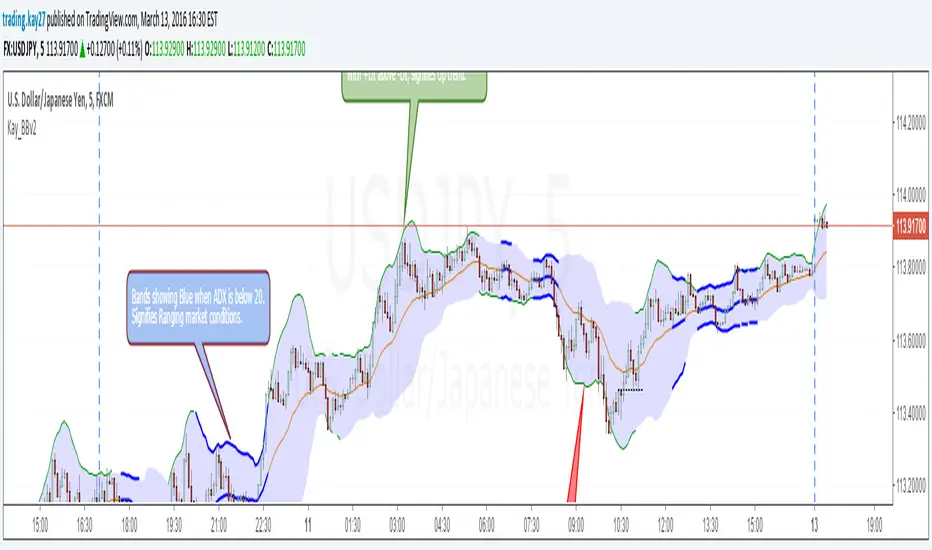
Kay_BBands v2This is the second version of Kay_BBands. But this is infused with ADX.
When +DI (Directional Index) is above -DI, then Upper band will be visible and vice-versa.
This is when the ADX is above the threshold. 20 is the default but can be set to 25.
When the ADX is below the specified threshold, both bands gets visible, showing no trending conditions.
Use it with another band with setting 20/21, 0.6 deviation. Prices keeping above or below the 2nd bands upper or lower bounds shows trending conditions.