Swing Algo V1This indicator can be used for e.g. swing algorithmic trading. It will give Buy/Long and Sell/Short signals on the chart. This algorithm uses a combination of several (custom) functions and rules to find good entry points for trend trading. After many iterations and tests I came up with this particular setup, which is highly optimized for the $ETH/$USD trading pair on the daily (D) timeframe. It is however possible to change algorithmic parameters within the indicator settings to tune this swing algorithm for other assets and timeframes. You don't need any programming skills or similar abilities to navigate this indicator.
Also you can choose the backtest time interval to test the perfomance of this algorithm for different time windows and different trading pairs. Here various backtesting parameters (e.g. trading fees) can be customized. Additionally to the TradingView Strategy Tester you can also plot your equity directly on the chart to get a sense for the performance. For this you can also scale the equity graph to e.g. match the starting point of your equity with some price point on the chart to get a direct comparison to 'Buy & Hold' strategies over time.
Note: In general it seems that cryptocurrencies are rather swing-algorithm-friendly, while I cannot recommend trading classical assets like stock or indices (e.g. S&P 500) with this indicator (although you can of course try to find good setups).
This indicator (and all other content I provide) is no financial advice. If you use this indicator you agree to my Terms and Conditions which can be found on my twitter profile linked in my signature.
Algotrading

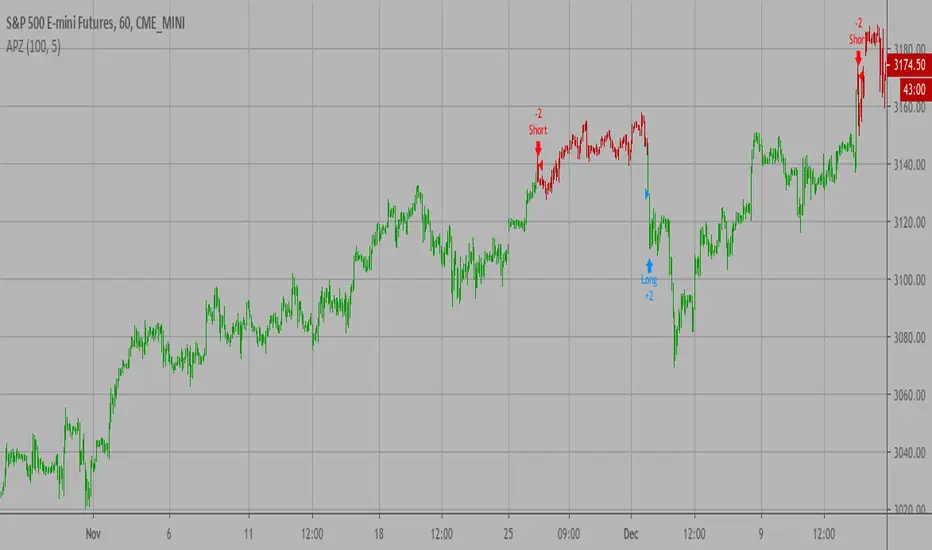
hamster-bot REP strategyThe strategy basically contains RSI + EMA + Parabolic = REP.
Entry: RSI
Trend Filter: EMA
Exit: Trailing Stop Parabolic

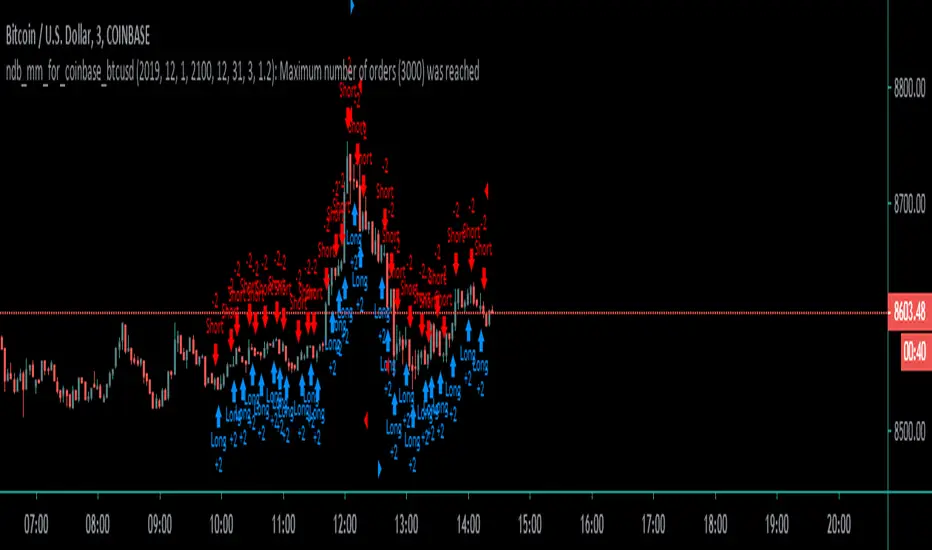
Coinbase_3-MIN_HFT-StrategyThis conceptual strategy trades against the short-term trend. The first position can be either long or short.
In the short-term, prices fluctuate up and down on wide spread exchanges.
And if the price moves to one side, the price tends to return to its original position momentarily.
This strategy set stop order. Stop price is calculated with upper and lower shadows.
Combo Backtest 123 Reversal & CMOaDisparity Index This is combo strategies for get a cumulative signal.
First strategy
This System was created from the Book "How I Tripled My Money In The
Futures Market" by Ulf Jensen, Page 183. This is reverse type of strategies.
The strategy buys at market, if close price is higher than the previous close
during 2 days and the meaning of 9-days Stochastic Slow Oscillator is lower than 50.
The strategy sells at market, if close price is lower than the previous close price
during 2 days and the meaning of 9-days Stochastic Fast Oscillator is higher than 50.
Second strategy
The related CMOaDisparity Index article is copyrighted material from Stocks & Commodities Dec 2009
My strategy modification.
WARNING:
- For purpose educate only
- This script to change bars colors.

hamster-bot CCI_PSARTrending strategy using indicators:
Commodity Channel Index (CCI) www.tradingview.com(CCI)
Parabolic SAR (SAR) www.tradingview.com(SAR)
The trend is determined by PSAR indicator on the higher timeframe.
Signals of buy/sell by CCI indicator

N Bars Down Backtest Evaluates for n number of consecutive lower closes. Returns a value
of 1 when the condition is true or 0 when false.
WARNING:
- For purpose educate only
- This script to change bars colors.
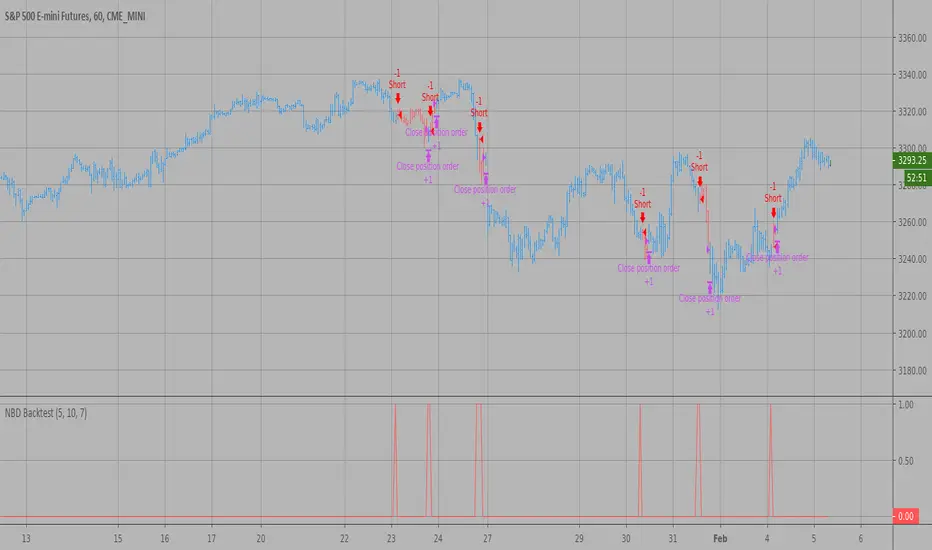
N Bars Up Backtest Evaluates for n number of consecutive higher closes. Returns a value
of 1 when the condition is true or 0 when false.
WARNING:
- For purpose educate only
- This script to change bars colors.

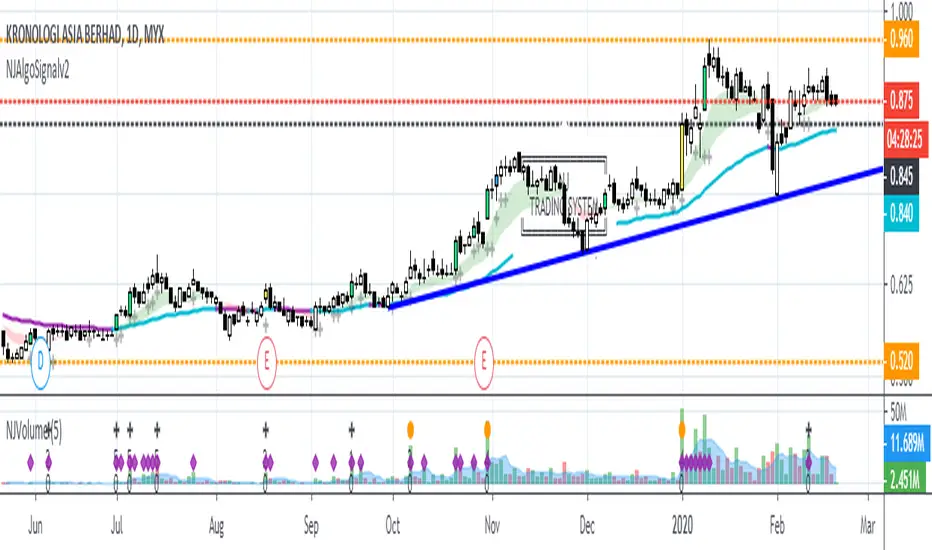
NJAlgoSignalv2NJ-ALGO-SIGNAL
Combination of Price Breakout with Volume
Bar Color
Yellow = Breakout with Volume and Trend Change
Lime = Breakout with Volume
Blue = Breakout without Volume
Black Line = Trailing Stop Line
Sell when price break the Stop Loss Line.
Try to entry on Yellow and Lime Candle.
Can consider to exit when Blue Candle occur. Sign of weakness on uptrend.
Label
Shows only when bar color condition meet
Calculate risk level based on the current price and trailing stop loss line (Black Line).
52W High
By default is off.
Background Color
To Indicate Bullish or Bearish zone.
Green = Bullish zone
Red = Bearish zone
MA strategyTrading strategy on moving averages. Based on Mean reversion. These algorithmic strategies are based on a concept that assumes a regular return of the price to a certain average level, provided that a sufficiently long time distance is considered. The main objective of such strategies is to determine the expected level of price return. Interconnected with Envelopes.

HatiKO EnvelopesPublished source code is subject to the terms of the GNU Affero General Public License v3.0
This script describes and provides backtesting functionality to internal strategy of algorithmic crypto trading software "HatiKO bot".
Suitable for backtesting any Cryptocurrency Pair on any Exchange/Platform, any Timeframe.
Core Mechanics of this strategy are based on theory of price always returning to Moving Average + Envelopes indicator (Moving_average_envelope from Wiki)
Developement of this script and trading software is inspired by:
"Essential Technical Analysis: Tools and Techniques to Spot Market Trends" by Leigh Stevens (published on 12th of April 2002)
"Moving Average Envelopes" by ChartSchool, StockCharts platform (published on 13th of April 2015 or earlier)
"Коля Колеснік" from Crypto Times channel ("Метод сетка", published on 19th of August 2018)
"3 ways to use Moving Average Envelopes" by Rich Fitton, published on Trader's Nest (published on 28st of November 2018 or earlier)
noro's "Robot WhiteBox ShiftMA" strategy v1 script, published on TradingView platform (published on 29th of August 2018)
"Moving Average Envelopes: A Popular Trading Tool" Investopedia article (published 25th of June 2019)
and KROOL1980's blogpost on Argolabs ("Гридерство или Сетка как источник прибыли на форекс", published on 27th of February 2015)
Core Features:
1) Up to 4 Envelopes in each direction (Long/Short)
2) Use any of 6 different basis MAs, optionally use different MAs for Opening and Closure
3) Use different Timeframes for MA calculation, without any repainting and lookahead bias.
4) Fixed order size, not Martingale strategy
5) Close open position earlier by using Deviation parameter
6) PineScript v4 code
Options description:
Lot - % from your initial balance to use for order size calculation
Timeframe Short - Timeframe to use for Short Opening MA calculation, can be chosen from dropdown list, default is Current Graph Timeframe
MA Type Short - Type of MA to use for Short Opening MA calculation, can be chosen from dropdown list, default is SMA
Data Short - Source of Price for Short Opening MA calculation, can be chosen from dropdown list, default is OHLC4
MA Length Short - Period used for Short Opening MA calculation, should be >=1, default is 3
MA offset Short - Offset for MA value used for Short Envelopes calculation, should be >= 0, default is 0
Timeframe Long - Timeframe to use for Long Opening MA calculation, can be chosen from dropdown list, default is Current Graph Timeframe
MA Type Long - Type of MA to use for Long Opening MA calculation, can be chosen from dropdown list, default is SMA
Data Long - Source of Price for Long Opening MA calculation, can be chosen from dropdown list, default is OHLC4
MA Length Long - Period used for Long Opening MA calculation, should be >=1, default is 3
MA offset Long - Offset for MA value used for Long Envelopes calculation, should be >= 0, default is 0
Mode close MA Short - Enable different MA for Short position Closure, default is "false". If false, Closure MA = Opening MA
Timeframe Short Close - Timeframe to use for Short Position Closure MA calculation, can be chosen from dropdown list, default is Current Graph Timeframe
MA Type Close Short - Type of MA to use for Short Position Closure MA calculation, can be chosen from dropdown list, default is SMA
Data Short Close - Source of Price for Short Closure MA calculation, can be chosen from dropdown list, default is OHLC4
MA Length Short Close - Period used for Short Opening MA calculation, should be >=1, default is 3
Short Deviation - % to move from MA value, used to close position above or beyond MA, can be negative, default is 0
MA offset Short Close - Offset for MA value used for Short Position Closure calculation, should be >= 0, default is 0
Mode close MA Long - Enable different MA for Long position Closure, default is "false". If false, Closure MA = Opening MA
Timeframe Long Close - Timeframe to use for Long Position Closure MA calculation, can be chosen from dropdown list, default is Current Graph Timeframe
MA Type Close Long - Type of MA to use for Long Position Closure MA calculation, can be chosen from dropdown list, default is SMA
Data Long Close - Source of Price for Long Closure MA calculation, can be chosen from dropdown list, default is OHLC4
MA Length Long Close - Period used for Long Opening MA calculation, should be >=1, default is 3
Long Deviation - % to move from MA value, used to close position above or beyond MA, can be negative, default is 0
MA offset Long Close - Offset for MA value used for Long Position Closure calculation, should be >= 0, default is 0
Short Shift 1..4 - % from MA value to put Envelopes at, for Shorts numbers should be positive, the higher is number, the higher should be Shift position, example: "Shift 1 = 1, shift 2 = 2, etc."
Long Shift 1..4 - % from MA value to put Envelopes at, for Longs numbers should be negative, the lower is number, the lower should be Shift position, example: "Shift 1 = -1, shift 2 = -2, etc."
From Year 20XX - Backtesting Starting Year number, only 20xx supported as script is cryptocurrency-oriented.
To Year 20XX - Backtesting Final Year number, only 20xx supported as script is cryptocurrency-oriented.
From Month - Years starting Month, optional tweaking, changing not recommended
To Month - Years ending Month, optional tweaking, changing not recommended
From day - Months starting day, optional tweaking, changing not recommended
To day - Months ending day, optional tweaking, changing not recommended
Graph notes:
Green lines - Long Envelopes.
Red lines - Short Envelopes.
Orange line - MA for closing of Short positions.
Lime line - MA for closing of Long positions.
**************************************************************************************************************************************************************************************************************
Опубликованный исходный код регулируется Условиями Стандартной Общественной Лицензии GNU Affero v3.0
Этот скрипт описывает и предоставляет функции бектеста для внутренней стратегии алгоритмического программного обеспечения "HatiKO bot".
Подходит для тестирования любой криптовалютной пары на любой бирже/платформе, на любом таймфрейме.
Кор-механика этой стратегии основана на теории всегда возвращающейся к значению МА цены с использованием индикатора Envelopes (Moving_average_envelope from Wiki)
Разработка этого скрипта и программного обеспечения для торговли вдохновлена следующими источниками:
Книга "Essential Technical Analysis: Tools and Techniques to Spot Market Trends" Ли Стивенса (опубликовано 12 апреля 2002 года)
«Moving Average Envelopes» от ChartSchool, платформа StockCharts (опубликовано 13 апреля 2015 года или раньше)
«Коля Колеснік» с канала Crypto Times («Метод сетка», опубликовано 19 августа 2018 года)
«3 ways to use Moving Average Envelopes» Рича Фиттона, опубликованные в «Trader's Nest» (опубликовано 28 ноября 2018 года или раньше)
Скрипт стратегии noro "Robot WhiteBox ShiftMA" v1, опубликованный на платформе TradingView(опубликовано 29 августа 2018 года)
«Moving Average Envelopes: A Popular Trading Tool», статья Investopedia (опубликовано 25 июня 2019 года)
Блог KROOL1980 из Argolabs («Гридерство или Сетка как источник прибыли на форекс», опубликовано 27 февраля 2015 года)
Основные особенности:
1) До 4-х Ордеров в каждом из направлении (Лонг / Шорт)
2) Выбор из 6-ти разных базовых МА, опционально используйте разные МА для открытия и закрытия.
3) Используйте разные таймфреймы для расчета MA, без перерисовки и "эффекта стеклянного шара".
4) Фиксированный размер ордера, а не стратегия Мартингейла
5) Возможность закрытия открытой позиции заблаговременно, используя параметр Deviation
6) Код реализован на PineScript v4
Описание параметров:
Lot - % от вашего первоначального баланса, используется при расчете размера Ордера
Timeframe Short - таймфрейм, используемый для расчета МА Открытия Шорт позиций, может быть выбран из списка, по умолчанию - таймфрейм текущего графика
MA Type Short - тип MA, используемый для расчета МА Открытия Шорт позиций, может быть выбран из списка, по умолчанию SMA
Data Short - источник цены для расчета МА Открытия Шорт позиций, может быть выбран из списка, по умолчанию OHLC4
MA Length Short - период, используемый для расчета МА Открытия Шорт позиций, должен быть >= 1, по умолчанию 3
MA Offset Short - смещение значения MA, используемого для расчета Шорт Ордеров, должно быть >= 0, по умолчанию 0
Timeframe Long - таймфрейм, используемый для расчета МА Открытия Лонг позиций, может быть выбран из списка, по умолчанию - таймфрейм текущего графика
MA Type Long - тип MA, используемый для расчета МА Открытия Лонг позиций, может быть выбран из списка, по умолчанию SMA
Data Long - источник цены для расчета МА Открытия Лонг позиций, может быть выбран из списка, по умолчанию OHLC4
MA Length Long - период, используемый для расчета МА Открытия Лонг позиций, должен быть >= 1, по умолчанию 3
MA Offset Long - смещение значения MA, используемого для расчета Лонг Ордеров, должно быть >= 0, по умолчанию 0
Mode close MA Short - Включает отдельное MA для закрытия Шорт позиции, по умолчанию «false». Если false, MA Закрытия = MA Открытия
Timeframe Short Close - таймфрейм, используемый для расчета МА Закрытия Шорт позиций, может быть выбран из списка, по умолчанию - таймфрейм текущего графика
MA Type Close Short - тип MA, используемый при расчете МА Закрытия Шорт позиции. Mожно выбрать из списка, по умолчанию SMA
Data Short Close - источник цены для расчета МА Закрытия Шорт позиций, может быть выбран из списка, по умолчанию OHLC4
MA Length Short Close - период, используемый для расчета МА Закрытия Шорт позиции, должен быть >= 1, по умолчанию 3
Short Deviation - % отклонения от значения MA, используется для закрытия позиции выше или ниже рассчитанного значения MA, может быть отрицательным, по умолчанию 0
MA Offset Short Close - смещение значения MA, используемого для расчета закрытия Шорт позиции, должно быть >= 0, по умолчанию 0
Mode close MA Long - Включает разные MA для закрытия Лонг позиции, по умолчанию «false». Если false, MA Закрытия = MA Открытия
Timeframe Long Close - таймфрейм, используемый для расчета МА Закрытия Лонг позиций, может быть выбран из списка, по умолчанию - таймфрейм текущего графика
MA Type Close Long - тип MA, используемый при расчете МА Закрытия Лонг позиции. Mожно выбрать из списка, по умолчанию SMA
Data Long Close - источник цены для расчета МА Закрытия Лонг позиций, может быть выбран из списка, по умолчанию OHLC4
MA Length Long Close - период, используемый для расчета МА Закрытия Лонг позиции, должен быть >= 1, по умолчанию 3
Long Deviation -% для перехода от значения MA, используется для закрытия позиции выше или ниже рассчитанного значения MA, может быть отрицательным, по умолчанию 0
MA Offset Long Close - смещение значения MA, используемого для расчета закрытия Лонг позиции, должно быть >= 0, по умолчанию 0
Short Shift 1..4 - % от значения MA для размещения Ордеров, для Шорт Ордеров должен быть положительным, чем выше номер, тем выше должна располагаться позиция Shift, например: «Shift 1 = 1, Shift 2 = 2 и т.д. "
Long Shift 1..4 - % от значения MA для размещения Ордеров, для Лонг Ордеров должно быть отрицательным, чем ниже число, тем ниже должна располагаться позиция Shift, например: «Shift 1 = -1, Shift 2 = -2, и т.д."
From Year 20XX - Год начала тестирования, из-за ориентированности на криптовалюты поддерживаются только значения формата 20хх.
To Year 20XX - Год окончания тестирования, из-за ориентированности на криптовалюты поддерживаются только значения формата 20хх.
From Month - Начальный месяц, опционально, менять не рекомендуется
To Month - Конечный месяц, опционально, менять не рекомендуется
From day - Начальный день месяца, опционально, менять не рекомендуется
To day - Конечный день месяца, опционально, менять не рекомендуется
Пояснения к графику:
Зеленые линии - Лонг Ордера.
Красные линии - Шорт Ордера.
Оранжевая линия - MA Закрытия Шорт позиций.
Лаймовая линия - MA Закрытия Лонг позиций.

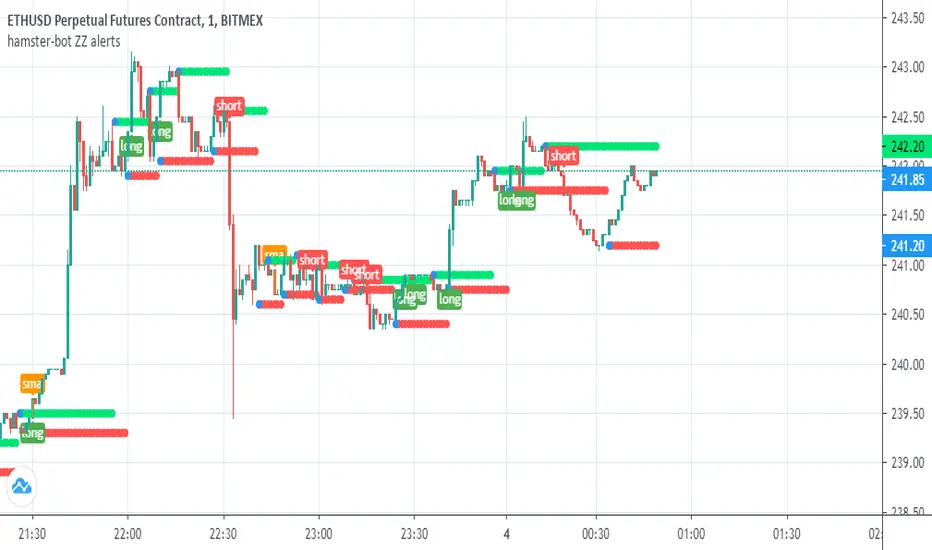
[B] hamster-bot ZZ Breakout reversal strategyAttention! This is a beta version of the strategy script >> <<
A backtest should only be done if you understand how the options work. Otherwise, do a test in the release version

TeoTrading 17-C.1 - 107. USA Algorithmic Trading Long SignalsThis indicator mark patterns that were successful in the past, based on Algorithmic Trading and backtesting.
This Script is for Private Use.
It was designed for Long Signals.
Was developed and tested with Nasdaq technology stocks and Argentinian ADRs.
Includes Real Time Stastistics.
No purchase recommendations are given. The user must do their own analysis to decide whether to buy.
"A" signal is to make the Analysis. Here the user will see a Yellow Candle.
"V" signal is to Sell. Here the user will see:
- A Green Candle: Sell with Gain using a fixed Stop Gain.
- A Blue Candle: Sell with Gain using a dynamic (variable) Stop Gain.
- A Fuchsia Candle: Sell with lost.
The Orange Candle indicates that a trade is open.
Includes Alerts.

Adaptive Price Zone Backtest The adaptive price zone (APZ) is a volatility-based technical indicator that helps investors
identify possible market turning points, which can be especially useful in a sideways-moving
market. It was created by technical analyst Lee Leibfarth in the article “Identify the
Turning Point: Trading With An Adaptive Price Zone,” which appeared in the September 2006 issue
of the journal Technical Analysis of Stocks and Commodities.
This indicator attempts to signal significant price movements by using a set of bands based on
short-term, double-smoothed exponential moving averages that lag only slightly behind price changes.
It can help short-term investors and day traders profit in volatile markets by signaling price
reversal points, which can indicate potentially lucrative times to buy or sell. The APZ can be
implemented as part of an automated trading system and can be applied to the charts of all tradeable assets.
WARNING:
- For purpose educate only
- This script to change bars colors.
BEST Supertrend MAHello traders,
That one is an experiment
I was curious to see what a supertrend based on moving average cross could give
How does it work?
Bull event: fast moving average crossing over the slow moving average
Bear event: fast moving average crossing under the slow moving average
When the event is triggered, the script will plot the Supertrend as follow
UP Trend = ohlc4+ ATR * Factor
DOWN Trend = ohlc4- ATR * Factor
Interesting to see the results given by ohlc4 vs hl2 and hl3
Documentation: www.tradingview.com
This is an alternative of the classical Supertrend based on candle close being above/beyond the previous Supertrend level.
Hope you'll enjoy it and it will improve your trading making you a better trader
Dave

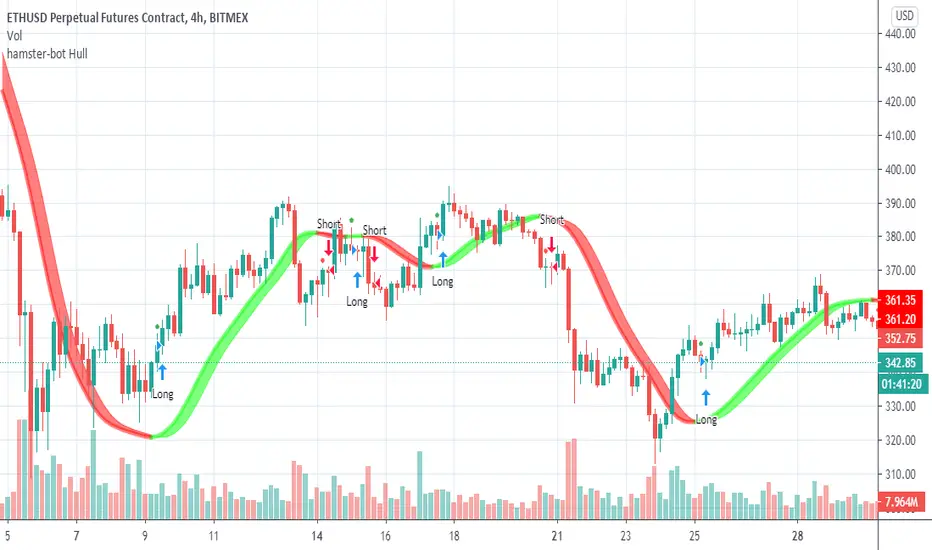
Hull Suite strategy + alerts hamster-botThis is a trading strategy on the Hull Suite indicator. 3 Hull variations: HMA, THMA (3HMA), EHMA. The strategy is always in position according to the trend of the indicator.
Combo Strategy 123 Reversal & DAPD This is combo strategies for get a cumulative signal.
First strategy
This System was created from the Book "How I Tripled My Money In The
Futures Market" by Ulf Jensen, Page 183. This is reverse type of strategies.
The strategy buys at market, if close price is higher than the previous close
during 2 days and the meaning of 9-days Stochastic Slow Oscillator is lower than 50.
The strategy sells at market, if close price is lower than the previous close price
during 2 days and the meaning of 9-days Stochastic Fast Oscillator is higher than 50.
Second strategy
This indicator is similar to Bollinger Bands. It based on DAPD - Daily
Average Price Delta. DAPD is based upon a summation for each of the
highs (hod) for the 21 days prior to today minus the summation for
each of the lows (lod) for the last 21 days prior to today. The result
of this calculation would then be divided by 21.
It will be buy when high above previos DAPD high and sell if low below previos DAPD low
WARNING:
- For purpose educate only
- This script to change bars colors.

bee ZZBreakdown trading system ( TS ) based on the ZZ indicator ( zig-zag ) using SAR (stop and reverse). The system calculates the long level and short level, depending on the direction of the breakdown - we enter the long or short position. The strategy is always in position (in the market), the strategy being in the long side reverses the position at the short level, and accordingly, on the contrary, it is in short at the long level, thereby fixing profit / loss. The strategy has proved itself to be highly volatile. Strategy tested on BitMEX exchange. It is possible to get acquainted with the results of the strategy by running the script by history.

MKAST V2 (lifetime)PLEASE READ THE ENTIRE POST BEFORE PURCHASING & USING THE MKAST Algorithm. Saves you and me some time in emails and messages. :)
This is the NEW LIFETIME ACCESS Version of the MKAST
The MKAST Buy Sell Algorithm is a very specific strategy, cut down to its roots and made perfect for the volatile crypto market.
Many Algorithms focus only on one aspect, one side, one specific rule.
As you know, this is not how life, the market or anything else works.
MKAST combines many different aspects at the same time, scans multiple other Algorithms and comes to a conclusion based on over 1350 lines of code.
It is based on Divergences, Elliott Waves, Ichimoku, MACD, MACD Histogram, RSI, Stoch, CCI, Momentum, OBV, DIOSC, VWMACD, CMF and multiple EMAs.
Every single aspect is weighted into the decision before giving out an indication.
Most buy/sell Algorithms FAIL because they try to apply the same strategy to every single chart, which
are as individual as humans.
To conquer this problem, MKAST has a wide range of settings and variables which can be easily
modified.
To make it a true strategy, MKAST has as well settings for Take Profit Points, Multiple Entries and Stop
Losses. Everything with an Alert Feature of course.
I know from experience that many people take one Algorithm and are simply too LAZY to add multiple Algorithms to make a rational choice.
The result of that is that they lose money, by following blatantly only one Algorithm.
MKAST has additional 9 Indicators, perfect for the crypto market, which can be turned on and off.
Manual
MKAST Signals Settings
“Show Signals?” - On/Off to show the Buy/Sell Signals.
“Aggressiveness” - Increase to make the signals less aggressive and decrease to make them more aggressive.
“Show Custom Signals?” - On/Off to show custom MKAST Signals as chosen in the settings below.
“Custom Buy/Sell Aggressiveness” - Choose a custom Aggressiveness for each buy and sell signal individually.
“TJ-Index Requirement For Buy/Sell” - If the TJ-Index is below the given number, it will show the signal in grey, this also applies for normal signals. Buy 0 and Sell 15 shows all signals in their original colour again.
“Don’t show signals that don’t meet index requirement?” - Checked, it will completely not show signals which would be “grey” as in the explanation above.
“Change Backgroundcolour if index is at 15 or 0?” - Checked, changes the colour of the chart if the index is at 15 or 0 points
MKAST Panel Settings
“Show Info Panel?” - Shows Info Panel on the chart.
“Move Info Panel UP by %” - Moves Info Panel up/down.
“Move Info Panel Left/Right ” - Moves Info Panel Left/Right.
“Show BitMEX Panel?” - Shows BitMEX Panel on the chart.
“Move BitMEX Panel by % ” - Moves BitMEX Panel up/down.
“Move BitMEX Panel Left/Right” - Moves BitMEX Panel Left/Right. “Signal Source” - Choose source of candle open/close for Equity calculation.
“Leverage Used?” - Select the used Leverage for your strategy and Equity calculation.
“Fees Per Trade in % ” - Deducts these fees after each trade from Equity calculation.
“Round Current Profit Price?” - Rounds the number on the Panel. “Trading Periods ” - Choose a trading Period which will be used to calculate Period Equity.
“Show separations of each Trading Period?” - Show separations on the chart of each Trading Period.
The very new feature on Tradingview and obviously now as well on MKAST are Information Panels.
I have chosen to add an Info Panel and a BitMEX Price Panel into MKAST, to make live and even
backtesting easier.
With only one blink of an eye the user is able to see ALL relevant information, without having to go
through various ways of checking and using other tools.
The Info Panel:
The first row shows the current profit. This is calculated since the signal initiation and the current candle close. Followed by a single number, which represents the current TJ-Index, removing the need of having to add the actual TJ-Index Oscillator on the chart.
The second row shows the current position and its status. This was added on request of many users wanting to know if their position is “about to change” or not. The status shows the users if the position is “endangered” or “okay”.
Followed by the “backtesting tool” already included inside the Panel. No need for complex oscillators with a hard reading for backtesting. With this one and simple panel, you see the Period Equity for the period chosen previously in the settings. This calculates all profits made inside that period and re-sets when the period ends. Right next to it, the Total Equity calculating ALL profits since the beginning of the chart.
Right below, you see the information about the last long and short position which have been open. This helps with the evaluation and documentation of the last trade.
The BitMEX Panel:
A convenient panel which shows all BitMEX contracts and their LIVE prices. The need for opening each chart goes away, the quality and experience of trading increases.
MKAST custom Signals are one of the notorious possibilities for ADVANCED strategies with MKAST.
Users who requested these features and use them frequently are the ones, having already a very unique trading strategy and they use these very custom signals as confluence or for multiple entry trades.
These custom signals and their settings can be mostly ignored by the majority of traders who are using this Algorithm.
The idea behind the grey signals has its roots in the idea of the TJ-Index. The TJ-Index being 15 Algorithms and conditions possible showing a bullish or bearish interpretation. The index counts the Algorithms which are showing a bullish interpretation.
Like that we can make sure that signals are shown in the original colour, are only those who have an additional confluence with the TJ-Index, not letting the user buy, if at least the majority is not bullish, and not letting the user sell, if at least the majority is bearish.
The custom buy and sell aggressiveness lets the user customise the MKAST algorithm even more.
Either the users wants to see how signals are changing on a different (slightly lower or higher) aggressiveness, being able to expect a change on their own settings. OR seeing that some signals of the same sort are a little out of place and is able to move these to a different aggressiveness, increasing the profitability even more.
Needless to say, custom signals are NOT a part of the Info Panel.
MKAST Label & Trendline Settings
“Show Labels?” - On/Off to show Labels above each signal, with the percentage gain or loss, calculated from the last signal to the new signal.
“Show Trendlines?” - On/Off to show automatic Trendlines following Gainzy Lines.
“Lookback Length” - Choose a length that the automatic trendiness use for calculation. Comparable to Aggressiveness.
“Wicks//Bodies” - Change between trendiness connecting from wick to wick or from body to body.
“Black lines// Coloured lines” - Change between simply black lines or changing colour lines.
“Filter Trendlines?” - On/Off to show all trendiness or just resistance decreasing and support increasing ones.
“Limit Extensions Of The Lines?” - This value increases by how much the trendiness are being extended. 0 = endless extension, otherwise 100 = maximum custom extension.MKAST Strategy “Take Profit 1” - On/Off to show TP1 points.
“Take Profit After %” - Set the percentage after which TP1 is active.
“Take Profit 2 ” - On/Off to show TP2 points.
“Take Profit 2 After %” - Set the percentage after which TP1 is
active.
“Take Profit 3” - On/Off to show TP3 points.
“Take Profit 3 After %” - Set the percentage after which TP1 is active.
“Second Entry” - On/Off to show Second Entry points.
“Second Entry After %” - Set the percentage after which Second Entry is active.
“Third Entry” - On/Off to show Third Entry points.
“Third Entry After %” - Set the percentage after which Third Entry is active.
“Stop Loss” - On/Off to show Stop Loss points.
“Stop Loss After %” - Set the percentage after which Stop Loss is active.
MKAST Strategy
To make the life of the MKAST user even easier, I have added all adjustable Take Profit Points, Multiple entry points and Stop Loss points.
I have never seen a sustainable and reliable trading strategy without TPs, Multiple entry and especially without a stop loss. Everything in the usual and fully customisable MKAST style.
Simply choose how many Take Profit points you would like to have and choose the percentage after which you would like to see the Take Profit point appear on the chart and notify you to take profits.
Are you a Trader who likes Multiple Entries? Also no problem with MKAST. Select how many additional entries you would like to have and after how many percent you would like them to appear on the chart and remind you of adding to the position.
What would a Strategy be without a Stop Loss? Same settings apply here as on the TPs and MEs.
All of the settings are able to take fractions of a number as well. This enables users to even use all of the strategy settings for scalping or FX pairs, where high leverage and the smallest of moves are used for trading.
Needless to say, all of these settings work on RENKO and Heikin Ashi as well. These might need adjustment, since the calculation is different, yet there is nothing standing in the way of it anymore.
Crypto Modified Indicators
“Show Divergences?” - On/Off to show Divergences on the Chart based on the data of 10 different Algorithms.
“Show Oversold/bought?” - On/Off to change the colour of the chart in Oversold/bought conditions.
“Oversold/bought value?” - Choose a value for which the chart is Oversold/bought.
“Show Fibonacci Levels?” - On/Off to show automatic Fibonacci Levels.
“Fibonacci Lookback Lenght” - This value states how many candles from right now are taken into account to paint the Fibonacci Levels.
“Fibonacci Custom Period” - Choose a custom Timeframe that should be used to paint the Fibonacci Levels.
“2nd-7th Fibonacci Level” - Enter a value for the Fibonacci Levels you would like to use and see on the chart.
“Plot 1.618 Level?” - On/Off for the Fibonacci extension level.
Crypto Modified Indicators
“Show Bands?” - On/Off to show the TJ-Bands on the chart.
“Bands Length” - Choose a value for the TJ-Bands Lenght
“Show Show EMA 1-3?” - On/Off to show the EMAs 1-3 on the chart.
“EMA Lenght 1-3” - Choose a value for the first to third EMA Lenght
“Show Ichimoku? ” - On/Off to show Ichimoku on the chart.
“Show Tenkin?” - On/Off to show Tenkin on the chart. “Tenkin” - Set the lenght of the Tenkin.
“Show Kijun?” - On/Off to show Kijun on the chart.
“Kijun” - Set the lenght of the Kijun.
“Show Senkou?” - On/Off to show the Senkou on the chart. “Senkou” - Set the lenght of the Senkou.
“Displacement” - Set the value of the Displacement.
“Show Chikou Span?” - On/Off to show the Chikou Span on the chart.
Crypto Custom Indicators
In the picture above, you see the first pair of Crypto Custom Indicators. The oversold and overbought conditions are highlighted.
Bullish and Bearish divergences are also plotted on the chart.
This is personally my favourite combination of Indicators and MKAST settings. It shows nicely
everything one needs to know and makes it easier to decide wether to follow a signal or not.
We here as well a perfect example of the Automatic Fibonacci Lines (Lookback 50, Timeframe 1D).
It shows all significant levels, which we can see being respected.
Orange = 23.6%, Green = 38.2%, Red = 50%, Yellow = 61.8%, Blue = 78.6%, White = 0%;100%
In this picture above, we observe the perfect ensemble of MKAST and an EMA strategy, especially modified for crypto markets.
Here, as by default, we have the EMAs at 21, 90 and 200. These have shown to be very significant moving support and resistance points in the crypto market.
In this picture above, I lowered the timeframe to show the highly significant levels of the Ichimoku. It has not the “usual values”. These here have been modified for the volatile crypto market and set as default.
An incredibly powerful tool for anyone who is ready to step up their trading game. It is a huge part of the MKAST back end and the strategy behind it.
MKAST Custom Alerts
1
MKAST without any doubt has Custom Alerts for all Signals that it is painting on the chart.
One can even choose to receive custom notifications for Take Profit points, Multiple Entry points and
the Stop Loss points.
The signals appear on the chart DURING the candle, not at the end of the candle. Therefore, the
alerts do this as well. These appear during the candle.
Here we can see all of the possible Alerts that can be chosen to be displayed. In total it is 14 different custom alerts, based on what the trader is looking for and how he is trading.
Personally, I have 10-15 coins that I trade the most and for these I have custom notifications, mostly though only the MKAST Buy/Sell and Stop Loss Signals.
To activate Alerts for MKAST,
1) Go to the “ALERT” icon on the top tool bar of your Tradingview.
2) Select “CONDITION” as “—MKAST—“
3) Then choose ONE condition from the list of conditions.
4) On “OPTIONS” you can set how many times it appears, I have “Once per Bar”.
4.1) If you want to make sure that the signal is truly there and not just a condition for a second during the candle, choose “ONCE PER BAR CLOSE”.
5) “Expiration Time” sets the time until the alert expires. PRO users have no expiration for alerts.
6) “Alert Actions” give you a row of choices what happens and how you want to be notified.
7) “Message” is the message that you receive inside the notification.
Thank you, Kong

Combo Backtest 123 Reversal & D_ELI (Ehlers Leading Indicator) This is combo strategies for get a cumulative signal.
First strategy
This System was created from the Book "How I Tripled My Money In The
Futures Market" by Ulf Jensen, Page 183. This is reverse type of strategies.
The strategy buys at market, if close price is higher than the previous close
during 2 days and the meaning of 9-days Stochastic Slow Oscillator is lower than 50.
The strategy sells at market, if close price is lower than the previous close price
during 2 days and the meaning of 9-days Stochastic Fast Oscillator is higher than 50.
Second strategy
This Indicator plots a single
Daily DSP (Detrended Synthetic Price) and a Daily ELI (Ehlers Leading
Indicator) using intraday data.
Detrended Synthetic Price is a function that is in phase with the dominant
cycle of real price data. This one is computed by subtracting a 3 pole Butterworth
filter from a 2 Pole Butterworth filter. Ehlers Leading Indicator gives an advanced
indication of a cyclic turning point. It is computed by subtracting the simple
moving average of the detrended synthetic price from the detrended synthetic price.
Buy and Sell signals arise when the ELI indicator crosses over or under the detrended
synthetic price.
See "MESA and Trading Market Cycles" by John Ehlers pages 64 - 70.
WARNING:
- For purpose educate only
- This script to change bars colors.
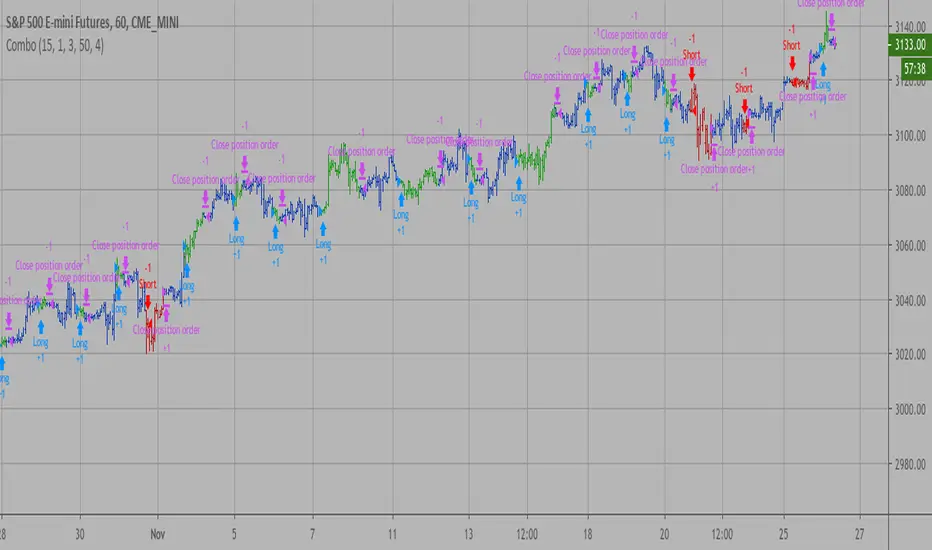
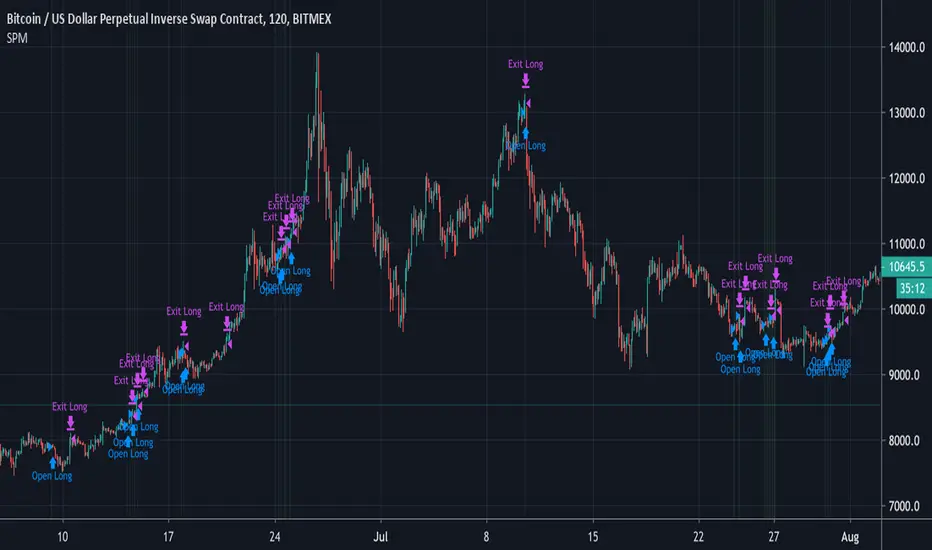
OnePunch Algo Hard BUY/SELL and Date Range - Version 1~~~ How to Detect Sell Signals ~~~
The First Red Outlined Yellow Bar after a purple "close entry order long" signal : then that is a SELL
~~ What is Purple Signal~~~
Purple "Close Entry Order Long" is a warning for a trend reversal. Normally this is given when the upward trend is reversed.
~~~ How to Detect Buy Signals ~~~
Like in the screenshot, the 1st blue "long" signal after 1 or couple of white bars; then it is a BUY.
Note: This is only available for invited members only. This is a new strategy with Dates ranges.

CryptoEngineering 🔥Isn’t It Time You Made Your Crypto Portfolio Great Again? 🔥
The falling knives, the heartbreaking crashes, the devastating feeling of watching a missed trade soar all the way to the moon.
The markets aren’t fair, which means you need a tool that gives you an edge. So,It is time to try EngineeringRobo.
The Engineeringrobo is a great ally in a crypto market - when the price moves the algorithm will automatically show Buy and Sell orders when there is a best opportunity to make a profit. It is a just SMART trading system script on TradingView that brings the easiest approach to trading with a high profitability rate.
I created EngineeringRobo to help you on your traders as a robo advisor , It will "not " trade on behalf of you on exchanges via API. It is not an AI robot,It is am ALGO Trading robot. You can use it on any trading markets (BIST, S&P 500,Commodities ,Forex, Crypto ) with any time frame!
My unique algorithm find profitable altcoins based on their Ichimoku, McGinley, MA, RSI, MACD, Stochastic, Volumes and Price Changes gives you BUY and SELL signals. The EngineeringRobo indicator displays two different signals for entry and exit on a coin to maximize its profitability on the chart. The signals can appear at any time during an open candle, but once closed the signal is final and wont change in the future.
One of the biggest advantages of algo trading is removing human emotion from the crypto markets,humans trading are susceptible to emotions that lead to irrational decisions.Robo doesn't have to think or feel good to make a trade. If conditions are met, it enters.When the trade goes the wrong way or hits a profit target, It exits. It doesn't get angry at the market or feel invincible after making a few good trades. The two emotions that lead to poor decisions that algo traders aren't susceptible to are fear,and greed.
That's why It makes money but most of you not!
What Are the Advantages of using it as a ROBO Advisor?
🔴Reduce your required screen-time
🔴Reduce anxiety over missing setups when you are busy
🔴Turn existing indicators into alerts (eg. Whenever RSI goes overbought)
🔴Find comfort in knowing that you have me on your side
To get the maximized results from @EngineeringRobo
Open tradingview
Decide the coin/BTC
Pick 1M
Draw the Support & Resistance lines
Change the 1W
Draw the lines - Support & Resistance
Find out Chart Patterns
Change to 3D/1D / 3H
Check Robo' signals
Set your orders
Enjoy your profits💰
***Even the best automated day trading software can trigger false trends.
In August 2012 by Knight Capital group;who lost over $440 million in just half an hour when their trading software went rogue in response to market conditions. That's why it is a Robo advisor not trading bot! Engineeringrobo is not a get-rich-quick scheme as well!
Disclaimer
Information on EngineeringRobo should not be seen as a recommendation to trade BIST, S&P 500,Commodities ,Forex, Crypto.
EngineeringRobo is not licensed nor authorized to provide advice on investing and related matters.
Information on the page is not, nor should it be seen as investment advice.Any trading decisions that you make are solely your responsibility. Clients without sufficient knowledge should seek individual advice from an authorized source.
Crypto and Forex trading entails significant risks and there is a chance that clients lose all of their invested money. Past performance is not a guarantee of future returns. Before trading with any of the Algos, clients should make sure they understand the risks.
EngineeringRobo nor its agents or partners are not registered and do not provide any services on the US territory.
***I have been trading since 2016 . Got my first bitcoin in 2013

Simple Price Momentum - How To Create A Simple Trading StrategyThis script was built using a logical approach to trading systems. All the details can be found in a step by step guide below. I hope you enjoy it. I am really glad to be part of this community. Thank you all. I hope you not only succeed on your trading career but also enjoy it.
docs.google.com