Multi-Step FlexiSuperTrend - Indicator [presentTrading]This version of the indicator is built upon the foundation of a strategy version published earlier. However, this indicator version focuses on providing visual insights and alerts for traders, rather than executing trades. This one is mostly for @thorcmt.
█ Introduction and How it is Different
The **Multi-Step FlexiSuperTrend Indicator** is a versatile tool designed to provide traders with a highly customizable and flexible approach to trend analysis. Unlike traditional supertrend indicators, which focus on a single factor or threshold, the **FlexiSuperTrend** allows users to define multiple levels of take-profit targets and incorporate different trend normalization methods.
It comes with several advanced customization features, including multi-step take profits, deviation plotting, and trend normalization, making it suitable for both novice and expert traders.
BTCUSD 6hr Performance
█ Strategy, How It Works: Detailed Explanation
The **Multi-Step FlexiSuperTrend** works by calculating a supertrend based on multiple factors and incorporating oscillations from trend deviations. Here’s a breakdown of how it functions:
🔶 SuperTrend Calculation
At the heart of the indicator is the SuperTrend formula, which dynamically adjusts based on price movements.
🔶 Normalization of Deviations
To enhance accuracy, the **FlexiSuperTrend** calculates multiple deviations from the trend and normalizes them.
🔶 Multi-Step Take Profit Levels
The indicator allows setting up to three take profit levels, which are displayed via price level alerts. lows traders to exit part of their position at various profit intervals.
For more detail, please check the strategy version - Multi-Step-FlexiSuperTrend-Strategy:
and 'FlexiSuperTrend-Strategy'
█ Trade Direction
The **Multi-Step FlexiSuperTrend Indicator** supports both long and short trade directions.
This flexibility allows traders to adapt to trending, volatile, or sideways markets.
█ Usage
To use the **FlexiSuperTrend Indicator**, traders can set up their preferences for the following key features:
- **Trading Direction**: Choose whether to focus on long, short, or both signals.
- **Indicator Source**: The price source to calculate the trend (e.g., close, hl2).
- **Indicator Length**: The number of periods to calculate the ATR and trend (the larger the value, the smoother the trend).
- **Starting and Increment Factor**: These adjust how reactive the trend is to price movements. The starting factor dictates how far the initial trend band is from the price, and the increment factor adjusts subsequent trend deviations.
The indicator then displays buy and sell signals on the chart, along with alerts for each take-profit level.
Local picture
█ Default Settings
The default settings of the **Multi-Step FlexiSuperTrend** are carefully designed to provide an optimal balance between sensitivity and accuracy. Let’s examine these default parameters and their effect on performance:
🔶 Indicator Length (Default: 10)
The **Indicator Length** determines the lookback period for the ATR calculation. A smaller value makes the indicator more reactive to price changes, but may generate more false signals. A longer length smooths the trend and reduces noise but may delay signals.
Effect on performance: Shorter lengths perform better in volatile markets, while longer lengths excel in trending markets.
🔶 Starting Factor (Default: 0.618)
This factor adjusts the starting distance of the SuperTrend from the current price. The smaller the starting factor, the closer the trend is to the price, making it more sensitive. Conversely, a larger factor allows more distance, reducing sensitivity but filtering out false signals.
Effect on performance: A smaller factor provides quicker signals but can lead to frequent false positives. A larger factor generates fewer but more reliable signals.
🔶 Increment Factor (Default: 0.382)
The **Increment Factor** controls how the trend bands adjust as the price moves. It increases the distance of the bands from the price with each iteration.
Effect on performance: A higher increment factor can result in wider stop-loss or trend reversal bands, allowing for longer trends to develop without frequent exits. A lower factor keeps the bands closer to the price and is more suited for shorter-term trades.
🔶 Take Profit Levels (Default: 2%, 8%, 18%)
The default take-profit levels are set at 2%, 8%, and 18%. These values represent the thresholds at which the trader can partially exit their positions. These multi-step levels are highly customizable depending on the trader’s risk tolerance and strategy.
Effect on performance: Lower take-profit levels (e.g., 2%) capture small, quick profits in volatile markets, while higher levels (8%-18%) allow for a more gradual exit in strong trends.
🔶 Normalization Method (Default: None)
The default normalization method is **None**, meaning the deviations are not normalized. However, enabling normalization (e.g., **Max-Min**) can improve the clarity of the indicator’s signals in volatile or choppy markets by smoothing out the noise.
Effect on performance: Using a normalization method can reduce the effect of extreme deviations, making signals more stable and less prone to false positives.
Average True Range (ATR)

Uptrick: Market MoodsThe "Uptrick: Market Moods" indicator is an advanced technical analysis tool designed for the TradingView platform. It combines three powerful indicators—Relative Strength Index (RSI), Average True Range (ATR), and Bollinger Bands—into one cohesive framework, aimed at helping traders better understand and interpret market sentiment. By capturing shifts in the emotional climate of the market, it provides a holistic view of market conditions, which can range from calm to stressed or even highly excited. This multi-dimensional analysis tool stands apart from traditional single-indicator approaches by offering a more complete picture of market dynamics, making it a valuable resource for traders looking to anticipate and react to changes in market behavior.
The RSI in the "Uptrick: Market Moods" indicator is used to measure momentum. RSI is an essential component of many technical analysis strategies, and in this tool, it is used to identify potential market extremes. When RSI values are high, they indicate an overbought condition, meaning the market may be approaching a peak. Conversely, low RSI values suggest an oversold condition, signaling that the market could be nearing a bottom. These extremes provide crucial clues about shifts in market sentiment, helping traders gauge whether the current emotional state of the market is likely to result in a reversal. This understanding is pivotal in predicting whether the market is transitioning from calm to stressed or from excited to overbought.
The Average True Range adds another layer to this analysis by offering insights into market volatility. Volatility is a key factor in understanding the mood of the market, as periods of high volatility often reflect high levels of excitement or stress, while low volatility typically indicates a calm, steady market. ATR is calculated based on the range of price movements over a given period, and the higher the value, the more volatile the market is. The "Uptrick: Market Moods" indicator uses ATR to dynamically gauge volatility levels, helping traders understand whether the market is currently moving in a way that aligns with its emotional mood. For example, an increase in ATR accompanied by an RSI value that indicates overbought conditions could suggest that the market is in a highly excited state, with the potential for either strong momentum continuation or a sharp reversal.
Bollinger Bands complement these tools by providing visual cues about price volatility and the range within which the market is likely to move. Bollinger Bands plot two standard deviations away from a simple moving average of the price. This banding technique helps traders visualize how far the price is likely to deviate from its average over a certain period. The "Uptrick: Market Moods" indicator uses Bollinger Bands to establish price boundaries and identify breakout conditions. When prices break above the upper band or below the lower band, it often signals that the market is either highly stressed or excited. This breakout condition serves as a visual representation of the market mood, alerting traders to moments when prices are moving beyond typical ranges and when significant emotional shifts are occurring in the market.
Technically, the "Uptrick: Market Moods" indicator has been developed using TradingView’s Pine Script language, a highly efficient language for building custom indicators. It employs functions like ta.rsi, ta.atr, and ta.sma to perform the necessary calculations. The use of these built-in functions ensures that the calculations are both accurate and efficient, allowing the indicator to operate in real-time without lagging, even in volatile market conditions. The ta.rsi function is used to compute the Relative Strength Index, while ta.atr calculates the Average True Range, and ta.sma is used to smooth out price data for the Bollinger Bands. These functions are applied dynamically within the script, allowing the "Uptrick: Market Moods" indicator to respond to changes in market conditions in real time.
The user interface of the "Uptrick: Market Moods" indicator is designed to provide a visually intuitive experience. The market mood is color-coded on the chart, making it easy for traders to identify whether the market is calm, stressed, or excited at a glance. This feature is especially useful for traders who need to make quick decisions in fast-moving markets. Additionally, the indicator includes an interactive table that updates in real-time, showing the most recent mood state and its frequency. This provides valuable statistical insights into market behavior over specific time frames, helping traders track the dominant emotional state of the market. Whether the market is in a prolonged calm state or rapidly transitioning through moods, this real-time feedback offers actionable data that can help traders adjust their strategies accordingly.
The RSI component of the "Uptrick: Market Moods" indicator helps detect the speed and direction of price movements, offering insight into whether the market is approaching extreme conditions. By providing signals based on overbought and oversold levels, the RSI helps traders decide whether to enter or exit positions. The ATR element acts as a volatility gauge, dynamically adjusting traders’ expectations in response to changes in market volatility. Meanwhile, the Bollinger Bands help identify trends and potential breakout conditions, serving as an additional confirmation tool that highlights when the price has moved beyond normal boundaries, indicating heightened market excitement or stress.
Despite the robust capabilities of the "Uptrick: Market Moods" indicator, it does have limitations. In markets affected by sudden shifts, such as those driven by major news events or external economic factors, the indicator’s performance may not always be reliable. These external factors can cause rapid mood swings that are difficult for any technical analysis tool to fully anticipate. Additionally, the indicator’s complexity may pose a learning curve for novice traders, particularly those who are unfamiliar with the concepts of RSI, ATR, and Bollinger Bands. However, with practice, traders can become proficient in using the tool to its full potential, leveraging the insights it provides to better navigate market shifts.
For traders seeking a deeper understanding of market sentiment, the "Uptrick: Market Moods" indicator is an invaluable resource. It is recommended for those dealing with medium to high volatility instruments, where understanding emotional shifts can offer a strategic advantage. While it can be used on its own, integrating it with other forms of analysis, such as fundamental analysis and additional technical indicators, can enhance its effectiveness. By confirming signals with other tools, traders can reduce the likelihood of false signals and improve their overall trading strategy.
To further enhance the accuracy of the "Uptrick: Market Moods" indicator, it can be integrated with volume-based tools like Volume Profile or On-Balance Volume (OBV). This combination allows traders to confirm the moods identified by the indicator with volume data, providing additional confirmation of market sentiment. For example, when the market is in an excited mood, an increase in trading volume could reinforce the reliability of that signal. Conversely, if the market is stressed but volume remains low, traders may want to proceed with caution. Using multiple indicators together creates a more comprehensive trading approach, helping traders better manage risk and make informed decisions based on multiple data points.
In conclusion, the "Uptrick: Market Moods" indicator is a powerful and unique addition to the suite of technical analysis tools available on TradingView. It provides traders with a multi-dimensional view of market sentiment by combining the analytical strengths of RSI, ATR, and Bollinger Bands into a single tool. Its ability to capture and interpret the emotional mood of the market makes it an essential tool for traders seeking to gain an edge in understanding market behavior. While the indicator has certain limitations, particularly in rapidly shifting markets, its ability to provide real-time insights into market sentiment is a valuable asset for traders of all experience levels. Used in conjunction with other tools and sound trading practices, the "Uptrick: Market Moods" indicator offers a comprehensive solution for navigating the complexities of financial markets.

ATR Price Targets (Daily, Weekly, Monthly)This indicator calculates and displays dynamic price targets based on the Average True Range (ATR) for daily, weekly, and monthly timeframes. It’s designed to help traders set volatility-based price targets for more precise stop-losses, take-profit levels, and trade management.
Features:
Daily, Weekly, and Monthly ATR Targets: Automatically calculates and plots upper and lower price targets based on ATR values for each timeframe.
Risk Management Tool: Ideal for setting stop-loss and take-profit levels based on market volatility.
Customizable Settings: You can adjust the ATR length and multiplier to match your preferred trading style and risk tolerance.
Visual Alerts: Background colors change when price reaches or exceeds the calculated targets, providing easy visual cues for decision-making.
How to Use:
Use the upper and lower price targets to set realistic exit points for your trades.
Adjust the ATR multiplier for more or less conservative targets based on market volatility.
Apply this across multiple timeframes to combine long-term and short-term volatility trends.
This indicator is perfect for traders looking to incorporate volatility analysis into their trading strategy using ATR.

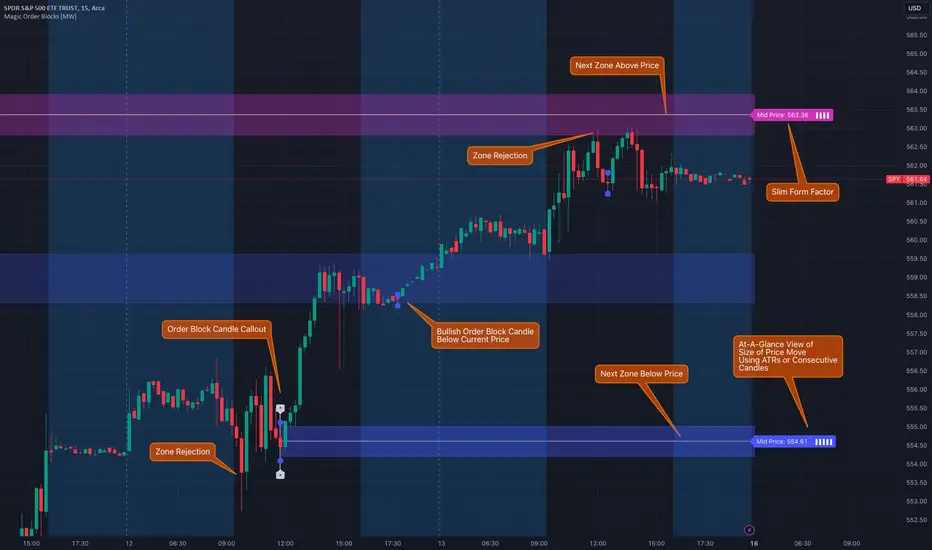
Magic Order Blocks [MW]Add a slim design, minimalist view of the most relevant higher and lower order blocks to your chart. Use our novel method of filtering that uses both the the number of consecutive bullish or bearish candles that follow the order block, and the number of ATRs that the asset’s price changed following the order block. View just the order blocks above and below the current price, or view the backgrounds for each and every one. And, if you're up to it, dig into a comprehensive view of the data for each order block candle.
Settings:
General Settings
Minimum # of Consecutive Bars Following Order Block
Show Bullish Order Blocks Below / Hide Last Bullish Block
Show Bearish Order Blocks Above / Hide Last Bearish Block
Use ATR Filter - Select # of ATRs Below
Closest Order Block is Followed by This Many ATRs
Preferences
Right Offset of Indicator Label
Show Mid-Line from Recent Order Block Indicator Label
Use ATRs Instead of Consecutive Candles in Label Indicator
Show Timestamp of Recent Order Block
Show Large Order Block Detail Labels
Show Small Order Block Labels
Background Settings
Show Background for Recent Order Block Indicator Label
# of Backgrounds to Show Before Now
Show All Bullish Order Block Backgrounds
Show All Bearish Order Block Backgrounds
Calculations
This indicator creates a matrix of each order block that is followed by the user-specified number of consecutive bullish or bearish candles. The data can be further filtered by the number of ATRs that the price moves after the order block - also user-defined. The most recent bearish order block above the current price takes arrays from the initial filtered matrix of arrays, filters once more by the “mid-price” of the order block (the average between the order block candle high and low) and selects the last element from this order block matrix. The same follows for the latest bearish order block above the current price.
How to Use
An order block refers to a price range or zone on a chart where large institutional orders have been placed, causing a significant shift in market direction. These zones are crucial because they often indicate areas of strong buying or selling interest, which can lead to future support or resistance levels. Traders use order blocks to identify potential points of market reversal or continuation.
The Magic Order Blocks default view shows the most recent overhead bearish order block above the current price, and the most recent bullish order block below. These can presumably act as support or resistance levels, because they reflect the last price where a significant price move occurred. “Significant” meaning that the order block candle was followed by many consecutive bullish or bearish candles. Based on the user-defined settings, it can also mean that price moved multiples of the asset's average true range (ATR). More consecutive candles means that the duration of the move lasted a long time. A higher ATR move indicates that the price moved impulsively in one direction.
The default view also shows a label to the right of the current price that provides the price level, the time stamp of the order block (optional), and a sequence of bars that show the significance of the level. By default, these bars represent the number of ATRs that price rose or fell following the order block, but they can be toggled to show the number of consecutive bullish or bearish candles that followed the order block.
Although the default view provides the zones that are most relevant to the current price, past order block candles can also be identified visually with labels as well with translucent backgrounds color-coded for bullish or bearish bias. Overlapping backgrounds can identify an area that has been repeatedly been an area of support or resistance.
A detailed view of each order block can also be viewed the includes the following data points:
Bar Index
Timestamp
Consecutive Accumulated Volume
Consecutive Bars
Price Change over Consecutive Bars
Price/Volume Ratio Over Consecutive Bars
Mid Price of Order Block
High Price of Order Block
Low Price of Order Block
ATRs over Consecutive Bars
- Other Usage Notes and Limitations:
The calculations used only provide an estimated relationship or a close approximation, and are not exact.
It's important for traders to be aware of the limitations of any indicator and to use them as part of a broader, well-rounded trading strategy that includes risk management, fundamental analysis, and other tools that can help with reducing false signals, determining trend direction, and providing additional confirmation for a trade decision. Diversifying strategies and not relying solely on one type of indicator or analysis can help mitigate some of these risks.
Things to keep in mind. Longer timeframes don’t necessarily have a as many consecutive candle drops or gains as with shorter timeframes, so be sure to adjust your settings when moving to 1 hour, 1 day, or 1 week timeframes from 1 minute, 5 minute, or 15 minute timeframes.
Average True Range with Price MAATR with Price Moving Average Indicator
This custom indicator combines the Average True Range (ATR) with a Price Moving Average (MA) to help traders analyze market volatility in percent to the price.
Key Components:
Average True Range (ATR)
Price Moving Average (MA)
ATR/Price in Percent
ATR/Price in Percent
Purpose: This ratio helps traders understand the relative size of the ATR compared to the current price, providing a clearer sense of how significant the volatility is in proportion to the price level.
Calculation: ATR is divided by the current closing price and multiplied by 100 to express it as a percentage. This makes it easier to compare volatility across assets with different price ranges.
Plot: This is plotted as a percentage, making it easier to gauge whether the volatility is proportionally high or low compared to the asset's price.
Usage:
This indicator is designed to help identify the most volatile tokens, making it ideal for configuring a Grid Bot to maximize profit. By focusing on high-volatility assets, traders can capitalize on larger price swings within the grid, increasing the potential for more profitable trades.
Features:
Customizable Smoothing Method: Choose from RMA (Relative Moving Average), SMA (Simple Moving Average), EMA (Exponential Moving Average), or WMA (Weighted Moving Average) for both ATR and the Price Moving Average.
Dual Perspective: The indicator provides both volatility analysis (ATR) and trend analysis (Price MA) in a single view.
Proportional Volatility: The ATR/Price (%) ratio adds a layer of context by showing how volatile the asset is relative to its current price.

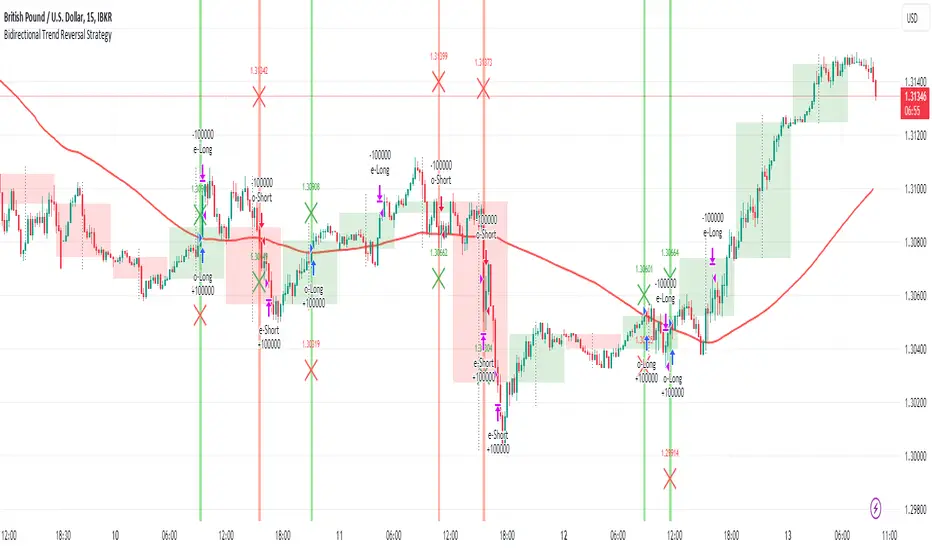
Bidirectional Trend Reversal StrategyBidirectional Trend Reversal Strategy
This strategy aims to identify potential trend reversals and execute trades accordingly, focusing on both long and short positions. It uses a crossover of the Simple Moving Average (SMA) with price action as a key signal. When the price crosses above the SMA and the previous period was bearish (closed lower than it opened), the script opens a long position ("o-Long"). The exit ("e-Long") occurs when the target or stop-loss levels are hit, which are dynamically set using the ATR (Average True Range).
For short trades, when the price crosses below the SMA and the previous period was bullish (closed higher than it opened), the script opens a short position ("o-Short"). The exit ("e-Short") follows the same ATR-based logic for stop-loss and take-profit.
All settings, including SMA and ATR parameters, are fully customizable, allowing users to adapt the strategy to different market conditions and personal trading preferences.
This approach provides a systematic way to capture trend reversals and manage trades with clear entry and exit signals based on market momentum and volatility.
Example Setup:
Market: Forex
Pair: USD/GBP
Order size: 100,000 Contracts (1 Lot)
Timeframe: 15 minutes
SMA: 93
ATR Length: 15
Stop-Loss (ATR Multiplier): 7
Take-Profit Multiplier: 2
Experiment with different settings to achieve the best results for your trading style and market conditions.
[DarkTrader] Strong High LowThe Strong High Low indicator calculates strong high and low pivots based on price action and the Average True Range (ATR). The calculation for both the high and low pivots involves analyzing recent candle behavior to identify significant levels where price reversal is likely. Specifically, it looks for consecutive bearish or bullish candles to determine whether a strong high or low has been established.
Indicator In Use :
For strong highs, the indicator checks if three consecutive candles are bearish, meaning their closing price is lower than their opening price. It further examines prior candles to confirm that they followed a specific pattern where a reversal could occur. If one of these earlier candles closed higher than it opened, the indicator assumes that this was a strong high, and it records either the high of the second or third candle from the pattern, depending on their relationship to each other.
Similarly, for strong lows, the indicator searches for three consecutive bullish candles where the close is higher than the open. The algorithm then reviews prior candles in the sequence to ensure that the market condition supports a potential low pivot. If an earlier candle closes lower than it opens, it marks this as a strong low. The final low point for the pivot is chosen based on a comparison between the second and third candles of the pattern.
Once the high and low pivots are determined, the indicator adjusts these levels using the ATR value. The ATR is added to the strong high pivot and subtracted from the strong low pivot to create slightly modified levels. This helps accommodate market volatility by widening the range of the high and low pivots, making the levels more reliable in reflecting potential reversal zones.
Finally, the strong high and low pivot lines are drawn on the chart, extending both to the left and right of the current price, based on the user-defined offset values. These lines give a visual cue of where key resistance and support levels exist, with labels marking the exact pivot values for easy reference.

Super Trend ReversalsMain Concept
The core idea behind the Super Trend Reversals indicator is to assess the momentum of automated trading bots (often referred to as 'Supertrend bots') that enter the market during critical turning points. Specifically, the indicator is tuned to identify when the market is nearing bottoms or peaks, but just before it shifts direction based on the triggered Supertrend signals. This approach helps traders engage with the market right as the reversal momentum builds up, allowing for entry just as conditions become favorable and exit before momentum wanes.
How It Works
The Super Trend Reversals uses multiple Supertrend calculations, each with different period and multiplier settings, to form a comprehensive view of the trend. The total trend score from these calculations is then analyzed using the Relative Strength Index (RSI) and Exponential Moving Averages (EMA) to gauge the strength and sustainability of the trend.
A key feature of this indicator is the isCurrentRangeSmaller() function, which evaluates if the current price range is lower than the average over the recent period. This function is critical as it helps determine the stability of the market environment, reducing the likelihood of entering or exiting trades based on erratic price movements that could lead to false signals.

ATR+Order Block IndicatorThe ATR+Order Block Indicator is a unique and comprehensive tool designed to combine volatility-based analysis with key price action levels to provide traders with reliable entry and exit points. This indicator merges the Average True Range (ATR) for dynamic trailing stop calculation with order block detection to identify significant support and resistance zones on the chart. This combination offers traders a powerful blend of trend-following and price level analysis for improved trading decisions.
How the Components Work Together:
1. ATR-Based Trailing Stop:
• The Average True Range (ATR) is a widely used volatility indicator that measures the degree of price movement over a specified period. In this indicator, the ATR is used to create a trailing stop that dynamically adjusts to market conditions.
• How It Works: The ATR value is multiplied by a user-defined multiplier (ATR Multiplier) to set the distance of the trailing stop from the current price. This trailing stop moves with the price:
• If the price moves upwards, the trailing stop adjusts higher, ensuring it only moves in the direction of the trade.
• If the price moves downwards, the trailing stop adjusts lower accordingly.
• Purpose: This trailing stop helps traders manage risk by automatically adjusting to market volatility, ensuring that stops are not too tight in volatile conditions or too wide in quieter markets. It also helps lock in profits while maintaining a position in the market’s direction.
2. Order Block Detection:
• Order blocks are areas on the chart where significant buying (accumulation) or selling (distribution) has occurred. These zones often act as potential support or resistance levels due to the presence of unfilled buy or sell orders by large institutions or traders.
• How It Works: The indicator identifies the highest high (seller order block) and the lowest low (buyer order block) within a user-defined lookback period. These are plotted on the chart:
• Buyer Order Block: Represents a potential support area where buying interest is likely to reappear.
• Seller Order Block: Represents a potential resistance area where selling interest may reemerge.
• Purpose: By identifying these order blocks, traders can anticipate potential price reversals or continuations, aligning their trades with key market levels where significant buying or selling has occurred.
Justification for Combining These Components:
1. Enhanced Signal Accuracy and Context:
• The combination of ATR-based trailing stops with order block detection provides a dual-layered approach to trade decisions:
• ATR Trailing Stop offers trend-following signals based on volatility, helping traders capture market momentum.
• Order Blocks provide context to these signals by highlighting critical price levels where market participants have previously shown strong interest.
• This fusion allows traders to filter signals more effectively, ensuring trades are aligned with both market trends and key support/resistance zones.
2. Dynamic Risk Management:
• Using the ATR to set a dynamic trailing stop ensures that the stop-loss level adapts to the changing volatility of the market. When combined with order block detection, traders gain an additional layer of risk management:
• Stop Loss Placement: Traders can place stops just outside identified order blocks to protect against sudden price reversals while maintaining a tight stop aligned with current market volatility.
3. Reducing Market Noise and Avoiding False Signals:
• The indicator includes a mechanism to avoid repetitive signals, requiring a minimum gap between signals. This reduces noise and helps traders avoid multiple false entries in choppy market conditions.
• Order Blocks provide additional validation: For example, a buy signal generated near a Buyer Order Block carries more weight, as it aligns both with the ATR-based momentum and a key support area.
4. Improving Entry and Exit Strategies:
• Entry Points: The indicator generates buy (long) signals when the price crosses above the ATR trailing stop and sell (short) signals when it crosses below. These signals are enhanced by considering their proximity to order blocks, ensuring trades are initiated at strategic price levels.
• Exit Points: The ATR trailing stop provides a dynamic exit strategy, allowing trades to run while adjusting to market volatility. Traders can also use order blocks as targets or potential reversal points to exit trades.
5. Providing a Comprehensive Trading Tool:
• This indicator is unique in its integration of volatility and price level analysis, offering a well-rounded approach to trading. It combines the best of both worlds: trend-following momentum with the ATR and price action sensitivity through order blocks, making it suitable for different market conditions and trading styles.
How to Use the Indicator:
• Set the Parameters:
• Choose an ATR Period (default is 10) to define the number of bars for ATR calculation.
• Set the ATR Multiplier (default is 1.5) to adjust the sensitivity of the trailing stop.
• Define the Order Block Lookback Period (default is 20) to determine how many bars back the script will search for order blocks. Recommended 50.
• Interpret the Signals:
• BUY Signal: When the price crosses above the ATR trailing stop, indicating upward momentum. Confirm this signal by checking if it is near a Buyer Order Block.
• SELL Signal: When the price crosses below the ATR trailing stop, indicating downward momentum. Look for proximity to a Seller Order Block for added confidence.
• Monitor and Manage Trades:
• Use the ATR trailing stop for dynamic stop-loss placement.
• Watch for price action around the order blocks to make informed decisions about taking profits or cutting losses.
Conclusion:
The ATR+Order Block Indicator combines volatility and price action analysis in a unique way that offers traders a comprehensive tool for making informed trading decisions. By leveraging the strengths of both ATR-based dynamic stops and order block detection, it provides a balanced approach to trend-following and support/resistance trading, enhancing overall trading effectiveness and confidence.

Kijun_ATROVERVIEW
Kijun + ATR is an indicator that combines Lagging Kijun Base Line From Ichimoku Cloud (direction indicator) and Volatility Indicator ATR.
By combining ATR with kijun we can filter out noise from Base Line.
CALCULATIONS
Kijun is calculated by taking average of lowest and highest point of price over set lenght.
ATR is just default Tradingview Indicator that calculates average true range of price over set period of time.
WORKING
When both close > lower and not close < upper are true indicator indicate long by color limeand indicates short when close < upper by color fuchsia (Color can be changed in settings)
Indicator works best in Trending Market Regimes can have problems by signaling tops in Consolidating Market Regimes during bear markets and by sygnaling bottom in short consolidating market regimes during bull market.

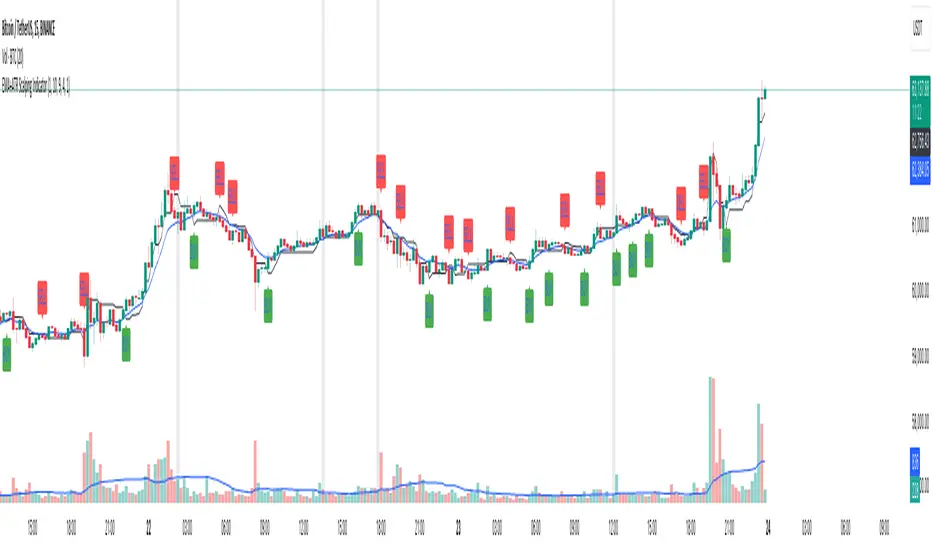
Dema AFR | viResearchDema AFR | viResearch
Conceptual Foundation and Innovation
The "Dema AFR" indicator combines the Double Exponential Moving Average (DEMA) with an Average True Range (ATR)-based adaptive factor to create a responsive and adaptable trend-following system. The DEMA is known for its ability to smooth price data while reducing lag, making it highly effective for trend detection. By incorporating the ATR as a volatility factor, this indicator adapts dynamically to market conditions, allowing traders to capture trends while accounting for changes in volatility. The result is the Adaptive Factor Range (AFR), which provides clear signals for potential trend shifts and helps manage risk through its adaptive nature. This combination of DEMA smoothing and an ATR-based factor enables traders to follow trends more effectively while maintaining sensitivity to changing market conditions.
Technical Composition and Calculation
The "Dema AFR" script consists of two main components: the Double Exponential Moving Average (DEMA) and the Adaptive Factor Range (AFR). The DEMA is calculated over a user-defined length, smoothing out price fluctuations while reducing lag compared to traditional moving averages. The ATR is used to create a dynamic factor that adjusts the AFR based on market volatility. The factor is calculated by multiplying the ATR by a user-defined factor value, which scales the ATR to define upper and lower bounds for the AFR. The Adaptive Factor Range is derived from the DEMA, with upper and lower bounds set by adding or subtracting the ATR-based factor from the DEMA. When the price moves outside these bounds, the AFR is adjusted, and signals are generated. If the lower bound is exceeded, the AFR adjusts upward, while exceeding the upper bound causes the AFR to adjust downward. This dynamic adjustment helps the indicator stay responsive to market movements.
Features and User Inputs
The "Dema AFR" script provides several customizable inputs, allowing traders to tailor the indicator to their strategies. The DEMA Length controls the smoothing period for the DEMA, while the ATR Period defines the window for calculating the Average True Range. The ATR Factor determines the scale of the adaptive factor, controlling how much the AFR adjusts to volatility. Additionally, customizable bar colors and alert conditions allow traders to visualize the trend direction and receive notifications when key trend shifts occur.
Practical Applications
The "Dema AFR" indicator is designed for traders who want to capture trends while adapting to market volatility. The adaptive nature of the AFR makes it responsive to trend changes, providing early signals of potential trend reversals as the AFR adjusts to market movements. By incorporating ATR into the AFR calculation, the indicator adjusts to changing volatility, helping traders manage risk by staying aligned with market conditions. The AFR also helps confirm whether a price move is supported by momentum, improving the accuracy of trade entries and exits.
Advantages and Strategic Value
The "Dema AFR" script offers a significant advantage by combining the smoothness of the DEMA with the adaptability of the ATR-based factor. This dynamic combination allows the indicator to adjust to market conditions, providing more reliable trend signals in both trending and volatile markets. The adaptive nature of the AFR reduces the risk of false signals and helps traders stay on the right side of the trend while managing risk through volatility-adjusted ranges.
Alerts and Visual Cues
The script includes alert conditions that notify traders of key trend changes. The "Dema AFR Long" alert is triggered when the AFR indicates a potential upward trend, while the "Dema AFR Short" alert signals a potential downward trend. Visual cues such as color changes in the bar chart help traders quickly identify shifts in trend direction, allowing them to make informed decisions in real time.
Summary and Usage Tips
The "Dema AFR | viResearch" indicator provides traders with a powerful tool for trend analysis by combining DEMA smoothing with an ATR-based adaptive factor. This script helps traders stay aligned with trends while accounting for market volatility, improving their ability to detect trend reversals and manage risk. By incorporating this indicator into your trading strategy, you can make more informed decisions, whether in trending or volatile market environments. The "Dema AFR" offers a reliable and flexible solution for traders at all levels.
Note: Backtests are based on past results and are not indicative of future performance.

Trailing Stop ProTrailing Stop Pro is a sophisticated TradingView indicator designed to enhance your trading strategy by dynamically managing trailing stops based on market volatility. This tool leverages the Average True Range (ATR) to adjust stop levels, providing traders with a robust mechanism to protect profits and minimize losses.
Key Features:
Dynamic Trailing Stops: Automatically adjusts stop levels using ATR, allowing for responsive and adaptive risk management.
Customizable Inputs: Tailor the indicator to your trading style with adjustable parameters such as ATR Length, ATR Multiplier, and Source Vector.
Visual Clarity: Distinct color settings for long and short stops, with adjustable line thickness and transparency, ensuring clear visualization on your charts.
Professional Grade: The "Pro" designation signifies advanced features suitable for both novice and experienced traders seeking reliable and efficient stop management.
How It Works:
To set up the indicator, begin by defining the Chrono Point, which specifies the exact time you want the trailing stop mechanism to activate. This allows for precise control over when your stops begin to trail. Next, set the Credit Unit as the initial entry price for your trade, serving as the baseline from which the trailing stops will adjust.
The indicator uses ATR-based adjustments to determine stop levels. Customize the sensitivity of the trailing stop by adjusting the ATR Length (default is 14) and ATR Multiplier (default is 0.5). A longer ATR length smooths out volatility, while a higher multiplier increases the distance of the stop from the price.
Select your Source Vector from "High/Low," "Close," or "Open" prices as the basis for stop calculation. This flexibility allows you to align the indicator with your preferred trading strategy. The indicator plots trailing stops directly on the chart, with color-coded lines indicating long (teal) and short (red) positions. You can adjust the line thickness and transparency for optimal visibility.
The Mission Status feature automatically detects whether the trade is long or short and adjusts the trailing stop accordingly. If the price hits the trailing stop, the trade is considered exited, and the indicator calculates the profit or loss percentage.
Benefits:
Risk Management: Protect your trades from adverse market movements while locking in profits as prices move favorably.
Automation: Reduce manual intervention with automatic stop adjustments, allowing you to focus on strategic decision-making.
User-Friendly Interface: Intuitive settings and clear visual cues make it easy to integrate into your existing trading workflow.
Conclusion:
Trailing Stop Pro is an essential tool for traders looking to enhance their risk management strategies with precision and ease. By automating the trailing stop process and providing clear visual feedback, this indicator empowers you to navigate the markets with confidence. Whether you're a seasoned trader or just starting, Trailing Stop Pro offers the functionality and flexibility needed to optimize your trading performance.
The Trailing Stop Pro indicator is a tool designed to assist traders in managing risk and optimizing their trading strategies. However, it should not be considered as financial advice or a guarantee of profitability. Trading involves significant risk, and it is possible to lose more than your initial investment. Users are encouraged to thoroughly test the indicator in a demo environment and consider their own financial situation and risk tolerance before using it in live trading. Past performance is not indicative of future results, and users should seek advice from a qualified financial advisor if needed.

DataDoodles ATR RangeThe "DataDoodles ATR Range" indicator provides a comprehensive visual representation of the Average True Range (ATR) levels based on the previous bar's close price . It includes both the raw ATR and an Exponential Moving Average (EMA) of the ATR to offer a smoother view of the range volatility. This indicator is ideal for traders who want to quickly assess potential price movements relative to recent volatility.
Key Features:
ATR Levels Above and Below Close: The indicator calculates and displays three levels of ATR-based ranges above and below the previous close price. These levels are visualized on the chart using distinct colors:
- 1ATR Above/Below
- 2ATR Above/Below
- 3ATR Above/Below
EMA of ATR
Includes the EMA of ATR to provide a smoother trend of the ATR values, helping traders identify long-term volatility trends.
Color-Coded Ranges: The plotted ranges are color-coded for easy identification, with warm gradient tones applied to the corresponding data table for quick reference.
Customizable Table: A data table is displayed at the bottom right corner of the chart, providing real-time values for ATR, EMA ATR, and the various ATR ranges.
Usage
This indicator is useful for traders who rely on volatility analysis to set stop losses, take profit levels, or simply understand the current market conditions. By visualizing ATR ranges directly on the chart, traders can better anticipate potential price movements and adjust their strategies accordingly.
Customization
ATR Length: The default ATR length is set to 14 but can be customized to fit your trading strategy.
Table Positioning: The data table is placed in the bottom right corner by default but can be moved as needed.
How to Use
Add the "DataDoodles ATR Range" indicator to your chart.
Observe the plotted lines for potential support and resistance levels based on recent volatility.
Use the data table for quick reference to ATR values and range levels.
Disclaimer: This indicator is a tool for analysis and should be used in conjunction with other indicators and analysis methods. Always practice proper risk management and consider market conditions before making trading decisions.

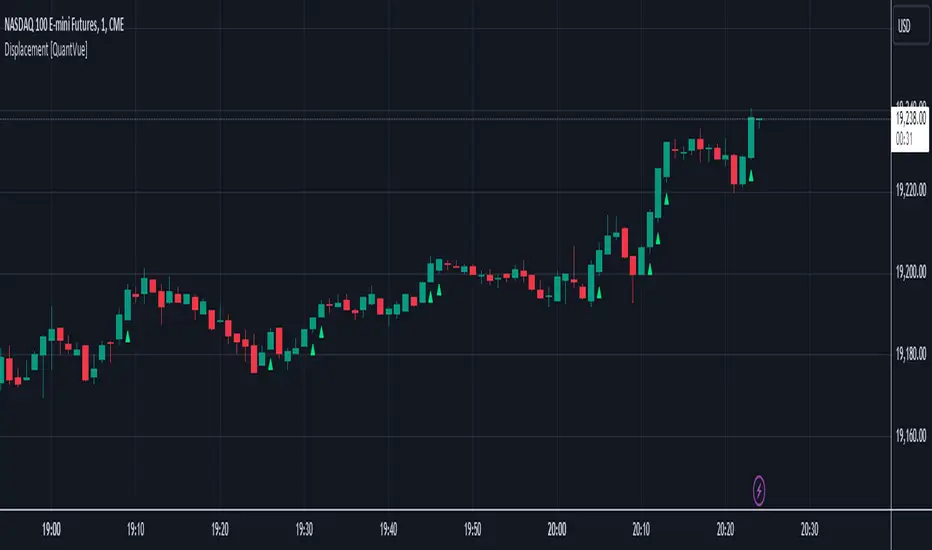
Displacement [QuantVue]Displacement refers to a significant and forceful price movement that indicates a potential shift in market sentiment or trend. Displacement is characterized by a strong push in price action, often seen after a period of consolidation or within a trending market. It is a key concept used to identify the strength of a move and to confirm the direction of the market.
The "Displacement" indicator does this by focusing on identifying strong, directional price movements by combining candlestick analysis with volatility (ATR).
Displacement often appears as a group of candles that are all positioned in the same direction, these candles typically have large bodies and short wicks.
How the indicator works:
Body Size Requirement: Ensures that only candles with a significant body size (relative to their total range) are considered, helping to identify strong market moves.
Consecutive Candle Analysis: Identifies shifts in market sentiment by requiring a series of consecutive bullish or bearish candles to confirm a potential change in trend.
ATR-Based Analysis: Uses the Average True Range (ATR) to gauge market volatility and filter out minor price fluctuations, focusing on substantial movements.
Once all of the requirements are met a triangle is plotted above or below the bar.
Trend Signals with TP & SL [UAlgo] StrategyThe "Trend Signals with TP & SL Strategy" is a trading strategy designed to capture trend continuation signals while incorporating sophisticated risk management techniques. This strategy is tailored for traders who wish to capitalize on trending market conditions with precise entry and exit points, automatically calculating Take Profit (TP) and Stop Loss (SL) levels based on either Average True Range (ATR) or percentage values. The strategy aims to enhance trade management by preventing multiple simultaneous positions and dynamically adapting to changing market conditions.
This strategy is highly configurable, allowing traders to adjust sensitivity, the ATR calculation method, and the cloud moving average length. Additionally, the strategy can display buy and sell signals directly on the chart, along with visual representation of entry points, stop losses, and take profits. It also features a cloud-based trend analysis using a MACD-driven color fill that indicates the strength and direction of the trend.
🔶 Key Features
Configurable Trend Continuation Signals:
Source Selection: The strategy uses the midpoint of the high-low range as the default source, but it is adjustable.
Sensitivity: The sensitivity of the trend signals can be adjusted using a multiplier, ranging from 0.5 to 5.
ATR Calculation: The strategy allows users to choose between two ATR calculation methods for better adaptability to different market conditions.
Cloud Moving Average: Traders can adjust the cloud moving average length, which is used in conjunction with MACD to provide a visual trend indication.
Take Profit & Stop Loss Management:
ATR-Based or Percent-Based: The strategy offers flexibility in setting TP and SL levels, allowing traders to choose between ATR-based multipliers or fixed percentage values.
Dynamic Adjustment: TP and SL levels are dynamically adjusted according to the selected method, ensuring trades are managed based on real-time market conditions.
Prevention of Multiple Positions:
Single Position Control: To reduce risk and enhance strategy reliability, the strategy includes an option to prevent multiple positions from being opened simultaneously.
Visual Trade Indicators:
Buy/Sell Signals: Clearly displays buy and sell signals on the chart for easy interpretation.
Entry, SL, and TP Lines: Draws lines for entry price, stop loss, and take profit directly on the chart, helping traders to monitor trades visually.
Trend Cloud: A color-filled cloud based on MACD and the cloud moving average provides a visual cue of the trend’s direction and strength.
Performance Summary Table:
In-Chart Statistics: A table in the top right of the chart displays key performance metrics, including total trades, wins, losses, and win rate percentage, offering a quick overview of the strategy’s effectiveness.
🔶 Interpreting the Indicator
Trend Signals: The strategy identifies trend continuation signals based on price action relative to an ATR-based threshold. A buy signal is generated when the price crosses above a key level, indicating an uptrend. Conversely, a sell signal occurs when the price crosses below a level, signaling a downtrend.
Cloud Visualization: The cloud, derived from MACD and moving averages, changes color to reflect the current trend. A positive cloud in aqua suggests an uptrend, while a red cloud indicates a downtrend. The transparency of the cloud offers further nuance, with more solid colors denoting stronger trends.
Entry and Exit Management: Once a trend signal is generated, the strategy automatically sets TP and SL levels based on your chosen method (ATR or percentage). The stop loss and take profit lines will appear on the chart, showing where the strategy will exit the trade. If the price reaches either the SL or TP, the trade is closed, and the respective line is deleted from the chart.
Performance Metrics: The strategy’s performance is tracked in real-time with an in-chart table. This table provides essential information about the number of trades executed, the win/loss ratio, and the overall win rate. This information helps traders assess the strategy's effectiveness and make necessary adjustments.
This strategy is designed for those who seek to engage with trending markets, offering robust tools for entry, exit, and overall trade management. By understanding and leveraging these features, traders can potentially improve their trading outcomes and risk management.
🔷 Related Script
🔶 Disclaimer
Use with Caution: This indicator is provided for educational and informational purposes only and should not be considered as financial advice. Users should exercise caution and perform their own analysis before making trading decisions based on the indicator's signals.
Not Financial Advice: The information provided by this indicator does not constitute financial advice, and the creator (UAlgo) shall not be held responsible for any trading losses incurred as a result of using this indicator.
Backtesting Recommended: Traders are encouraged to backtest the indicator thoroughly on historical data before using it in live trading to assess its performance and suitability for their trading strategies.
Risk Management: Trading involves inherent risks, and users should implement proper risk management strategies, including but not limited to stop-loss orders and position sizing, to mitigate potential losses.
No Guarantees: The accuracy and reliability of the indicator's signals cannot be guaranteed, as they are based on historical price data and past performance may not be indicative of future results.

EMA+ATR Scalping Indicator by TradeTechIndicator Description: “EMA+ATR Scalping Indicator by Tradetech”
The “EMA+ATR Scalping Indicator” is a powerful tool designed to help traders identify optimal entry and exit points in the market, focusing on high-probability scalping opportunities. This indicator combines the strength of the Exponential Moving Average (EMA) with the Average True Range (ATR) to generate precise signals, aiming to maximize profits while minimizing risk.
Key Features:
• Sensitivity Key Value: Allows customization of the ATR multiplier, fine-tuning the trailing stop level for different market conditions.
• ATR Calculation: Measures market volatility over a specified period, dynamically adjusting the trailing stop to capture significant price moves while reducing noise.
• EMA for Confirmation: The 20-period EMA is used as a trend filter, ensuring that trades are aligned with the prevailing market direction.
• Trade Cooldown Period: Prevents over-trading by enforcing a minimum number of bars between consecutive trades, reducing the likelihood of whipsaws.
• Flat ATR Threshold: Identifies periods of low volatility (flat ATR), during which trading is avoided to protect against false signals.
Trading Logic:
• Entry Signals: The indicator generates long signals when the price crosses above the ATR trailing stop or breaks out consecutively in an uptrend, with the EMA confirming the bullish trend. Short signals are generated when the price crosses below the ATR trailing stop or consecutively breaks out in a downtrend, with the EMA confirming the bearish trend.
• Exit Signals: The exit points are defined by the ATR trailing stop, which adjusts dynamically with market conditions, ensuring that profits are locked in as the trend evolves.
• No Trading Zone: When the ATR is flat, indicating low volatility, the indicator displays a “No Trading Zone” to prevent taking positions in uncertain market conditions.
Why Combine EMA + ATR?
The combination of EMA and ATR in this indicator is crucial for several reasons:
1. Trend Identification (EMA): The EMA acts as a reliable trend filter, ensuring that trades are taken in the direction of the prevailing trend. By doing so, the indicator avoids taking trades against the momentum, which could result in lower probability setups.
2. Volatility-Based Trailing Stop (ATR): The ATR provides a volatility-adjusted stop-loss level, which is essential in scalping strategies where market conditions can change rapidly. This allows the trailing stop to widen during periods of high volatility and tighten during low volatility, optimizing the trade management process.
3. Enhanced Accuracy: By combining the EMA and ATR, the indicator filters out noise and avoids entering trades during flat market conditions, where the probability of false signals is higher. This synergy between trend and volatility creates a more robust and accurate scalping tool.
4. Dynamic Trade Management: The use of ATR for setting trailing stops ensures that the trade exits are dynamic and adaptable to current market conditions, maximizing the potential for capturing significant moves while minimizing drawdowns.
Overall, the EMA + ATR combination within the “EMA+ATR Scalping Indicator” provides a well-rounded approach to scalping, balancing trend-following with volatility management for more consistent trading results.
ATR Range High/Low LevelsATR High/Low Levels Indicator - Detailed Description
Overview:
The ATR High/Low Levels Indicator is designed to help traders identify potential support and resistance levels based on the Average True Range (ATR). This indicator calculates and plots two key levels: the ATR High and ATR Low. These levels represent dynamic potential points of reversal or continuation, derived from the ATR, a volatility-based measure that reflects the degree of price movement in a given timeframe.
How It Works:
ATR Calculation:
- The ATR is calculated over a user-defined period (default is 14) using the selected timeframe (default is 1 day). The ATR measures the average range of price movement over the specified period, providing an indication of market volatility.
ATR High/Low Levels:
- ATR High Level: This is calculated by adding the ATR value to the closing price of the selected timeframe. It represents a potential resistance level.
- ATR Low Level: This is calculated by subtracting the ATR value from the closing price of the selected timeframe. It represents a potential support level.
Dynamic Plotting:
- The script dynamically plots lines for the ATR High and ATR Low levels on the chart. These lines can extend left, right, both, or none depending on user preferences, providing a visual guide for potential support and resistance.
Label Display:
- The indicator also displays labels for the ATR High and ATR Low levels, allowing traders to see the exact price values of these levels. These labels are positioned to the right of the current bar, ensuring clear visibility.
Customisation Options:
- Timeframe: Users can select the timeframe for ATR calculation (e.g., daily, weekly).
- Line Extension: Users can choose how the lines are extended: to the left, right, both, or not at all.
- Colour Customisation: Traders can customise the colour of the ATR High and Low lines and labels to match their chart's colour scheme.
- Label Offset: The position of the labels can be adjusted to the right of the current bar, providing flexibility in how they appear on the chart.
Trading Concepts:
- Volatility-Based Levels: The ATR High and Low levels provide insights into potential areas of market reaction. In volatile markets, these levels may serve as points where price may encounter resistance or support.
- Support and Resistance: The ATR High level can act as a resistance level where price might struggle to break above, while the ATR Low level can act as a support level where price might find a floor.
How to Use:
Identify Market Conditions: Use the ATR levels to gauge potential areas of interest on your chart. The ATR High level could indicate a resistance area, while the ATR Low level might suggest a support zone.
Entry and Exit Points: Traders can use these levels as reference points for entering or exiting trades. For example, consider shorting near the ATR High level in a downtrend or buying near the ATR Low level in an uptrend.
Combine with Other Indicators: For enhanced analysis, combine this indicator with other technical tools, such as moving averages, RSI, or MACD, to confirm potential trading signals.
Conclusion:
The ATR High/Low Levels Indicator is a versatile tool that leverages market volatility to highlight potential support and resistance levels. By providing a visual representation of these levels, it assists traders in making informed decisions based on price action and market dynamics. Whether you are trading trends, breakouts, or reversals, this indicator offers valuable insights into potential price levels where the market may react. Customise the settings to fit your trading style and integrate it into your overall trading strategy for better market analysis.

Multi-Factor StrategyThis trading strategy combines multiple technical indicators to create a systematic approach for entering and exiting trades. The goal is to capture trends by aligning several key indicators to confirm the direction and strength of a potential trade. Below is a detailed description of how the strategy works:
Indicators Used
MACD (Moving Average Convergence Divergence):
MACD Line: The difference between the 12-period and 26-period Exponential Moving Averages (EMAs).
Signal Line: A 9-period EMA of the MACD line.
Usage: The strategy looks for crossovers between the MACD line and the Signal line as entry signals. A bullish crossover (MACD line crossing above the Signal line) indicates a potential upward movement, while a bearish crossover (MACD line crossing below the Signal line) signals a potential downward movement.
RSI (Relative Strength Index):
Usage: RSI is used to gauge the momentum of the price movement. The strategy uses specific thresholds: below 70 for long positions to avoid overbought conditions and above 30 for short positions to avoid oversold conditions.
ATR (Average True Range):
Usage: ATR measures market volatility and is used to set dynamic stop-loss and take-profit levels. A stop loss is set at 2 times the ATR, and a take profit at 3 times the ATR, ensuring that risk is managed relative to market conditions.
Simple Moving Averages (SMA):
50-day SMA: A short-term trend indicator.
200-day SMA: A long-term trend indicator.
Usage: The strategy uses the relationship between the 50-day and 200-day SMAs to determine the overall market trend. Long positions are taken when the price is above the 50-day SMA and the 50-day SMA is above the 200-day SMA, indicating an uptrend. Conversely, short positions are taken when the price is below the 50-day SMA and the 50-day SMA is below the 200-day SMA, indicating a downtrend.
Entry Conditions
Long Position:
-MACD Crossover: The MACD line crosses above the Signal line.
-RSI Confirmation: RSI is below 70, ensuring the asset is not overbought.
-SMA Confirmation: The price is above the 50-day SMA, and the 50-day SMA is above the 200-day SMA, indicating a strong uptrend.
Short Position:
MACD Crossunder: The MACD line crosses below the Signal line.
RSI Confirmation: RSI is above 30, ensuring the asset is not oversold.
SMA Confirmation: The price is below the 50-day SMA, and the 50-day SMA is below the 200-day SMA, indicating a strong downtrend.
Opposite conditions for shorts
Exit Strategy
Stop Loss: Set at 2 times the ATR from the entry price. This dynamically adjusts to market volatility, allowing for wider stops in volatile markets and tighter stops in calmer markets.
Take Profit: Set at 3 times the ATR from the entry price. This ensures a favorable risk-reward ratio of 1:1.5, aiming for higher rewards on successful trades.
Visualization
SMAs: The 50-day and 200-day SMAs are plotted on the chart to visualize the trend direction.
MACD Crossovers: Bullish and bearish MACD crossovers are highlighted on the chart to identify potential entry points.
Summary
This strategy is designed to align multiple indicators to increase the probability of successful trades by confirming trends and momentum before entering a position. It systematically manages risk with ATR-based stop loss and take profit levels, ensuring that trades are exited based on market conditions rather than arbitrary points. The combination of trend indicators (SMAs) with momentum and volatility indicators (MACD, RSI, ATR) creates a robust approach to trading in various market environments.

Negroni Opening Range StrategyStrategy Summary:
This tool can be used to help identify breakouts from a range during a time-zone of your choosing. It plots a pre-market range, an opening range, it also includes moving average levels that can be used as confluence, as well as plotting previous day SESSION highs and lows.
There are several options on how you wish to close out the trades, all described in more detail below.
Back-testing Inputs:
You define your timezone.
You define how many trades to open on any given day.
You decide to go: long only, short only, or long & short (CAREFUL: "Long & Short" can open trades that effectively closes-out existing ones, for better AND worse!)
You define between which times the strategy will open trades.
You define when it closes any open trades (preventing overnight trades, or leaving trades open into US data times!!).
This hopefully helps make back-testing reflect YOUR trading hours.
NOTE: Renko or Heikin-Ashi charts
For ALL strategies, don’t use Renko or Heikin-Ashi charts unless you know EXACTLY the implications.
Specific to my strategy, using a renko chart can make this 85-90% profitable (I wish it was!!) Although they can be useful, renko charts don’t always capture real wicks, so the renko chart may show your trade up-only but your broker (who is not using renko!!) will have likely stopped you out on a wick somewhere along the line.
NOTE: TradingView ‘Deep backtesting’
For ALL strategies, be cynical of all backtesting (e.g. repainting issues etc) as well as ‘Deep backtesting’ results.
Specific to this strategy, the default settings here SHOULD BE OK, but unfortunately at the time of writing, we can’t see on the chart what exactly ‘deep backtesting’ is calculating. In the past I have noted a number of trades that were not closed at the end of the day, despite my ‘end of day’ trade closing being enabled, so there were big winners and losers that would not have materialized otherwise. As I say, this seems ok at these settings but just always be cynical!!
Opening Range Inputs
You define a pre-market range (example: 08:00 - 09:00).
You define an opening range (example: 09:00 - 09:30).
The strategy will give an update at the close of the opening range to let you know if the opening range has broken out the pre-market range (OR Breakout), or if it has remained inside (OR Inside). The label appears at the end of the opening range NOT at the bar that ‘broke-out’.
This is just a visual cue for you, it has no bearing on what the strategy will do.
The strategy default will trade off the pre-market range, but you can untick this if you prefer to trade off the opening range.
Opening Trades:
Strategy goes long when the bar (CLOSE) crosses-over the ‘pre-market’ high (not the ‘opening range’ high); and the time is within your trading session, and you have not maxed out your number of trades for the day!
Strategy goes short when the bar (CLOSE) crosses-under the ‘pre-market’ low (not the ‘opening range low); and the time is within your trading session, and you have not maxed out your number of trades for the day!
Remember, you can untick this if you prefer to trade off the opening range instead.
NOTES:
Using momentum indicators can help (RSI and MACD): especially to trade range plays in failed breakouts, when momentum shifts… but the strategy won’t do this for you!
Using an anchored vwap at the session open can also provide nice confluence, as well as take-profit levels at the upper/lower of 3x standard deviation.
CLOSING TRADES:
You have 6 take-profit (TP) options:
1) Full TP: uses ATR Multiplier - Full TP at the ATR parameters as defined in inputs.
2) Take Partial profits: ATR Multiplier - Takes partial profits based on parameters as defined in inputs (i.e close 40% of original trade at TP1, close another 40% of original trade at TP2, then the remainder at Full TP as set in option 1.).
3) Full TP: Trailing Stop - Applies a Trailing Stop at the number of points, as defined in inputs.
4) Full TP: MA cross - Takes profit when price crosses ‘Trend MA’ as defined in inputs.
5) Scalp: Points - closes at a set number of points, as defined in inputs.
6) Full TP: PMKT Multiplier - places a SL at opposite pre-market Hi/Low (we go long at a break-out of the pre-market high, 50% would place a SL at the pre-market range mid-point; 100% would place a SL at the pre-market low)'. This takes profit at the input set in option 1).

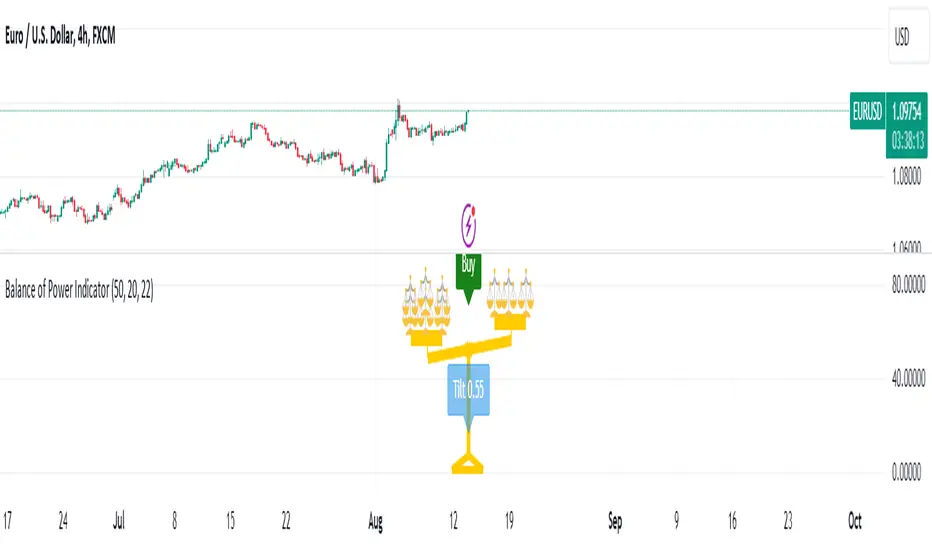
Balance of Power [Pinescriptlabs]Balance of Power Indicator ⚖️
The Balance of Power Indicator is a visual tool that illustrates the power dynamics between buyers and sellers by analyzing recent price action. Instead of providing direct buy or sell signals, this indicator shows how the tilt of a symbolic scale reflects the relative strength of both parties. The calculation is based on the difference between the current closing price and the closing price from a specific number of periods (defined by the user), adjusted for market volatility measured by the ATR (Average True Range).
Tilt Value Interpretation:
• Positive Tilt (0 to 1) 📈:
o A tilt value close to 1 indicates significant control by buyers. The current price is well above the average adjusted for recent volatility. Practically, a tilt in the range of 0.50 to 1 suggests buyers are pushing the price above the average volatility, signaling a strong bullish trend.
•
o
• Negative Tilt (-1 to 0) 📉:
o A tilt value close to -1 indicates significant control by sellers. The current price has dropped notably compared to the average adjusted for recent volatility. A tilt in the range of -0.50 to -1 suggests sellers are dominating, with the price falling below the average volatility, reflecting a strong bearish trend.
o
Neutral:
Indicator Sensitivity:
The number of periods analyzed affects the sensitivity of the indicator:
• Shorter Periods: Make the indicator respond more quickly to price changes.
• Longer Periods: Smooth out the tilt, providing a more stable view of market forces.
Visualizing Relative Power:
The balance not only shows the general direction of power between buyers and sellers but also the intensity of this pressure. By adding more small balances, the indicator visually represents greater strength in the corresponding direction. Thus, the Balance of Power provides an overview of the balance between supply and demand, and allows for a visual assessment of the magnitude of that pressure based on the scale’s tilt.
Español
Indicador de Balance de Poder ⚖️
El Indicador de Balance de Poder es una herramienta visual que ilustra la dinámica de poder entre compradores y vendedores mediante el análisis de la acción reciente del precio. En lugar de proporcionar señales directas de compra o venta, este indicador muestra cómo la inclinación de una balanza simbólica refleja la fuerza relativa de ambas partes. El cálculo se basa en la diferencia entre el precio de cierre actual y el precio de cierre de un número específico de períodos (definidos por el usuario), ajustado por la volatilidad del mercado medida por el ATR (Average True Range).
#### **Interpretación del Valor de Tilt(inclinación):**
- Tilt Positivo (0 a 1) 📈:
- Un valor de inclinación cercano a **1** indica un control significativo por parte de los compradores. El precio actual está muy por encima del promedio ajustado por la volatilidad reciente. En términos prácticos, un tilt en el rango de **0.50 a 1** sugiere que los compradores están impulsando el precio por encima de la volatilidad promedio, señalando una fuerte tendencia alcista.
- **Tilt Negativo (-1 a 0) 📉:**
- Un valor de inclinación cercano a **-1** indica un control significativo por parte de los vendedores. El precio actual ha caído notablemente en comparación con el promedio ajustado por la volatilidad reciente. Un tilt en el rango de **-0.50 a -1** sugiere que los vendedores están dominando, con el precio cayendo por debajo de la volatilidad promedio, reflejando una fuerte tendencia bajista.
- **Neutral:**
**Sensibilidad del Indicador:**
El número de períodos analizados afecta la sensibilidad del indicador:
- **Períodos más cortos:** Hacen que el indicador responda más rápidamente a los cambios en el precio.
- **Períodos más largos:** Suavizan la inclinación, proporcionando una visión más estable de las fuerzas del mercado.
#### **Visualización del Poder Relativo:**
La balanza no solo muestra la dirección general del poder entre compradores y vendedores, sino también la intensidad de esta presión. Al agregar más pequeñas balanzas, el indicador representa visualmente una mayor fuerza en la dirección correspondiente. Así, el **Balance de Poder** proporciona una visión general del equilibrio entre oferta y demanda y permite una evaluación visual de la magnitud de esa presión basada en la inclinación de la balanza.
Multi-Step FlexiSuperTrend - Strategy [presentTrading]At the heart of this endeavor is a passion for continuous improvement in the art of trading
█ Introduction and How it is Different
The "Multi-Step FlexiSuperTrend - Strategy " is an advanced trading strategy that integrates the well-known SuperTrend indicator with a nuanced and dynamic approach to market trend analysis. Unlike conventional SuperTrend strategies that rely on static thresholds and fixed parameters, this strategy introduces multi-step take profit mechanisms that allow traders to capitalize on varying market conditions in a more controlled and systematic manner.
What sets this strategy apart is its ability to dynamically adjust to market volatility through the use of an incremental factor applied to the SuperTrend calculation. This adjustment ensures that the strategy remains responsive to both minor and major market shifts, providing a more accurate signal for entries and exits. Additionally, the integration of multi-step take profit levels offers traders the flexibility to scale out of positions, locking in profits progressively as the market moves in their favor.
BTC 6hr Long/Short Performance
█ Strategy, How it Works: Detailed Explanation
The Multi-Step FlexiSuperTrend strategy operates on the foundation of the SuperTrend indicator, but with several enhancements that make it more adaptable to varying market conditions. The key components of this strategy include the SuperTrend Polyfactor Oscillator, a dynamic normalization process, and multi-step take profit levels.
🔶 SuperTrend Polyfactor Oscillator
The SuperTrend Polyfactor Oscillator is the heart of this strategy. It is calculated by applying a series of SuperTrend calculations with varying factors, starting from a defined "Starting Factor" and incrementing by a specified "Increment Factor." The indicator length and the chosen price source (e.g., HLC3, HL2) are inputs to the oscillator.
The SuperTrend formula typically calculates an upper and lower band based on the average true range (ATR) and a multiplier (the factor). These bands determine the trend direction. In the FlexiSuperTrend strategy, the oscillator is enhanced by iteratively applying the SuperTrend calculation across different factors. The iterative process allows the strategy to capture both minor and significant trend changes.
For each iteration (indexed by `i`), the following calculations are performed:
1. ATR Calculation: The Average True Range (ATR) is calculated over the specified `indicatorLength`:
ATR_i = ATR(indicatorLength)
2. Upper and Lower Bands Calculation: The upper and lower bands are calculated using the ATR and the current factor:
Upper Band_i = hl2 + (ATR_i * Factor_i)
Lower Band_i = hl2 - (ATR_i * Factor_i)
Here, `Factor_i` starts from `startingFactor` and is incremented by `incrementFactor` in each iteration.
3. Trend Determination: The trend is determined by comparing the indicator source with the upper and lower bands:
Trend_i = 1 (uptrend) if IndicatorSource > Upper Band_i
Trend_i = 0 (downtrend) if IndicatorSource < Lower Band_i
Otherwise, the trend remains unchanged from the previous value.
4. Output Calculation: The output of each iteration is determined based on the trend:
Output_i = Lower Band_i if Trend_i = 1
Output_i = Upper Band_i if Trend_i = 0
This process is repeated for each iteration (from 0 to 19), creating a series of outputs that reflect different levels of trend sensitivity.
Local
🔶 Normalization Process
To make the oscillator values comparable across different market conditions, the deviations between the indicator source and the SuperTrend outputs are normalized. The normalization method can be one of the following:
1. Max-Min Normalization: The deviations are normalized based on the range of the deviations:
Normalized Value_i = (Deviation_i - Min Deviation) / (Max Deviation - Min Deviation)
2. Absolute Sum Normalization: The deviations are normalized based on the sum of absolute deviations:
Normalized Value_i = Deviation_i / Sum of Absolute Deviations
This normalization ensures that the oscillator values are within a consistent range, facilitating more reliable trend analysis.
For more details:
🔶 Multi-Step Take Profit Mechanism
One of the unique features of this strategy is the multi-step take profit mechanism. This allows traders to lock in profits at multiple levels as the market moves in their favor. The strategy uses three take profit levels, each defined as a percentage increase (for long trades) or decrease (for short trades) from the entry price.
1. First Take Profit Level: Calculated as a percentage increase/decrease from the entry price:
TP_Level1 = Entry Price * (1 + tp_level1 / 100) for long trades
TP_Level1 = Entry Price * (1 - tp_level1 / 100) for short trades
The strategy exits a portion of the position (defined by `tp_percent1`) when this level is reached.
2. Second Take Profit Level: Similar to the first level, but with a higher percentage:
TP_Level2 = Entry Price * (1 + tp_level2 / 100) for long trades
TP_Level2 = Entry Price * (1 - tp_level2 / 100) for short trades
The strategy exits another portion of the position (`tp_percent2`) at this level.
3. Third Take Profit Level: The final take profit level:
TP_Level3 = Entry Price * (1 + tp_level3 / 100) for long trades
TP_Level3 = Entry Price * (1 - tp_level3 / 100) for short trades
The remaining portion of the position (`tp_percent3`) is exited at this level.
This multi-step approach provides a balance between securing profits and allowing the remaining position to benefit from continued favorable market movement.
█ Trade Direction
The strategy allows traders to specify the trade direction through the `tradeDirection` input. The options are:
1. Both: The strategy will take both long and short positions based on the entry signals.
2. Long: The strategy will only take long positions.
3. Short: The strategy will only take short positions.
This flexibility enables traders to tailor the strategy to their market outlook or current trend analysis.
█ Usage
To use the Multi-Step FlexiSuperTrend strategy, traders need to set the input parameters according to their trading style and market conditions. The strategy is designed for versatility, allowing for various market environments, including trending and ranging markets.
Traders can also adjust the multi-step take profit levels and percentages to match their risk management and profit-taking preferences. For example, in highly volatile markets, traders might set wider take profit levels with smaller percentages at each level to capture larger price movements.
The normalization method and the incremental factor can be fine-tuned to adjust the sensitivity of the SuperTrend Polyfactor Oscillator, making the strategy more responsive to minor market shifts or more focused on significant trends.
█ Default Settings
The default settings of the strategy are carefully chosen to provide a balanced approach between risk management and profit potential. Here is a breakdown of the default settings and their effects on performance:
1. Indicator Length (10): This parameter controls the lookback period for the ATR calculation. A shorter length makes the strategy more sensitive to recent price movements, potentially generating more signals. A longer length smooths out the ATR, reducing sensitivity but filtering out noise.
2. Starting Factor (0.618): This is the initial multiplier used in the SuperTrend calculation. A lower starting factor makes the SuperTrend bands closer to the price, generating more frequent trend changes. A higher starting factor places the bands further away, filtering out minor fluctuations.
3. Increment Factor (0.382): This parameter controls how much the factor increases with each iteration of the SuperTrend calculation. A smaller increment factor results in more gradual changes in sensitivity, while a larger increment factor creates a wider range of sensitivity across the iterations.
4. Normalization Method (None): The default is no normalization, meaning the raw deviations are used. Normalization methods like Max-Min or Absolute Sum can make the deviations more consistent across different market conditions, improving the reliability of the oscillator.
5. Take Profit Levels (2%, 8%, 18%): These levels define the thresholds for exiting portions of the position. Lower levels (e.g., 2%) capture smaller profits quickly, while higher levels (e.g., 18%) allow positions to run longer for more significant gains.
6. Take Profit Percentages (30%, 20%, 15%): These percentages determine how much of the position is exited at each take profit level. A higher percentage at the first level locks in more profit early, reducing exposure to market reversals. Lower percentages at higher levels allow for a portion of the position to benefit from extended trends.

Wedge Pop & Drop [QuantVue]A "Wedge Pop" is a trading pattern popularized by Oliver Kell, a notable trader who won the 2020 US Investing Championship with a remarkable return of 941%. This pattern, often referred to as "The Money Pattern" in his trading strategy, serves as a critical signal indicating the beginning of a new uptrend in a stock.
A Wedge Pop occurs when a stock first trades up through the moving averages after reaching a downside extension. Conversely, a Wedge Drop refers to the first time a stock trades down through the moving averages after reaching an upside extension.
How the Indicator Works:
The indicator uses the Average True Range (ATR) and the 10-period Exponential Moving Average (10 EMA) to identify upside and downside extensions. An upside extension occurs when the low of the current bar is greater than 1.5 (default) times the ATR above the moving average. A downside extension occurs when the high of the current bar is less than 1.5 times the ATR below the moving average.
Once an extension has been reached, the first time the security trades back through the moving averages, it triggers a Wedge Pop/Drop.
Give this indicator a BOOST and COMMENT your thoughts below!
We hope you enjoy.
Cheers!

Bollinger Bands Enhanced StrategyOverview
The common practice of using Bollinger bands is to use it for building mean reversion or squeeze momentum strategies. In the current script Bollinger Bands Enhanced Strategy we are trying to combine the strengths of both strategies types. It utilizes Bollinger Bands indicator to buy the local dip and activates trailing profit system after reaching the user given number of Average True Ranges (ATR). Also it uses 200 period EMA to filter trades only in the direction of a trend. Strategy can execute only long trades.
Unique Features
Trailing Profit System: Strategy uses user given number of ATR to activate trailing take profit. If price has already reached the trailing profit activation level, scrip will close long trade if price closes below Bollinger Bands middle line.
Configurable Trading Periods: Users can tailor the strategy to specific market windows, adapting to different market conditions.
Major Trend Filter: Strategy utilizes 100 period EMA to take trades only in the direction of a trend.
Flexible Risk Management: Users can choose number of ATR as a stop loss (by default = 1.75) for trades. This is flexible approach because ATR is recalculated on every candle, therefore stop-loss readjusted to the current volatility.
Methodology
First of all, script checks if currently price is above the 200-period exponential moving average EMA. EMA is used to establish the current trend. Script will take long trades on if this filtering system showing us the uptrend. Then the strategy executes the long trade if candle’s low below the lower Bollinger band. To calculate the middle Bollinger line, we use the standard 20-period simple moving average (SMA), lower band is calculated by the substruction from middle line the standard deviation multiplied by user given value (by default = 2).
When long trade executed, script places stop-loss at the price level below the entry price by user defined number of ATR (by default = 1.75). This stop-loss level recalculates at every candle while trade is open according to the current candle ATR value. Also strategy set the trailing profit activation level at the price above the position average price by user given number of ATR (by default = 2.25). It is also recalculated every candle according to ATR value. When price hit this level script plotted the triangle with the label “Strong Uptrend” and start trail the price at the middle Bollinger line. It also started to be plotted as a green line.
When price close below this trailing level script closes the long trade and search for the next trade opportunity.
Risk Management
The strategy employs a combined and flexible approach to risk management:
It allows positions to ride the trend as long as the price continues to move favorably, aiming to capture significant price movements. It features a user-defined ATR stop loss parameter to mitigate risks based on individual risk tolerance. By default, this stop-loss is set to a 1.75*ATR drop from the entry point, but it can be adjusted according to the trader's preferences.
There is no fixed take profit, but strategy allows user to define user the ATR trailing profit activation parameter. By default, this stop-loss is set to a 2.25*ATR growth from the entry point, but it can be adjusted according to the trader's preferences.
Justification of Methodology
This strategy leverages Bollinger bangs indicator to open long trades in the local dips. If price reached the lower band there is a high probability of bounce. Here is an issue: during the strong downtrend price can constantly goes down without any significant correction. That’s why we decided to use 200-period EMA as a trend filter to increase the probability of opening long trades during major uptrend only.
Usually, Bollinger Bands indicator is using for mean reversion or breakout strategies. Both of them have the disadvantages. The mean reversion buys the dip, but closes on the return to some mean value. Therefore, it usually misses the major trend moves. The breakout strategies usually have the issue with too high buy price because to have the breakout confirmation price shall break some price level. Therefore, in such strategies traders need to set the large stop-loss, which decreases potential reward to risk ratio.
In this strategy we are trying to combine the best features of both types of strategies. Script utilizes ate ATR to setup the stop-loss and trailing profit activation levels. ATR takes into account the current volatility. Therefore, when we setup stop-loss with the user-given number of ATR we increase the probability to decrease the number of false stop outs. The trailing profit concept is trying to add the beat feature from breakout strategies and increase probability to stay in trade while uptrend is developing. When price hit the trailing profit activation level, script started to trail the price with middle line if Bollinger bands indicator. Only when candle closes below the middle line script closes the long trade.
Backtest Results
Operating window: Date range of backtests is 2020.10.01 - 2024.07.01. It is chosen to let the strategy to close all opened positions.
Commission and Slippage: Includes a standard Binance commission of 0.1% and accounts for possible slippage over 5 ticks.
Initial capital: 10000 USDT
Percent of capital used in every trade: 30%
Maximum Single Position Loss: -9.78%
Maximum Single Profit: +25.62%
Net Profit: +6778.11 USDT (+67.78%)
Total Trades: 111 (48.65% win rate)
Profit Factor: 2.065
Maximum Accumulated Loss: 853.56 USDT (-6.60%)
Average Profit per Trade: 61.06 USDT (+1.62%)
Average Trade Duration: 76 hours
These results are obtained with realistic parameters representing trading conditions observed at major exchanges such as Binance and with realistic trading portfolio usage parameters.
How to Use
Add the script to favorites for easy access.
Apply to the desired timeframe and chart (optimal performance observed on 4h BTC/USDT).
Configure settings using the dropdown choice list in the built-in menu.
Set up alerts to automate strategy positions through web hook with the text: {{strategy.order.alert_message}}
Disclaimer:
Educational and informational tool reflecting Skyrex commitment to informed trading. Past performance does not guarantee future results. Test strategies in a simulated environment before live implementation
