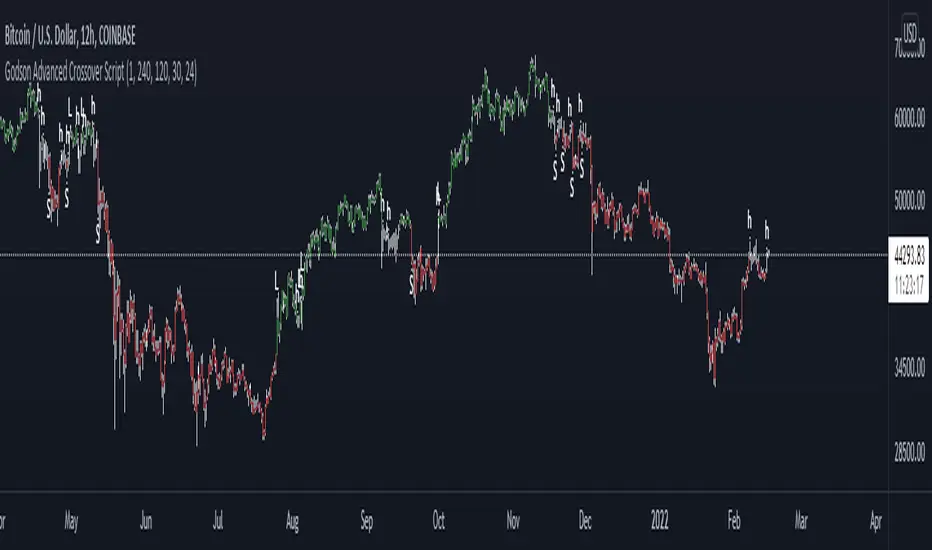
Godson Advanced Crossover ScriptThe Godson Advanced Crossover Script is advanced because it does two things
1: as a trend following indicator the script uses 2 VWAP ema's offset by 1 day(this is adjustable) and an ATR upper and lower band to find entries into larger trends.
2: it also allows you to setup alerts on a lower timeframe that follow a higher timeframe for example, if the 12hr is bearish(candles are red), you can trade shorts only in the 15min timeframe.
The script produces 3 signals
L: this is a long signal, this is signaled when the ema's crossover and the candle breakouts of the ATR bands, if the signal agrees with the upper trend
S: this is a short signal, it signals when the ema's crossunder and the candle breaks down of the ATR bands, if the signal agrees with the upper trend
H: this is for anything in-between, A is for apple, H is for Hedge.
you can set the upper trend timeframe to the same as the lower trend if you want all signals to alert
you can also turn the lines on or off if you need to visualize things
i will update this script as we progress
Average True Range (ATR)
Bar By Bar ATR [upslidedown]After seeing strategy after strategy refer to calculating ATR values using a "calculator" (how barbaric!), I thought I'd take a stab at one possible solution to the "problem" as an overlay indicator on the main chart that replaces traditional standard ATR bands. This indicator presents ATR within a channel with a slick trick: invisible hover-able tooltips for you to know the ATR value for your strategy from bar to bar. Just zoom in and hover over the high ATR range and you'll see take profit and stop loss values for whatever strategy you might be running. I defaulted the indicator to a 1:1.5 ATR standard setup because that is good for many strategies but this is as configurable as you'd like to make it. One notable improvement for this indicator over standard ATR bands is that many existing ATR bands only use integers and this one uses a float value, so you can endlessly customize based on whatever strategy you might be running.
Note: Because labels are limited by default, the best way to historically see ATR values is to use TV's replay feature. I did this on purpose to limit resource usage. One could certainly print more labels but I felt it unnecessary to go beyond the default number of labels.

Minimalistic ATRI have a thing for efficiency, as I'm sure many of you do as well. One could say we are minimalist. As such, wasting precious chart space is absolutely unacceptable. Such precious commodity should only be used for things that are pleasing to the eye and mind. This minimalistic ATR filter will give you all the functions a regular ATR provide, without all the clutter of plotting on the chart. Enjoy
The height of cultivation always runs to simplicity.
Anna-LysaEspecially useful when using it for stocks in intraday screening for daytrading.
This gives you quick information about the volatility at the moment when you look at the stock.
The current range of the last candles (adjustable) is calculated so that you can stop based on the Vola.
In addition, the daily volume and daily range are calculated in the table and what is left of the average.
So that you can adjust your ideas for the movement in order to take profit. No matter what the timeframe, you can see how the volume compares to that of the previous few candles and thus anticipate the most likely breakout.
Then the most relevant day trading levels ( Premarkets, Lastday high/lows and some Ma´s ) are shown so that you can get a very fast overview of the stock at the moment.
All levels and labels and colors are adjustable or hidden in the settings.

Chandelier Exit - StrategyI created a strategy version for the Chandelier Exit indicator, originally owned by @everget . With the strategy I prepared, you can try both short-long and stop loss - trailing stop and take profit rates. I have also added a date filter feature so that you can test the strategy in the date range you want.
Orjinali @everget 'e ait olan Chandelier Exit indicator için strateji versiyonu oluşturdum. Hazırladığım strateji ile hem short-long deneyebilir hem de zarar durdur - takip eden stop ve kar al oranları denemeleri yapabilirsiniz. İstediğiniz tarih aralığında strateji testi yapabilmeniz için tarih filtre özelliği de ekledim.

ATR TREXTry to visualize TREX method.
-4 types of candle based on TR :
1. Spinning ( Candle < 0.8*ATR )
2. Standard ( 0.8*ATR < Candle < 1.2*ATR )
3. Long bar ( 1.2*ATR < Candle < 2.5*ATR )
4. Spike ( 2.5*ATR < Candle )
ATR length is different base on FRACTAL timeframes.
you can now find what is type of candle as colored ATR.
-Time frames :
1 Min
5 Min
15 Min
1 Hour
4 Hour
1 Day
1 Week
1 Month
I am working on TREX method and this indicator will change and improve . (V1.0)
Br
Amin
Hourly Bias on BTC in Bullish USA Session “Green Eagle”Name: Hourly Bias on BTC in Bullish USA Session
Category: Hourly Bias
Operating mode: Spot, only long
Trades duration: Intraday, 11 bars
Timeframe: 1H
Suggested usage: When the market is compressed, USA session has a bullish bias.
Entry: enter Long at 15:00 on specific days of the week. There is a volatility filter based on ATR which identifies compression.
Exit: exit at a pre-defined time at 01:00
Usage:
⁃ It can be useful to use alerts or webhooks to automate this strategy.
⁃ This is a core system that can be improved in different ways (e.g. Stop-loss, take-profit, position sizing) or studying more the behaviour in the specific days of the week or short when is red.
Configuration:
- N/A
Backtesting
⁃ Exchange: BINANCE
⁃ Pair: BTCUSDT
⁃ Timeframe: 1H
⁃ Fee 0.075%
⁃ Slippage 2
- Start : 2019-01-06
We decided to release this free BTC strategy.
How you or we can improve? Source code is open so share your ideas!

Consolidation Zone Hunter NPR BasedThis script will search for zones where the range between the high and low is lower than avg % nearest rank of last X bars.
After X(=30) bars of consolidating range it will signal that the market is in a range and draw the top, bottom and middle of that range.
When price breaks the consolidating range the range is cleared, this is where you long/short the breakout. After this it will look for the next range and do the same.
Visual Explanation

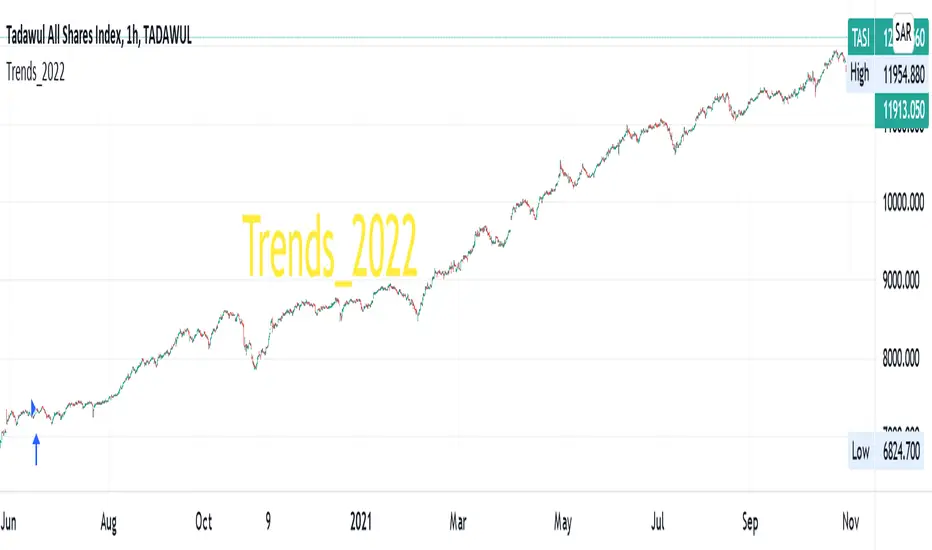
Trends_2022Hello everyone,
we are developing a strategy which is suited for people that likes to trade in small time frames.
Our strategy uses many indications for entries. These indicators can be used individually or better solution we combined them together for best prediction.
These indications like True Range, Average True Range , moving averages also previous bars highs, lows and closes values and finally mathematical equations to decide close price wave movement. Most of the work is in scaling price data and comparing them with the indicators to decide trend
The strategy is planned to go only long direction..
now we will discuss how each indicator is used to decide trend
* According to ATR trend prediction ...
it is up when the scaled bar price greater than ATR value
it turns down when the scaled bar price is less than ATR value
* According to MAs trend prediction ...
we use SMA and previous bar data averages then apply linReg ( Linear regression curve) this result in curve up and down zero
it is up when the value is up zero
it turns down when the value is down zero
* According to close price wave movement ...
we applied cos function on previous bars close data to get the sloping wave of close movement
If the slope is increasing ... this means the current wave value is greater than the previous value
If the slope is decreasing ... this means the current wave value is less than the previous value
Now as we mentioned before... The strategy goes only long direction.
LONG ENTRY Conditions (ANDing condition not ORing):
we can use any one of these indicators individually, or mix any two of them or use them all simultaneously
So... LONG ENTRY Conditions are as below:
if ATR trend is used .. it should be UP.
if MAs trend used .. it should be > 0.
if close wave slope is used .. it should be increasing.
On the other side… the Exit conditions are also (ANDing condition not ORing):
So... LONG Exit Conditions are as below:
if ATR trend is used .. it should be down.
if MAs trend used .. it should be < 0.
if close wave slope is used .. it should be decreasing.
Please send me private message for script authorization.
Happy trading everyone!
Volatility Percentile🎲 Volatility is an important measure to be included in trading plan and strategy. Strategies have varied outcome based on volatility of the instruments in hand.
For example,
🚩 Trend following strategies work better on low volatility instruments and reversal patterns work better in high volatility instruments. It is also important for us to understand the median volatility of an instrument before applying particular strategy strategy on them.
🚩 Different instrument will have different volatility range. For instance crypto currencies have higher volatility whereas major currency pairs have lower volatility with respect to their price. It is also important for us to understand if the current volatility of the instrument is relatively higher or lower based on the historical values.
This indicator is created to study and understand more about volatility of the instruments.
⬜ Process
▶ Volatility metric used here is ATR as percentage of price. Other things such as bollinger bandwidth etc can also be used with few changes.
▶ We use array based counters to count ATR values in different range. For example, if we are measuring ATR range based on precision 2, we will use array containing 10000 values all initially set to 0 which act as 10000 buckets to hold counters of different range. But, based on the ATR percentage range, they will be incremented. Let's say, if atr percent is 2, then 200th element of the array is increased by 1.
▶ When we do this for every bar, we have array of counters which has the division on how many bars had what range of atr percent.
▶ Using this array, we can calculate how many bars had atr percent more than current value, how many had less than current value, and how many bars in history has same atr percent as current value.
▶ With these information, we can calculate the percentile of atr percentage value. We can also plot a detailed table mentioning what percentile each range map to.
⬜ Settings
▶ ATR Parameters - this include Moving average type and Length for atr calculation.
▶ Rounding type refers to rounding ATR percentage value before we put into certain bucket. For example, if ATR percentage 2.7, round or ceil will make it 3, whereas floor will make it 2 which may fall into different buckets based on the precision selected.
▶ Precision refers to how much detailed the range should be. If precision set to 0, then we get array of 100 to collect the range where each value will represent a range of 1%. Similarly precision of 1 will lead to array of 1000 with each item representing range of 0.1. Default value used is 2 which is also the max precision possible in this script. This means, we use array of 10000 to track the range and percentile of the ATR.
▶ Display Settings - Inverse when applied track percentile with respect to lowest value of ATR instead of high. By default this is set to false. Other two options allow users to enable stats table. When detailed stats are enabled, ATR Percentile as plot is hidden.
▶ Table Settings - Allows users to select set size and coloring options.
▶ Indicator Time Window - Allow users to select particular timeframe instead of all available bars to run the study. By default windows are disabled. Users can chose start and end time individually.
Indicator display components can be described as below:

Nearest Percentile Moving Average BandsWhile coding some filters into another indicator for Long/Short I noticed that ta.nearest.percentile might be the most useful tool in pinescript I've ever encountered.
While percentile_nearest can be used for all kind of things I decided to code moving averages from it and made bands for bottom percentage and top percentage.
The indicator will calculate the top % price of the given bar length.
Example settings:
length: 150
percentile: 99
So when using 99% it will draw a green line when price is moving above the top 1% price of the last 150 candles. It then calculates if the price is below the bottom 1% of the last 150 candles.
Trading use:
Use this indicator to check if the market is leaving normal territory. This signals a breakout move for example the dogecoin pump or the top of the range. I use this indicator to catch bull/bear moves for botting purposes. An other use would be to countertrend trade after the move has ended. With price being in top 1% for a while it is very probable that we see a large correction.
Below example of dogecoin pumps:

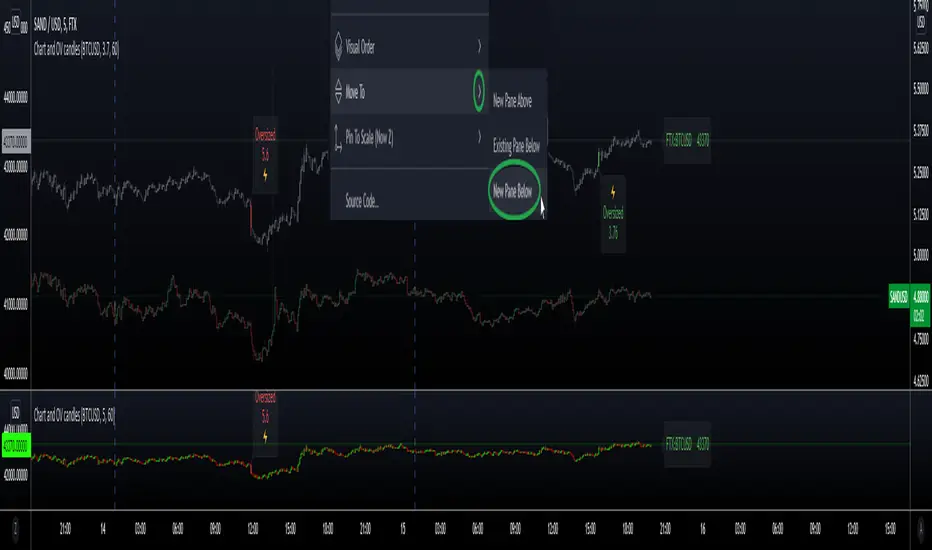
Secondary Chart with OverSized CandlesHi everyone, I'm sharing a simple script I made for a friend. He was looking for a way to add another asset to his chart, and monitor relevant movements \ spot eventual correlation, especially when trading Cryptocurrencies.
We couldn't find a similar script already available so here it is - the code is commented and I hope it's clear enough :)
Notes:
- The parameter scale = scale.left keeps the scales separated and therefore the chart is more organized, otherwise the chart would appear flat if the price difference is too big (e.g. BTC vs XRP)
- It is possible to have the script running in a separate panel (instead of overlay) by moving it to a new pane (when added to the chart) or by removing the parameter overlay = true at the beginning of the code.
- In case you wish to add indicators to this sub-chart (e.g. Bollinger Bands, EMA, etc..) you can do that by adding the relevant code and feed it with the variables OPEN \ HIGH \ LOW \ CLOSE as well as using the same method to retrieve new variables from the target asset with the request.security function.
Hope this comes handy.
Val - Protervus
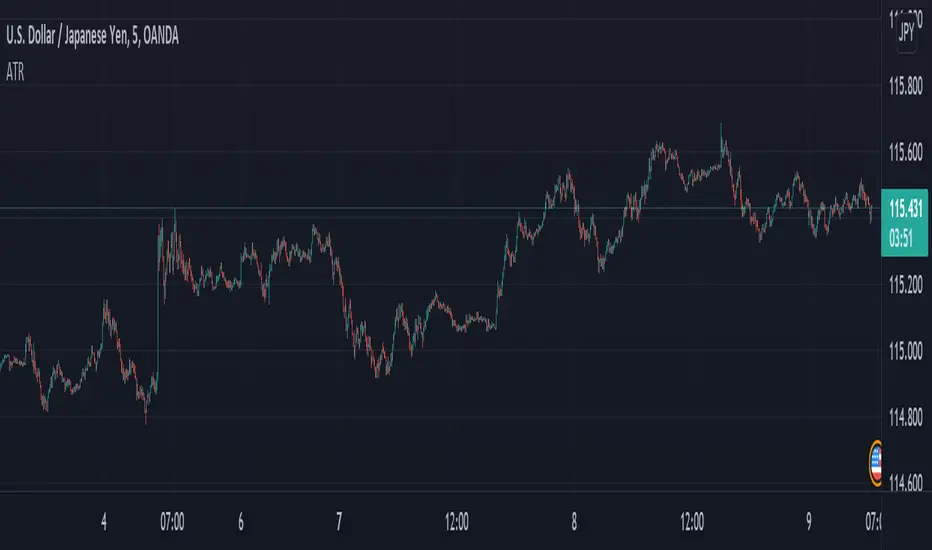
[JL] n Bars Average True RangeI just want to use 1-hour ATR on a 5-min chart, but I don't want to use the security function to get 1-hour ATR.
I don't know if there is a similar script but I decided to change a little from the original ATR source code.
Just change tr function to n_true_range function:
math.max(ta.highest(high,n) - ta.lowest(low,n), math.max(math.abs(ta.highest(high,n) - close ), math.abs(ta.lowest(low,n) - close )))
Here is the comparison image from a 5-min chart with the nATR and a 1-hour chart with the original ATR.

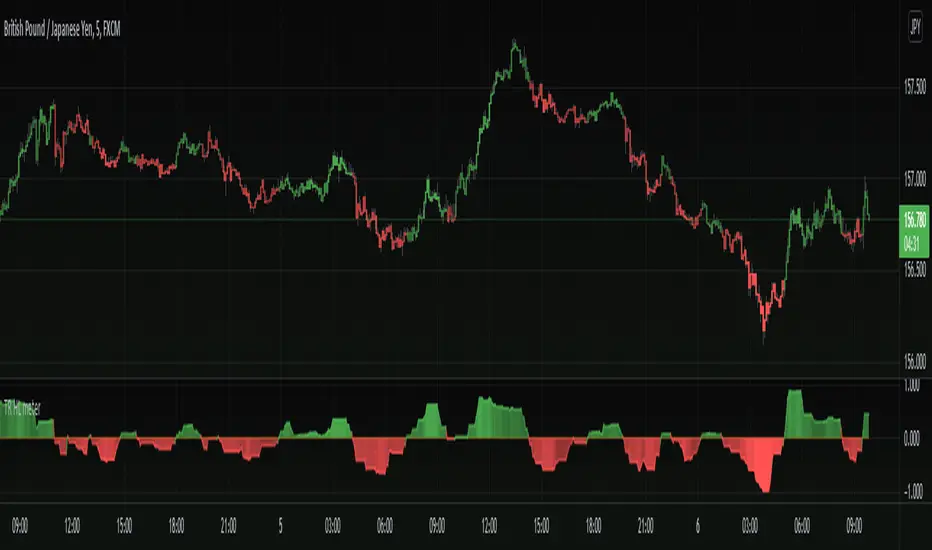
TR High/Low meterInteresting take for a velocity and trend analysis indicator, I call it The TR high/low meter.
First it will find the highest high and lowest low based on X bars back.
Now comes the twist, instead of storing these lowest or highest prices, we store the TR (true range) into the appropriate array (one array for lowest and one array for highest).
Finally, we sum up these two arrays for highest TR's and lowest TR's and subtract each other to get the difference, Hench, see who is stronger.
In the end we plot the difference into the indicator we have here.
The plot is colored with gradient color in which bright color emphasizes the movement is strong and weaker color emphasizes the movement is getting weaker.
Basically this indicator shows us the asset trend direction and strength. Awesome!
==Colors and Bar Colors==
Green: Up Trending
Light Green: Weakening up trend
Red: Down Trending.
Light Red: Weakening Down Trending.
==Notes==
Bar coloring is enabled on this chart!
Supports EMA smoothing (disabled by default)
Like if you like and Enjoy! Follow for more upcoming indicators/strategies: www.tradingview.com
8X Trend ATR SAR Dingue V58X Trend ATR SAR Dingue V5 - This is the updated version for Pine Script 5.
8x indicator into 1 :
2x ATR indicator - 3x Trend indicator - 3x SAR indicator
Trends are helpful to spot reversal and support resistance, especially on bigger time frames.
This indicator gives you a global view of various trends all at once. You can easily turn them On or Off as to not clog the screen.
Each trend is also color-coded to visualize quickly the position of the price compared to it.
You can customize lengths, adjust line sizes, have the start of a new trend marked with a circle, fill in colors.
'Tool tips' explain other settings and if you have any questions, feel free to ask in the comments below.
Thank you for the feedback and check all my ‘Dingue’ indicators.

DTFL FOREX OverlayThese tools are used by FOREX traders who primarily follow the DTFL trading strategy, however, they can easily be utilized by any other FOREX trader looking for an all-in-one indicator that includes sessions, previous high/lows, session values, various moving averages and lockable ADR/ATR lines.

Signal Table - AutoFib - SMA - EMA - RSI - ATR - VolWith this indicator you can add a table on top of your chart.
What's in this table?
On which graph you open this table, the indicator data at the selected time of that graph are written. In the image below, you can see the table in the upper right.
You can also see two EMAs above the chart in this indicator. You can adjust their length.
You can add automatic fibonacci retracement levels to the top of the chart. In this way, you can see the Fibonacci levels on the chart and determine the support resistance. If the price is above the Fibonacci level, it will appear green on the chart, and red if below. You will understand as you use it.
It turns red if the RSI is below 30 and green if it is above 70.
Likewise, if the price is above the moving averages you have set, it appears as green, and if it is below it, it appears as red.
You can hide and activate the EMA and Fibonacci levels above the chart.
For example, you can get the ETH chart while the BTC chart is open in front of you. I think you will understand everything clearly from the settings tab below. Please support me. I hope you will be satisfied using it.

Trade Helper [Trading Nerd]Position Size Calculator / Lot Size Calculator
Disclaimer: I do my best to avoid wrong calculations and bugs. I provide this indicator without warranties of any kind. You bear all risks associated with the use of this indicator.
Inputs:
Market: Adds a name tag to the Table to keep track of the trades.
Entry Price: The entry Price of the Position.
Entry Time: The entry Time/Candle of the Position. If Stop Loss Type is 'ATR' or 'HH/LL' the Value for this is calculated by this Candle.
Stop Loss Type: Changes the Stop Loss Type.
Direction: Define if the trade direction is 'Long' or 'Short'. Has no effect on Stop Loss Type 'Custom'. For this you can just set the Stop Loss below/above the Entry Price .
ATR Multiplier: Multiplies the ATR Value by this number. Has only an effect on Stop Loss Type 'ATR'.
HH/LL Lookback Length: Lookback length for determine Highest High/Lowest Low value. Has only an effect on Stop Loss Type 'HH/LL'.
Custom SL Price: The Stop Loss Price if the Stop Loss Type is set to 'Custom'.
Risk Reward Ratio: The Risk is multiplied by this number to determine the Take Profit Price.
Balance: Balance Amount and Currency
Contract Size: The Position Size is divided by this number. E.G. in Forex one Lot is 100.000 Contracts. Change this Value depending on your Broker and Market.
Risk in %: Percent that is risked of the Balance for one Trade.

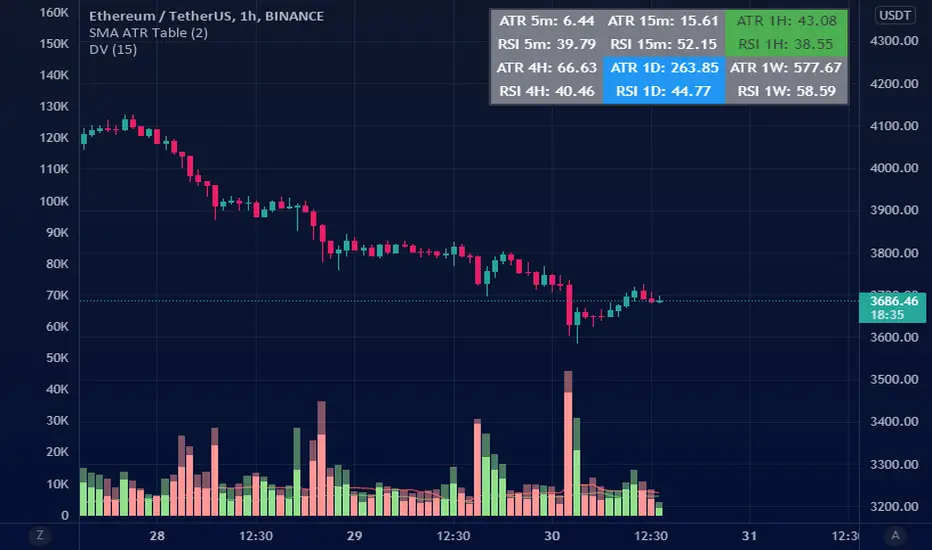
ATR Table (SMA)ATR table for select time frames.
Using Simple Moving Average (SMA) to get ATR.
MA periods is based on numbers suggested by Saeed Khakestar (Trigger Price Action)
You can change them in code
5m => 12
15m => 16
1H => 24
4H => 42
1D => 30
1W => 52
RSI is calculated the same way
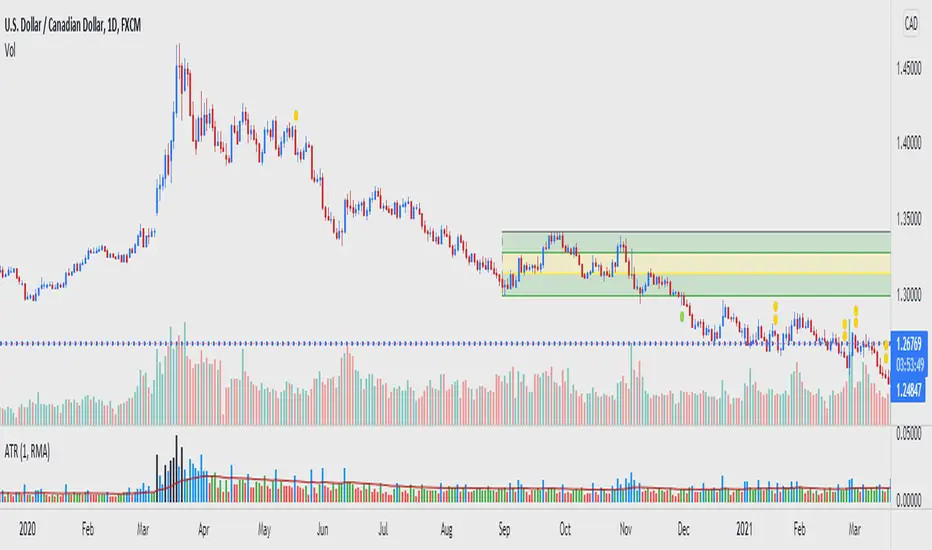
ADR - Average Daily Range With ForecastI always liked the MT4 ADR indicator that was going around but never found a decent port of it in tradingview. I also noticed that the way most people were doing the ADR calculation using SMA was not always accurate and that bothered me so I decided to write one from scratch which gave a very specific ADR calculation.
On the MT4 version it would project ADR targets on the high and low side. While I liked that I thought it could be improved upon by determining orderflow and anchoring to the perceived low of day to give you a more realistic target.
I also included a percentage of current ADR as well as changed the color to red once ADR was hit.
Configuring is very simple:
Max Timeframe To Display: you can set what timeframes to show adr (I know tradeingview lets you set this now but I still like it here)
Display Average Range As FOREX pips: Some Instruments use whole numbers so you can toggle if you need too
ADR Length Parameter: Sets Number of Days Lookback to Calculate ADR
I hope you enjoy it.

Configurable Multi MA Crossover Voting SystemThis strategy goes long when all fast moving averages that you have defined are above their counterpart slow moving averages.
Long position is closed when profit or loss target is hit and at least one of the fast moving averages is below its counterpart slow moving average.
The format of the config is simple. The format is : FASTxSLOW,FASTxSLOW,...
Example : If you want 2 moving averages fast=9,slow=14 and fast=20,slow=50 you define it like this : 9x14,20x50
Another example : 5x10,10x15,15x20 => means 3 moving average setups : first wih fast=5/slow=10, second with fast=10/slow=15, last with fast=15/slow=20
You can chose the type of moving average : SMA, WMA, VWMA (i got issues with EMA/RMA so i removed them)
You can chose the source of the moving average : high, close, hl2 etc.
You can chose the period on which ATR is calculated and ATR profit/loss factors.
Profit is calculated like : buy_price + atr_factor*atr
Loss is calculated like : buy_price - atr_factor*atr
Performance in backtest is variable depending on the timeframe, the options and the market.
Performance in backtest suggests it works better for higher timeframes like 1d, 4h etc.
Disclaimer
Please remember that past performance may not be indicative of future results.
Due to various factors, including changing market conditions, the strategy may no longer perform as well as in historical backtesting.
This post and the script don’t provide any financial advice.

[AXSUSDT] Multi signal Autotrade Binance* Commission: 0.06 and Autotrades Binance setting:
* Risk: 1%/trades and Stoploss moving formular:
1. H4 timeframe: Supertrend indicator
...Uptrend when closes candles is above the green line.
...Downtrend when closes candles is below the red line.
2. Pivot H/L:
- UPTREND:
... HH (Higher High) - HL (Higher Low)
... HH (Đỉnh sau cao hơn) - LH (Đáy sau cao hơn)
- DOWNTREND:
... LL (Lower Low) - LH (Lower High)
... LL (Đáy sau thấp hơn) - LH (Đỉnh sau thấp hơn)
3. Keltner Channels for detemined a trend & open trades: No repainting by checking previous closes candles.
* KELTNER BASIS = EMA(50)
- Zone for UPTREND: closes candle crossover Keltner Channels Upper 1, 2, 3
- Zone for DOWNTREND: closes candle crossunder Keltner Channels Lower 1, 2, 3
- Zone for opentrades: Keltner Channels Lower 1, Basis, Upper 1.
a. Open trades at Basis:
b. Open trades at Upper 1/Lower 1:
c. Open trades at SELL Upper 1/ BUY Lower 1:

ATR Bands with QQE [LM]Hello traders,
I would like to present you ATR Bands with QQE. This indicator is different than my other indicators I used QQE oscillator as an entry indicator, and atr bands I have used as an exit indicator.
You can see 2 set of bands with different multiplicator, first is used as first target profit, stop loss and second as a second target
There are two modes that takes, first is static mode that gives you lines with 1st, 2nd target profit and in red color stop loss.
Second mode has static first target and trailing stop loss
Settings:
Genreal settings - basic setting of source for atr bands, line settings,
First atr bands setting
Second atr bands setting
QQE settings
Cheers,
Lukas
