Bands
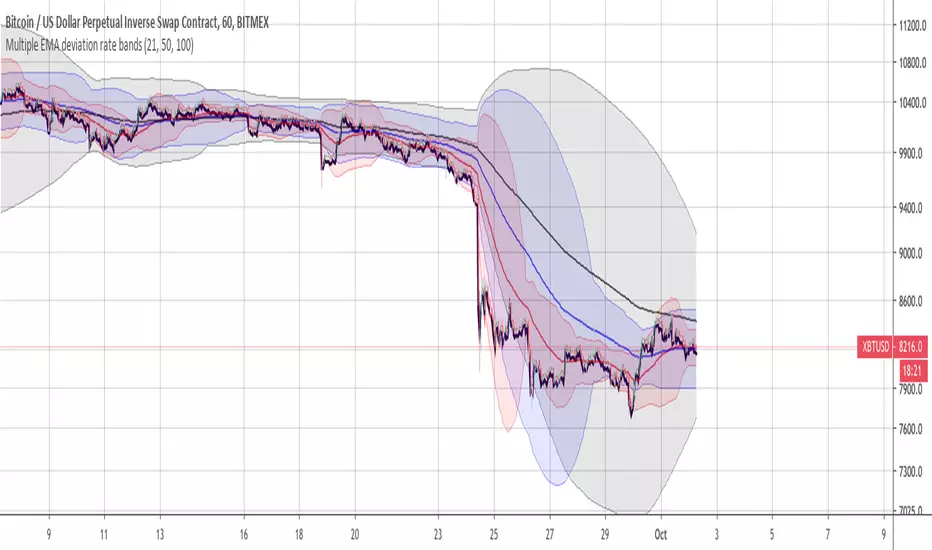
Quantile BandsMiddle quantile/band color is set by confluence of the outer quantiles and not by it's own slope. Optional MTF.

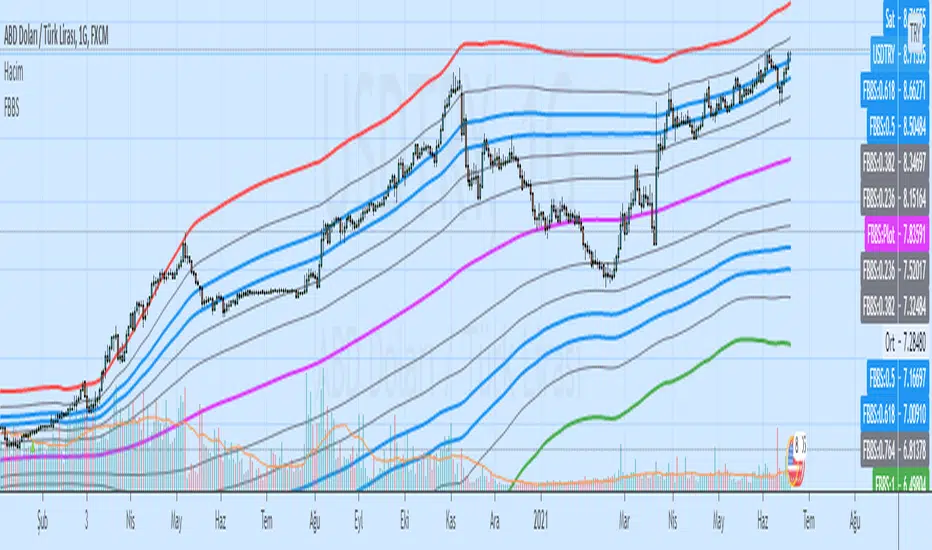
Function : Linear Regression Bands
Used with Pearson Correlation. It can be used to make sense of the trends. Very successful results can be obtained with a MACD style indicator and volume indicator that gives Buy and Sell orders.Open for adaptive and mutable variable periods of moving averages. Best regards!

Any MA bands (TMA bands V2)Hi everyone
Website will be opening very shortly :) Sorting out the last details and we're so excited to finally roll-out our different Algorithm Builders for you guys
Forewords
This present script is an evolution of the TMA bands . I would never have expected that script to become so popular to be honest
This is not only a study or idea but a really proven method and I'm glad that many of you are using it already. But please, whenever you see a new script out there, even if it looks cool and promising, please test it on a demo account for a week or on a LIVE account but with tiny amounts every time.
Many times, what you see on the chart is not what will happen in reality. I know that most of you will agree and I know exactly why we see this behavior... I'll give more details in a later post
I have plenty of methods like that one and I'll detail them on my website (and a bit on TradingView) starting next month
TMA bands on steroids
Someone asked me privately to make a generic version of the TMA bands and make it compatible with other standards Moving Average types. That's it for the specifications really as I didn't do much than re-using some piece of my own code
Suggested (but not mandatory) methodology
1) The Take Profit 1 is the middle line, Take Profit 2 is the opposite band.
2) Once the TP1 is hit, set your Stop Loss to breakeven
3) Once the TP2 is hit, if you still want to stay in the trade, set your Stop Loss to the TP1
It will be a powerful tool in your arsenal for some scalp/intraday trades
Wishing you all of you a great and profitable day
PS
It's strictly forbidden to republish this script without my explicit approval. All my posts are copyrighted from now on
Obviously you can use but not republish and get the credit or even worse... some money from your own clients
Dave
____________________________________________________________
Be sure to hit the thumbs up. Building those indicators take a lot of time and likes are always rewarding for me :) (tips are accepted too)
- If you want to suggest some indicators that I can develop and share with the community, please use my personal TRELLO board
- I'm an officially approved PineEditor/LUA/MT4 approved mentor on codementor. You can request a coaching with me if you want and I'll teach you how to build kick-ass indicators and strategies
Jump on a 1 to 1 coaching with me
- You can also hire for a custom dev of your indicator/strategy/bot/chrome extension/python
Disclaimer:
Trading involves a high level of financial risk, and may not be appropriate because you may experience losses greater than your deposit. Leverage can be against you.
Do not trade with capital that you can not afford to lose. You must be aware and have a complete understanding of all the risks associated with the market and trading. We can not be held responsible for any loss you incur.
Trading also involves risks of gambling addiction.
Please notice I do not provide financial advice - my indicators, strategies, educational ideas are intended to provide only some source code for anyone interested in improving their trading
The proprietary indicators and strategies developed by Best Trading Indicator, the object of intellectual property rights are and remain the exclusive property of Best Trading Indicator, at the exclusion of images and videos and texts free of rights or provided by the Company or external legal or physical person.
No assignment of intellectual property rights is carried out through these Terms and Conditions.
Any total or partial reproduction, modification or use of these properties for any reason whatsoever is strictly prohibited without the express written authorization of the Company.


Dual Thrust Trading Algorithm (ps4)This is an PS4 update to the popular Dual Thrust trading algorithm posted by me some time ago (). It has been commonly used in futures, Forex and equity markets. The idea of Dual Thrust is similar to a typical breakout system, however dual thrust uses the historical price to construct update the look back period - theoretically making it more stable in any given period.
See: www.quantconnect.com


Bands-Trailing Stop UtilityIntroduction
Bands and trailing stops are important indicators in technical analysis, while we could think that both are different they can be in fact closely related, at least in the way they are made. Bands and trailing stops can be made from a simple central tendency estimator, like a moving average, and from a volatility estimator like standard deviation, atr...etc.
This is why i propose this utility that allow you to make bands and trailing stops from any indicator in the price chart.
How To Use
All you have to do is select the indicator you want to make bands from in the settings, so just open the Bands-Trailing Stop Utility indicator settings and select your indicator in "Source". Make sure your source indicator is not in "hide" mode.
For example here i'am using a moving average as source for the indicator. Mult control how spread the bands are from each others, by default mult = 1, if we use mult = 2 we get :
Mult can be non-integer as well as lower than 1 (when lower than 1 the bands would be closer to each others)
Error/Volatility Estimators
You can choose from a wide variety of volatility estimators, select the estimator from the "Method" scrolling parameter in settings, by default the indicator will use the running mean absolute error (MAE) which don't use length. Other estimators use length, making length = to the period of the source indicator can help get better results.
The root moving averaged squared error (RMASE) is just the square root of the simple moving average of the squared difference between the closing price and the source indicator. length control the period of the moving average of RMASE.
You can also use the average true range with period length. It might work better with low lagging moving averages.
The range is simply the difference between the highest and lowest over length periods of the source indicator.
Stdev is simply the price running standard deviation.
Trailing Stop
When the trailing stop mode is checked the bands will be replaced by a trailing stop, the trailing stop will still depend on every settings of the indicator like mult/volatility estimator...etc.
Conclusion
You might find an use to this tool if you want to make bands/trailing stops from pretty much everything. The indicator used as source for the examples is a smooth exponential averager that i could share if i see interest from peoples.
Thanks for reading !

Kaufman Adaptive BandsIntroduction
Bands are quite efficient in technical analysis, they can provide support and resistance levels, provide breakouts points, trailing stop loss/take profits positions and can show the current market volatility to the user. Most of the time bands are made from a central tendency estimator like a moving average plus/minus a volatility indicator. Therefore bands can be made out of pretty much everything thus allowing for any kind of flavors.
So i propose a band indicator made from a Kaufman adaptive moving average using an estimate of the standard deviation.
Construction
The Kaufman moving average is an exponential averager using the efficiency ratio as smoothing variable, length control the period of kama and in order to provide more smoothness a power parameter has been introduced, higher values of power will return smoother results.
The volatility indicator is made from a biased estimation of the standard deviation by using the square root of the mean of the square minus the square of the mean method, except that we use kama instead of a mean.
The bands are made by adding/subtracting this volatility indicator with kama.
How To Use
The ability of the indicator to adapt to the current market state is what makes him a great tool for avoiding major exposition during ranging market, therefore the indicator will have a greater motion during trending market, or more simply the bands will move during trending markets while staying "flat" during ranging ones. Therefore the indicator might be more suited to breakouts, even if some cases will return what where turning points, this is particularly true during ranging markets.
Of course the efficiency ratio is not an "unbiased" trend metric indicator, it can consider high volatility markets as trending markets. Its one of his downsides.
High values of power will create smoother bands.
When using a low power parameter use an higher mult. In general using a low power value will make the bands move more freely as well as making them closer to each others.
Conclusion
At least the indicator is really nice to the eyes when using high power values, its ability to adapt to the market is a great addition to other more classical bands indicators, i also introduced a volatility estimator based on kama, some might have used the following estimation : kama(abs(price - kama)) which would have created a slower result. A trailing stop might be made from it if i see request about such addition.
If you are curious here are some more images of the indicator performing on different markets. Thanks for reading !

Triangular Moving Average (TMA) bandsWhat in the world is up folks ??!??
Here's the indicator of the day. Sharing a simple one today because I'm busy coding for a few clients (fun life of a top script author on TradingView)
The TMA bands is an indicator that I discovered on FXCM a few years ago FXCM TMA bands
From the screenshot above, we see that when the price hits the lower band, it's a possible reverse BUY signal. When it hits the upper band, it's a possible SELL signal
Methodology
1) The Take Profit 1 is the middle line, Take Profit 2 is the opposite band.
2) Once the TP1 is hit, set your Stop Loss to breakeven
3) Once the TP2 is hit, if you still want to stay in the trade, set your Stop Loss to the TP1
That's what we call a trailing stop loss which I offered in the Trade Manager : Trade-Manager-Open-Source-Version/
It will be a powerful tool in your arsenal for some scalp/intraday trades
After years of coding for traders, I worked with many brokers/API/languages so I'm very used to convert a script from a broker to another one (shameless self-advertising)
PS
Tomorrow I'll share the Signal version of my Algorithm Builder:
You'll be able to connect it in a single click to a very cool Backtest System made by the Pinescripters community
In other words, I'm selling the scripts to allow you to build your own signals in a few clicks AND to connect it easily to a kick-ass backtesting tool. More to come tomorrow
Hope you'll like it, like me, love it, love me, tip me :)
____________________________________________________________
Feel free to hit the thumbs up as it shows me that I'm not doing this for nothing and will motivate to deliver more quality content in the future. (Meaning... a few likes only = no indicators = Dave enjoying the beach)
- I'm an officially approved PineEditor/LUA/MT4 approved mentor on codementor. You can request a coaching with me if you want and I'll teach you how to build kick-ass indicators and strategies
Jump on a 1 to 1 coaching with me
- You can also hire for a custom dev of your indicator/strategy/bot/chrome extension/python


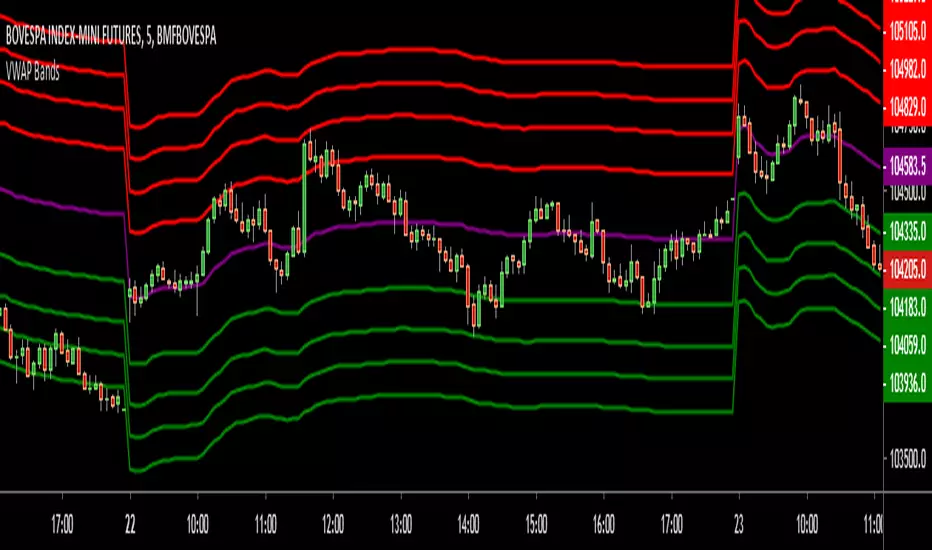
VWAP BandsThis indicator plots distant VWAP lines that serve as support and resistance. You can add more lines from the script.
Good trades!
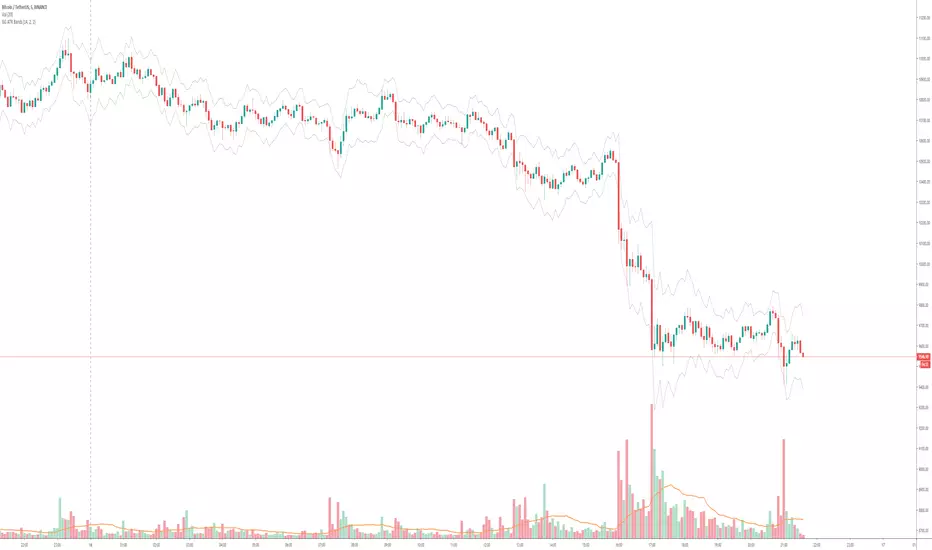
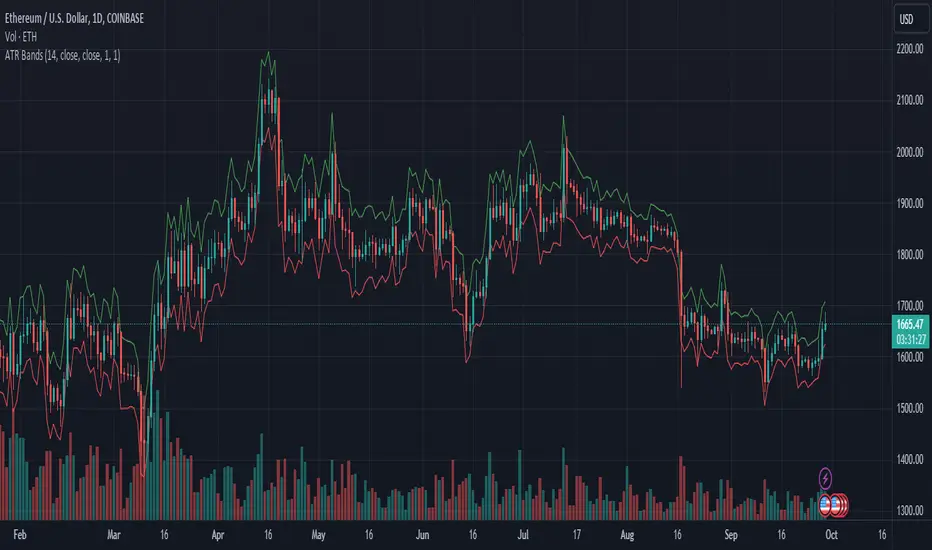
GG ATR bands
ATR plotted above and below price with a multiplier. Defaults to 2x ATR. Makes it easier to use ATR for stop or take profit.

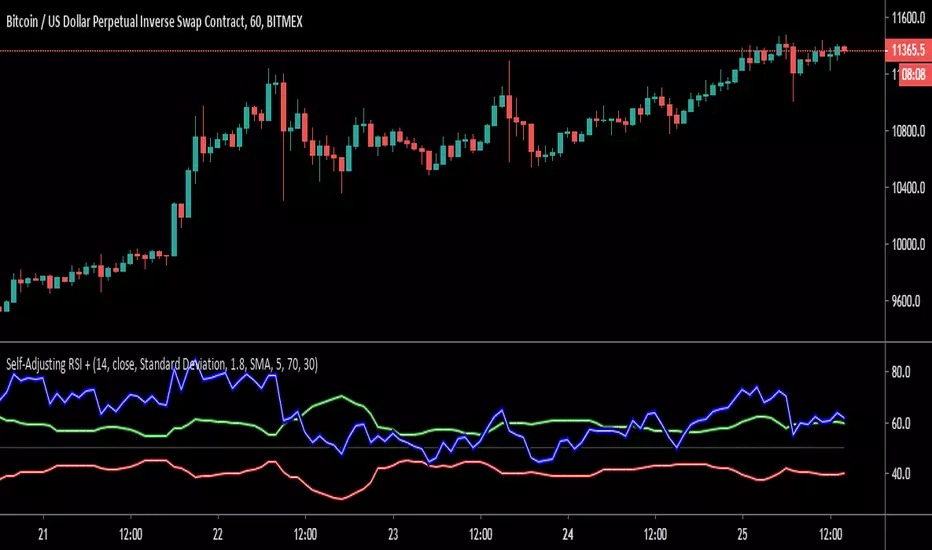
Self-Adjusting RSI +Here is an open source (no request needed!) version of the Self-Adjusting RSI by David Sepiashvili.
Published in Stocks & Commodities V. 24:2 (February, 2006): The Self-Adjusting RSI
David Sepiashvili's article, "The Self-Adjusting RSI," presents a technique to adjust the traditional RSI overbought and oversold thresholds so as to ensure that 70-80% of RSI values lie between the two thresholds. Sepiashvili presents two algorithms for adjusting the thresholds. One is based on standard deviation, the other on a simple moving average of the RSI.
This script allows you to choose between plotting the Self-Adjusting bands or the traditional bands. You can also plot a smoothed RSI (SMA or EMA) and change the theme color for dark or light charts.
If you find this code useful, please pass it forward by sharing open source!
Thank you to all of the open source heroes out there!
"If I have seen a little further it is by standing on the shoulders of Giants."
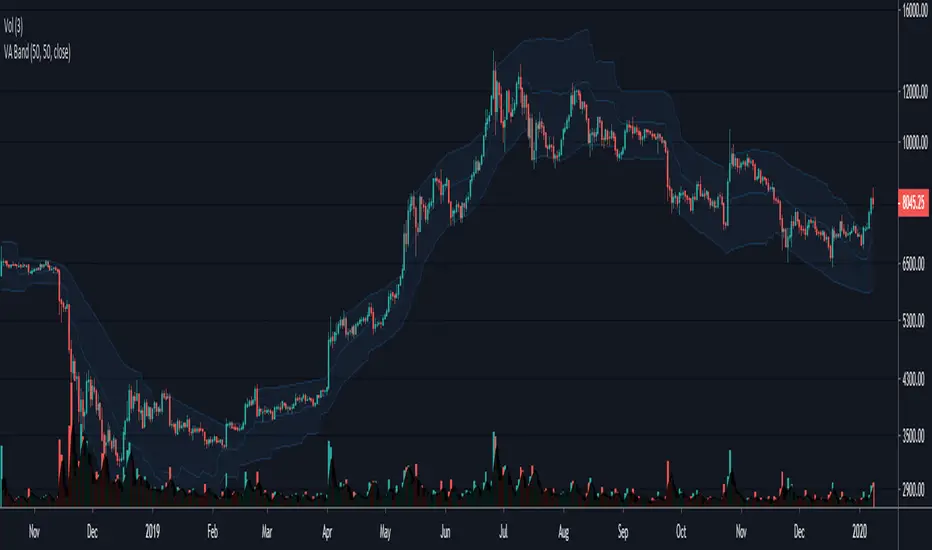
Volatility Adjusted Bands - JD This indicator gives a likely trading range based on the volatility of the past x amount of bars, measured against a certain moving average.
The indicator can be used as an alternative for BBands.
It gives approx. the same "trend-side" lines (upper line in uptrend, lower line in down trend) as the Bollinger Bands, but the opposite line follows closer on price,
Instead of "flying out" to the other direction like in BBands.
As a comparison, the BBands for the same length (50 period) are added on the chart.
JD.
#NotTradingAdvice #DYOR
I build these indicators for myself and provide them open source, to use for free to use and improve upon,
as I believe the best way to learn is toghether.
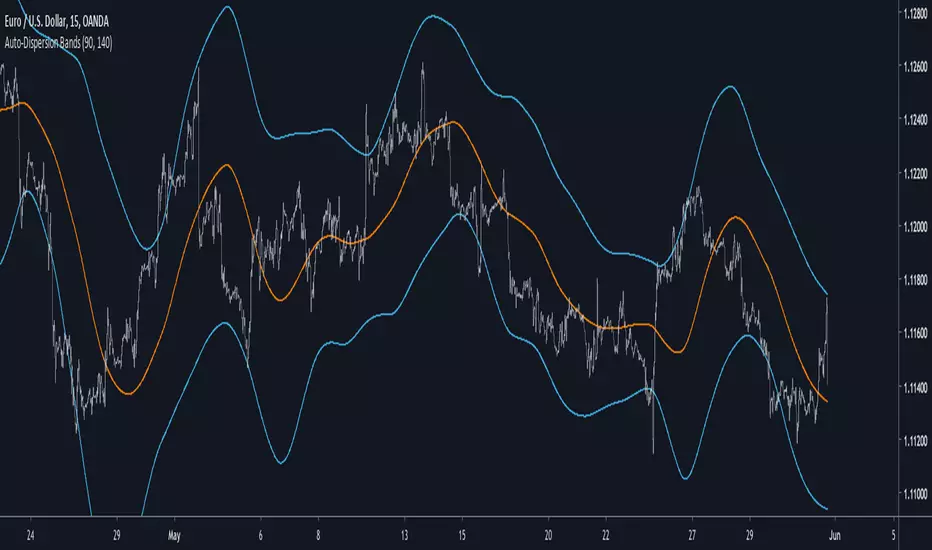
Auto-Dispersion BandsIntroduction
A really old indicator as well, thus i have no much ideas of what is going on with it, but i know that those bands returns good reversals points. The indicator don't use standard deviation, instead its a simple differencing of the price and the price length bars back who will provide a dispersion measurement, thus the name auto-dispersion.
The Indicator
The smooth parameter allow the band to cross the price, if smooth is low the chance of crosses are lower.
smooth = 3
Volume Adaptive BandsIntroduction
I have been asked by @Coppermine and @Verbena to make bands that use volume to provide adaptive results. My first approach was to use exponential averaging, in order to do so i needed to quantify volume movement using rescaling with the objective to make the bands go away from each others when there is low volume, this approach is efficient and can work on any time frame, however i decided at the end to use another method which rely on recursive weighting, cleaner but more parametric. Those bands aim to highlight great breakouts point to go with the trend.
The Indicator
length control the period of the moving averages used in the script, however low length's don't necessarily provide indications for shorter terms breakouts as shown here :
As i said the bands are close to each others when there is high volume and away when there is low volumes.
Low volume period, bands will avoid to cross price
High volume, bands will be close to generate signals.
Correction Factor
Higher time frames will lower the distance between each band, this is because volume is higher during higher time frames, remember that the indicator bands are close to each others when volume is high.
1h chart eurusd.
This is why i added a correction factor, this factor can help you control the distance between each bands, when the correction factor is greater than 1 the bands will be closer to each others, this is useful for low time frames where the average volume is lower. When the time frame is high, use values between 0 and 1 to increase distance between each bands.
Correction factor = 0.2
Conclusion
I presented a new adaptive band indicator that adapt to trading volume by using recursive weighting, volume can be replaced by other indicators but you can have results going nuts, at the end its about experimentation. I hope you will find an use to it, thanks to @Coppermine and @Verbena for the request :)
Thanks for reading !

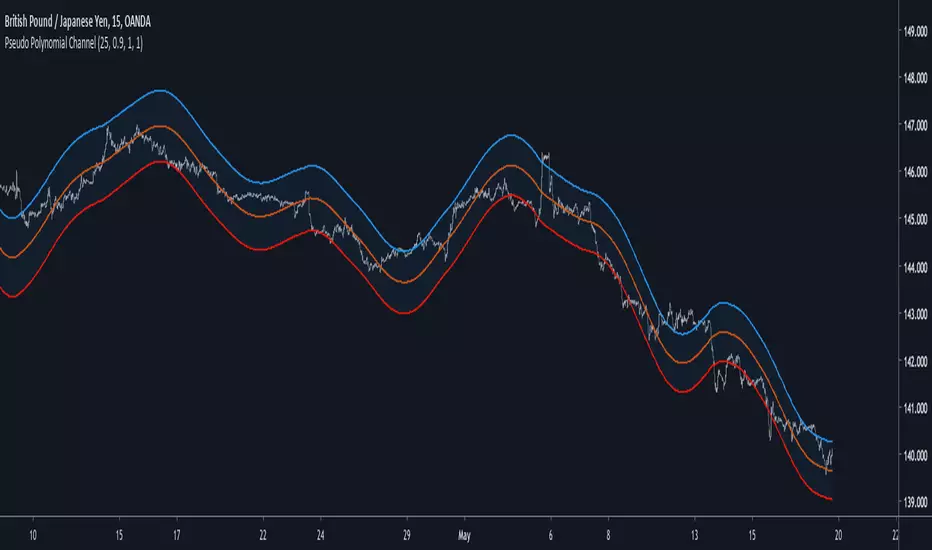
Pseudo Polynomial ChannelIntroduction
Back when i started using pine i made a script called periodic channel who aimed to rescale an average correlated sine wave to the price...don't worked very well. So i tried to fix problems induced by the indicator without much success, i had to redo it from scratch while abandoning the idea of rescaling correlated smooth functions to the price, at that time i also received requests regarding polynomial channel, some plateformes included this indicator, this led me to the idea to estimate it in order to both respond to the periodic channel problems and the requests i received, i have tried many many things and recently i tweaked a linear extrapolation to have an approximation.
Linear Extrapolation To Pseudo Polynomial Regression
I could be wrong but a polynomial regression must use constant parameters in order to provide a really smooth output, at least constant for a set of time. The moving averages forms (Savitzky-Golay moving average) who smooth polynomials across a window to the data don't have such smoothness, so how to estimate a polynomial regression while having a parameter providing control over the smoothness, a response to this is by using a recursive linear extrapolation. I posted a linear extrapolation indicator long ago, i used the same formula while adding a function to morph the output and the input in the form of :
morph * output + (1-morph) * input
How can this provide an estimate of a polynomial regression ? Well i'm not even sure myself but if you use the output as input (morph = 1) for the linear extrapolation function you should get a rough estimate of a line, this is what i thought at first and it proved to be right
Based on this observation i thought that it would be possible to get polynomial results by lowering morph, and as expected it worked well but showed a periodic pattern, this is why i smooth k in line 10.
0.9 for morph work well, higher values create sometimes smoother results but damage heavily the estimation.
Parameters
Morph have been introduced earlier, it control the amount of output and input the linear extrapolation should process, lower values create rougher but more stables results, if you see that the estimation is going nuts lower morph or change length, also lower length if you increase morph .
High overshoot, morph to 0.8 can help have a better estimation at the cost of less smoothness.
Length control the indicator smoothing, this parameter differ heavily from other filters, therefore low values can create mid/long term smoothing, it can also depend on which market instrument you are applying it, so there are no fixed optimal length.
Mult control how spread the bands are, to do so mult multiply the cumulative mean error, you can change this error measurement by anything you want like standard deviation/atr/range but take into account that you may create a separate parameter to control the error instead of length . Mult can be a float and like length can have different optimal values depending on the market the indicator is applied to.
Flatten do exactly what is name imply, it flatten the overall output to have a better estimation, can be a float. The result is less smooth.
Flatten = 2
More Exemples
BTCUSD length = 25 and mult = 4
XPDUSD length = 25 and mult = 1
ALPHABET length = 6 and morph = 0.99
Conclusion
I tried to estimate a polynomial channel by using recursion in the linear extrapolation function. This build is way more stable than the periodic channel but its still a bit inaccurate in my opinion. I hope this code can still help someone build something really nice, if so share your results :)
I apologize for those expecting a legit polynomial channel build but i really don't know how to do that, as i said parameters for the regression must be constants, i hope it still fine :)
Thanks for reading !
ATR BandsDisplays two bands above and below the source using the ATR. Comes with ATR multipliers for upper and lower bands.
Flagging BandsIntroduction
A pun between the word flag and the adjective flagging (less dynamic) , this indicator have two bands who react faster when in contact to the price. Imagine you are under sheets, if you abruptly rise, the sheets will instantaneously go up, then if you abruptly get down, the sheets will fall slowly until being in contact with a surface, this is because of a type of friction called drag or air resistance , this force is described in fluid dynamics and i inspired myself from that for the creation of the indicator.
The indicator
The indicator is made of two bands, one upper band and one lower band, then a weighted average of each bands, this average is weighted depending on which band the price is closer. The length control the period of the indicator, in general higher lengths will create wider bands, you must consider that this parameter behave differently than other ones and may create slower results in comparison with other bands indicators while having the same length period.
The indicator can use a simple breakout methodology (see trailing stop part) but can sometime provide support and resistance points, in fact i believe that when the average variability/volatility of band A is higher than the average variability/volatility of band B and that the price cross band B then price will reverse its direction, this claim is not justified, research is needed.
Trailing Stop Mod
It is possible to make the indicator act as a trailing stop, in order to do so just tick the trailing stop mod box.
The average/bands will automatically disappear being replaced by the trailing stop.
Conclusion
I was just playing around when making the skeleton of the indicator, i hope the code is easy to understand, if you need some kind of explanation just pm me, i'm always open to help people/receive suggestions.
Best Regards
