Volatility ATR Support and Resistance Bands [Quantigenics]Volatility ATR Support and Resistance Bands
The “Volatility ATR Support and Resistance Bands” is a trend visualization tool that uses Average True Range (ATR) to create a dynamic channel around price action, adapting to changes in volatility and offering clear trend indicators. The band direction can indicate trend and the lines can indicate support and resistance levels.
The script works by calculating a series of moving averages from the highest and lowest prices, then applies an ATR-based multiplier to generate a set of bands. These bands expand and contract with the market’s volatility, providing a visual guide to the strength and potential direction of price movements.
How to Trade with Volatility ATR Band:
Identify Trend Direction: When the bands slope upwards, the market is trending upwards, which may be a good opportunity to consider a long position. When the bands slope downward, the market is trending downwards, which could be a sign to sell or short.
Volatility Awareness: The wider the bands, the higher the market volatility. Narrow bands suggest a quieter market, which might indicate consolidation or a potential breakout/breakdown.
Confirm Entries and Exits: Use the bands as dynamic support and resistance; entering trades as the price bounces off the bands and considering exits as it reaches the opposite side or breaches the bands.
Hope you enjoy this script!
Happy trading!
Bands

Relative Average Extrapolation [ChartPrime]Relative Average Extrapolation (ChartPrime) is a new take on session averages, like the famous vwap . This indicator leverages patterns in the market by leveraging average-at-time to get a footprint of the average market conditions for the current time. This allows for a great estimate of market conditions throughout the day allowing for predictive forecasting. If we know what the market conditions are at a given time of day we can use this information to make assumptions about future market conditions. This is what allows us to estimate an entire session with fair accuracy. This indicator works on any intra-day time frame and will not work on time frames less than a minute, or time frames that are a day or greater in length. A unique aspect of this indicator is that it allows for analysis of pre and post market sessions independently from regular hours. This results in a cleaner and more usable vwap for each individual session. One drawback of this is that the indicator utilizes an average for the length of a session. Because of this, some after hour sessions will only have a partial estimation. The average and deviation bands will work past the point where it has been extrapolated to in this instance however. On low time frames due to the limited number of data points, the indicator can appear noisy.
Generally crypto doesn't have a consistent footprint making this indicator less suitable in crypto markets. Because of this we have implemented other weighting schemes to allow for more flexibility in the number of use cases for this indicator. Besides volume weighting we have also included time, volatility, and linear (none) weighting. Using any one of these weighting schemes will transform the vwap into a wma, volatility adjusted ma, or a simple moving average. All of the style are still session period and will become longer as the session progresses.
Relative Average Extrapolation (ChartPrime) works by storing data for each time step throughout the day by utilizing a custom indexing system. It takes the a key , ie hour/minute, and transforms it into an array index to stor the current data point in its unique array. From there we can take the current time of day and advance it by one step to retrieve the data point for the next bar index. This allows us to utilize the footprint the extrapolate into the future. We use the relative rate of change for the average, the relative deviation, and relative price position to extrapolate from the current point to the end of the session. This process is fast and effective and possibly easier to use than the built in map feature.
If you have used vwap before you should be familiar with the general settings for this indicator. We have made a point to make it as intuitive for anyone who is already used to using the standard vwap. You can pick the source for the average and adjust/enable the deviation bands multipliers in the settings group. The average period is what determines the number of days to use for the average-at-time. When it is set to 0 it will use all available data. Under "Extrapolation" you will find the settings for the estimation. "Direction Sensitivity" adjusts how sensitive the indicator is to the direction of the vwap. A higher number will allow it to change directions faster, where a lower number will make it more stable throughout the session. Under the "Style" section you will find all of the color and style adjustments to customize the appearance of this indicator.
Relative Average Extrapolation (ChartPrime) is an advanced and customizable session average indicator with the ability to estimate the direction and volatility of intra-day sessions. We hope you will find this script fascinating and useful in your trading and decision making. With its unique take on session weighting and forecasting, we believe it will be a secret weapon for traders for years to come.
Enjoy

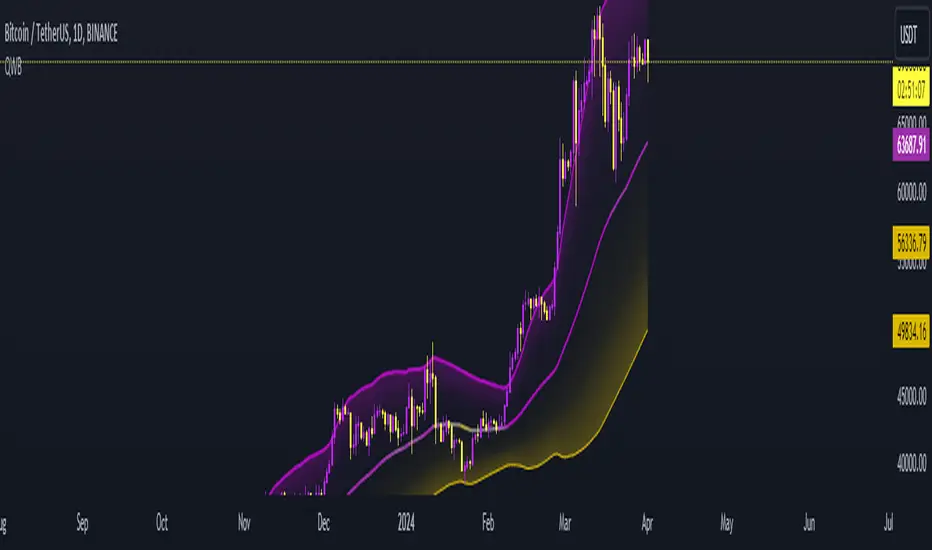
Quadratic Weighted Bands"Quadratic Weighted Bands" (QWB) is designed to identify and visualize market trends and volatility using quadratic weighted filtering techniques. It works by applying quadratic weighting to a selected data source over a specified length, enhancing the sensitivity and responsiveness of the indicator to recent market movements. A major advantage of this indicator is the ability to have a longer lookback period without having too much lag. This results in a smoother output that is still very responsive. Its about twice as fast as a normal average so adjust accordingly.
The indicator is customizable, allowing users to select between the normal Quadratic Weighting (QWF) and Volume Quadratic Weighting (VQWF), choose their data source, adjust the lookback period, and modify the deviation multiplier to fit their analysis needs. Additionally, users can customize the colors of the bands and center line.
The color of the central line changes based on the direction of the trend, as well as having a neutral (ranging) color. This visual aspect makes it easier for traders to quickly see the strength and direction of the market.
Style Select: Choose between "Normal Quadratic Weighting" or "Volume Quadratic Weighting" to adapt the indicator based on volume data or standard price data.
Source: This allows for the selection of the input source for the indicator, such as HL2, ensuring the analysis is aligned with specific trading preferences.
Length: Define the lookback period for the average, with the system automatically utilizing the maximum available length if the specified range exceeds available data, ensuring it always works.
Deviation Length: Optionally adjust the lookback period for calculating deviation, enhancing the indicator's sensitivity and accuracy in identifying market volatility.
Multiplier: Fine tune the deviation multiplier to control the width of the bands, allowing traders to adjust for market volatility and personal risk tolerance.
Top Color: Customize the color of the top band, which also affects the center line's appearance. Adjusting the brightness provides visual clarity and personalization.
Bottom Color: Similarly, select the color for the bottom band, which also influences the center line. The option to adjust brightness ensures the indicator's readability and aesthetic preference.
Neutral Color: Designate a color for indicating a ranging market.
Enjoy
ATR Bands with Optional Risk/Reward Colors█ OVERVIEW
This indicator projects ATR bands and, optionally, colors them based on a risk/reward advantage for those who trade breakouts/breakdowns using moving averages as partial or full exit points.
█ DEFINITIONS
► True Range
The True Range is a measure of the volatility of a financial asset and is defined as the maximum difference among one of the following values:
- The high of the current period minus the low of the current period.
- The absolute value of the high of the current period minus the closing price of the previous period.
- The absolute value of the low of the current period minus the closing price of the previous period.
► Average True Range
The Average True Range was developed by J. Welles Wilder Jr. and was introduced in his 1978 book titled "New Concepts in Technical Trading Systems". It is calculated as an average of the true range values over a certain number of periods (usually 14) and is commonly used to measure volatility and set stop-loss and profit targets (1).
For example, if you are looking at a daily chart and you want to calculate the 14-day ATR, you would take the True Range of the previous 14 days, calculate their average, and this would be the ATR for that day. The process is then repeated every day to obtain a series of ATR values over time.
The ATR can be smoothed using different methods, such as the Simple Moving Average (SMA), the Exponential Moving Average (EMA), or others, depending on the user's preferences or analysis needs.
► ATR Bands
The ATR bands are created by adding or subtracting the ATR from a reference point (usually the closing price). This process generates bands around the central point that expand and contract based on market volatility, allowing traders to assess dynamic support and resistance levels and to adapt their trading strategies to current market conditions.
█ INDICATOR
► ATR Bands
The indicator provides all the essential parameters for calculating the ATR: period length, time frame, smoothing method, and multiplier.
It is then possible to choose the reference point from which to create the bands. The most commonly used reference points are Open, High, Low, and Close, but you can also choose the commonly used candle averages: HL2, HLC3, HLCC4, OHLC4. Among these, there is also a less common "OC2", which represents the average of the candle body. Additionally, two parameters have been specifically created for this indicator: Open/Close and High/Low.
With the "Open/Close" parameter, the upper band is calculated from the higher value between Open and Close, while the lower one is calculated from the lower value between Open and Close. In the case of bullish candles, therefore, the Close value is taken as the starting point for the upper band and the Open value for the lower one; conversely, in bearish candles, the Open value is used for the upper band and the Close value for the lower band. This setting can be useful for precautionally generating broader bands when trading with candlesticks like hammers or inverted hammers.
The "High/Low" parameter calculates the upper band starting from the High and the lower band starting from the Low. Among all the available options, this one allows drawing the widest bands.
Other possible options to improve the drawing of ATR bands, aligning them with the price action, are:
• Doji Smoothing: When the current candle is a doji (having the same Open and Close price), the bands assume the values they had on the previous candle. This can be useful to avoid steep fluctuations of the bands themselves.
• Extend to High/Low: Extends the bands to the High or Low values when they exceed the value of the band.
• Round Last Cent: Expands the upper band by one cent if the price ends with x.x9, and the lower band if the price ends with x.x1. This function only works when the asset's tick is 0.01.
► Risk/Reward Advantage
The indicator optionally colors the ATR bands after setting a breakpoint, one or two risk/reward ratios, and a series of moving averages. This function allows you to know in advance whether entering a trade can provide an advantage over the risk. The band is colored when the ratio between the distance from the break point to the band and the distance from the break point to the first available moving average reaches at least the set ratio value. It is possible to set two colorings, one for a minimum risk/reward ratio and one for an optimal risk/reward ratio.
The break point can be chosen between High/Low (High in case of breakout, Low in case of breakdown) or Open/Close (on breakouts, Close with bullish candles or Open with bearish candles; on breakdowns, Close with bearish candles or Open with bullish candles).
It is possible to choose up to 10 moving averages of various types, including the VWAP with the Anchor Period (2).
Depending on the "Price to MA" setting, the bands can be individually or simultaneously colored.
By selecting "Single Direction," the risk/reward calculation is performed only when all moving averages are above or below the break point, resulting in only one band being colored at a time. For this reason, when the break point is in between the moving averages, the calculation is not executed. This setting can be useful for strategies involving price movement from a level towards a series of specific moving averages (for example, in reversals starting from a certain level towards the VWAP with possible partial take profits on some previous moving averages, or simply in trend following towards one or more moving averages).
Choosing "Both Directions" the risk/reward ratio is calculated based on the first available moving averages both above and below the price. This setting is useful for those who operate in range bound markets or simply take advantage of movements between moving averages.
█ NOTE
This script may not be suitable for scalping strategies that require immediate entries due to the inability to know the ATR of a candle in advance until its closure. Once the candle is closed, you should have time to place a stop or stop-limit order, so your strategy should not anticipate an immediate start with the next candle. Even more conveniently, if your strategy involves an entry on a pullback, you can place a limit order at the breakout level.
(1) www.tradingview.com
(2) For convenience, the code for the Anchor Period has been entirely copied from the VWAP code provided by TradingView.

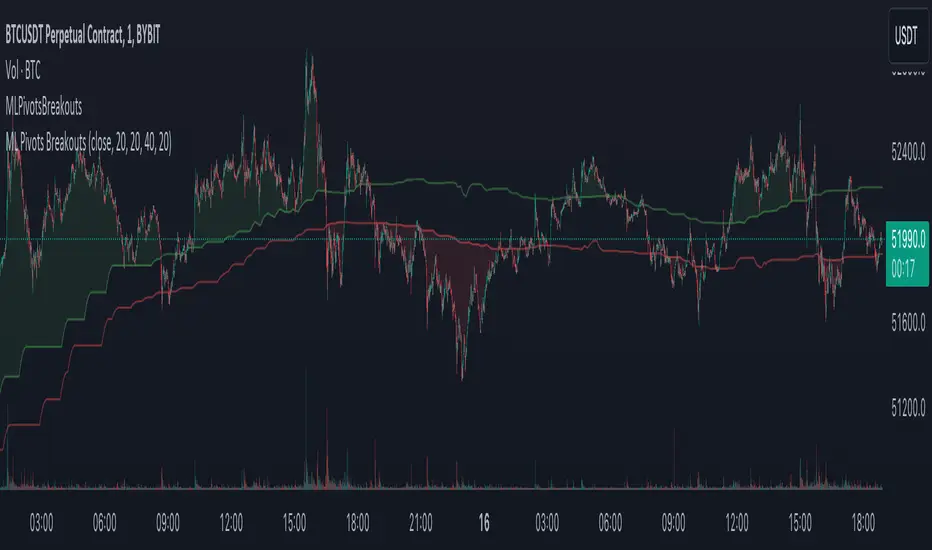
Machine Learning Breakouts (from Pivots)I developed the 'Machine Learning Breakouts (from Pivots)' indicator to revolutionize the way we detect breakout opportunities and follow trend, harnessing the power of pivot points and machine learning. This tool integrates the k-Nearest Neighbors (k-NN) method with the Euclidean distance algorithm, meticulously analyzing pivot points to accurately forecast multiple breakout paths/zones. "ML Pivots Breakouts" is designed to identify and visually alert traders on bullish breakouts above high lines and bearish breakouts below low lines, offering essential insights for breakout and trend follower traders.
For traders, the instruction is clear: a bullish breakout signal is given when the price crosses above the forecasted high line, indicating potential entry points for long positions. Conversely, a bearish breakout signal is provided when the price breaks below the forecasted low line, suggesting opportunities to enter short positions. This makes the indicator a vital asset for navigating through market volatilities and capitalizing on emerging trends, designed for both long and short strategies and adeptly adapting to market shifts.
In this indicator I operate in a two-dimensional space defined by price and time. The choice of Euclidean distance as the preferred method for this analysis hinges on its simplicity and effectiveness in measuring and predicting straight-line distances between points in this space.
The Machine Learning Breakouts (from Pivots) Indicator calculations have been transitioned to the MLPivotsBreakouts library, simplifying the process of integration. Users can now seamlessly incorporate the "breakouts" function into their scripts to conduct detailed momentum analysis with ease.
Kernel Regression RibbonKernel Regression Ribbon is a flexible, visually pleasing trend identification tool. Plotting 8 different kernel regressions of different types and parameters allows the user to see where levels of support and resistance are being tested, retested and broken.
What’s Kernel Regression?
A statistical method for estimating the best fitting curve for a dataset, in this case, a time/price chart.
How’s Kernel Regression different from a Moving Average?
A Moving Average is basically a simple form of Kernel Regression, in that it uses a fixed (Retangular) Kernel function. In an MA, all data points are weighted equally over its length. However, a Kernel function reacts more to data points that are closer to the current point. This means it will adapt more quickly to changes in data than an MA. Due to this adaptability, Kernel functions often form part of Machine Learning.
Using this indicator:
Explore the default Regular mode first to get a feel for the inputs, which are more numerous than for MAs. Try out different settings, filters and intervals to get the best out of each kernel. Not all parameters are available for each KR. There are info tips to explain this in the menu, but I’ve also included handy, optional labels on the chart for each KR as a more accessible guide.
Once you know your way round the Regular mode, check out the Presets and start changing the parameters of each kernel to your liking in the “User KR1, KR2, … “ mode. Each kernel type has its strong and weak points. Blending different kernels is where this indicator comes into its own. Give your charts a funky shine!
This indicator does NOT repaint.
This script acknowledges, and hopefully showcases, the great work of @veryfid Kernel Regression Toolkit.

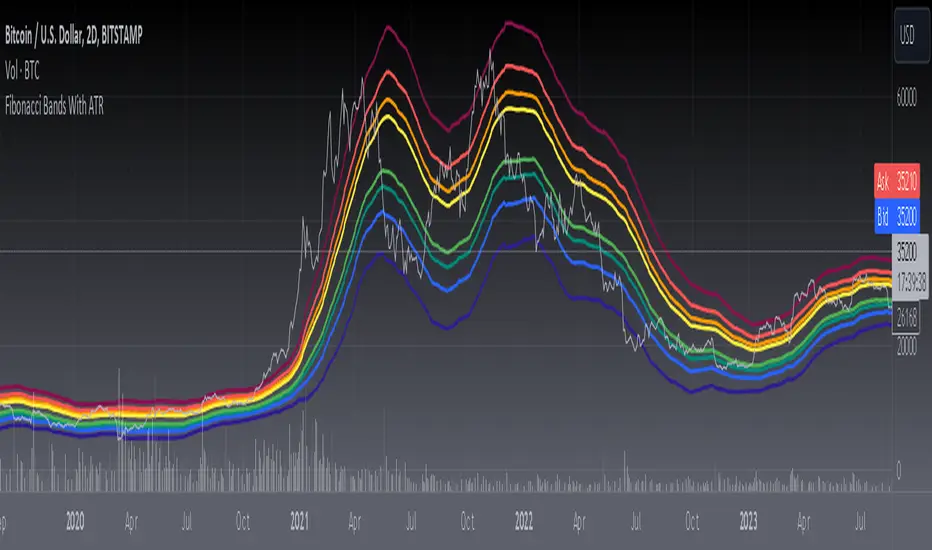
[blackcat] L3 Fibonacci Bands With ATRToday, what I'm going to introduce is a technical indicator that I think is quite in line with the indicator displayed by Tang - Fibonacci Bands with ATR. This indicator combines Bollinger Bands and Average True Range (ATR) to provide insights into market volatility and potential price reversals. Sounds complicated, right? Don't worry, I will explain it to you in the simplest way.
First, let's take a look at how Fibonacci Bands are constructed. They are similar to Bollinger Bands and consist of three lines: upper band, middle band (usually a 20-period simple moving average), and lower band. The difference is that Fibonacci Bands use ATR to calculate the distance between the upper and lower bands and the middle band.
Next is a key factor - ATR multiplier. We need to smooth the ATR using Welles Wilder's method. Then, by multiplying the ATR by a Fibonacci multiplier (e.g., 1.618), we get the upper band, called the upper Fibonacci channel. Similarly, multiplying the ATR by another Fibonacci multiplier (e.g., 0.618 or 1.0) gives us the lower band, called the lower Fibonacci channel.
Now, let's see how Fibonacci Bands can help us assess market volatility. When the channel widens, it means that market volatility is high, while a narrow channel indicates low market volatility. This way, we can determine the market's activity level based on the width of the channel.
In addition, when the price touches or crosses the Fibonacci channel, it may indicate a potential price reversal, similar to Bollinger Bands. Therefore, using Fibonacci Bands in trading can help us capture potential buy or sell signals.
In summary, Fibonacci Bands with ATR is an interesting and practical technical indicator that provides information about market volatility and potential price reversals by combining Bollinger Bands and ATR. Remember, make good use of these indicators and apply them flexibly in trading!
This code is a TradingView indicator script used to plot L3 Fibonacci Bands With ATR.
First, the indicator function is used to define the title and short title of the indicator, and whether it should be overlaid on the main chart.
Then, the input function is used to define three input parameters: MA type (maType), MA length (maLength), and data source (src). There are four options for MA type: SMA, EMA, WMA, and HMA. The default values are SMA, 55, and hl2 respectively.
Next, the moving average line is calculated based on the user's selected MA type. If maType is 'SMA', the ta.sma function is called to calculate the simple moving average; if maType is 'EMA', the ta.ema function is called to calculate the exponential moving average; if maType is 'WMA', the ta.wma function is called to calculate the weighted moving average; if maType is 'HMA', the ta.hma function is called to calculate the Hull moving average. The result is then assigned to the variable ma.
Then, the _atr variable is used to calculate the ATR (Average True Range) value using ta.atr, and multiplied by different coefficients to obtain four Fibonacci bias values: fibo_bias4, fibo_bias3, fibo_bias2, and fibo_bias1.
Finally, the prices of the upper and lower four Fibonacci bands are calculated by adding or subtracting the corresponding Fibonacci bias values from the current price, and plotted on the chart using the plot function.
RSI Bands + Levels (Miu)This indicator was designed to plot lines from prices of overbought (OB) and oversold (OS) RSI levels in chart. It will also create a visible band between these levels.
It's main utility is to show in chart current and past prices for OB/OS RSI levels. Traditionally the RSI is considered overbought when above 70 and oversold when below 30 but you can customize these values in settings. The RSI oscillates between zero and 100.
Users can easily identify overbought and oversold prices using this indicator and then it is expected to help users to make better strategic decisions with their trades.
There are some extra options available in settings:
- Customizable RSI levels
- Customizable RSI length
- RSI Levels: if activated, it will draw lines above OB line and below OS line according to the multiplier, so it will plot sequential lines that goes in different RSI levels (e.g: RSI 72, 74, 76, 78 and 80).
- Backgroud only: it will remove these lines and keep only a backgroung color instead
- RSI 50: it will draw a line as RSI 50
- Customizable multiplier
Enjoy!

Intraday Volatility Bands [Honestcowboy]The Intraday Volatility Bands aims to provide a better alternative to ATR in the calculation of targets or reversal points.
How are they different from ATR based bands?
While ATR and other measures of volatility base their calculations on the previous bars on the chart (for example bars 1954 to 1968). The volatility used in these bands measure expected volatility during that time of the day.
Why would you take this approach?
Markets behave different during certain times of the day, also called sessions.
Here are a couple examples.
Asian Session (generally low volatility)
London Session (bigger volatility starts)
New York Session (overlap of New York with London creates huge volatility)
Generally when using bands or channel type indicators intraday they do not account for the upcoming sessions. On London open price will quickly spike through a bollinger band and it will take some time for the bands to adjust to new volatility.
This script will show expected volatility targets at the start of each new bar and will not adjust during the bar. It already knows what price is expected to do at this time of day.
Script also plots arrows when price breaches either the top or bottom of the bands. You can also set alerts for when this occurs. These are non repainting as the script knows the level at start of the bar and does not change.
🔷 CALCULATION
Think of this script like an ATR but instead it uses past days data instead of previous bars data. Charts below should visualise this more clearly:
The scripts measure of volatility is based on a simple high-low.
The script also counts the number of bars that exist in a day on your current timeframe chart. After knowing that number it creates the matrix used in it's calculations and data storage.
See how it works perfectly on a lower timeframe chart below:
Getting this right was the hardest part, check the coding if you are interested in this type of stuff. I commented every step in the coding process.
🔷 SETTINGS
Every setting of the script has a tooltip but I provided a breakdown here:
Some more examples of different charts:

Donchian MA Bands [LuxAlgo]The Donchian MA Bands script is a complete trend indicator derived from the popular Donchian channel indicator as well as various customizable moving averages to estimate trend direction and build support/resistance levels & zones.
🔶 USAGE
The indicator outputs various elements, the main ones being a lower dynamic zone (blue by default), an upper dynamic zone (in orange by default), and one support and resistance level/zones (red/green by default).
A prominent lower zone is indicative of an uptrend, while a prominent upper zone is indicative of a downtrend. These zones can be used as support/resistance as well.
Support/resistance zones and levels can be used using a breakout methodology or to determine price bounced if a level was tested multiple times.
The indicator contains various modes affecting the output of the indicator, described below.
🔹 Clouds
Clouds return one upper/lower dynamic zone and look/act similarly to a trailing stop. Price over the lower zone is indicative of an uptrend, and price under the upper zone is indicative of a downtrend.
🔹 Upper Band
The upper band mode returns a dynamic zone closer to prices during an uptrend, and farther away during a downtrend.
This band can act as a support during uptrends.
🔹 Lower Band
The lower band mode returns a dynamic zone closer to prices during an uptrend, and farther away during a downtrend.
This band can act as a resistance during downtrends.
🔹 Bands
Bands return both upper and lower zones, the zones are more apparent depending on the price trend direction, with uptrends being indicated by a more visible lower zone, and downtrends being indicated by a more visible upper zone.
Breakout dots are highlighted when price breakout the indicator displayed extremities, and can be indicative of a confirmed trend reversal.
These breakouts can be more effective for trend following during trending markets. Ranging markets might return breakouts highlighting the top/bottom.
🔶 DETAILS
The core of this script is the highest / lowest mean average (MA) value for a given number of bars back ( Donchian lines).
This is repeated a few times with the obtained values.
When Bands are chosen ( Style ) this will be repeated 1 more time.
The type of mean average can be customized ( Type MA ), as well as the number of bars back ( Length ).
Depending on the choice of bands ( Style ) the script will focus on certain area's of interest.
When the option Clouds , Upper band or Lower band is chosen, an extra feature, support/resistance (S/R), will be shown.
These color-filled areas are visible when there is a difference between the 2nd and 3rd highest/lowest values.
The lines/areas can be used for stop loss, entry, exit,...
You can set the type of MA and Length separately ( Settings -> S/R ).
If you don't need this feature, simply set Type ( Settings -> S/R ) -> NONE
The shape sometimes resembles triangles, indicating a potential direction
Default the average of the highest and lowest values is plotted (Style -> Mid Donchian)
This can act as potential support/resistance or visualization of the trend, the mean average is not plotted but can be (Style -> MA)
🔹 Note
When the option Bands is chosen, an indication is plotted when the closing price breaks above the highest band or breaks below the lower band. This isn't necessarily a buy/sell signal, it is merely a signal that these lines are broken.
Users should decide on their own how they use the bands/lines/areas as entry, exit, trailing stop, stop loss, profit taking,...
🔶 SETTINGS
🔹 Bands
Style: Clouds (default), Upper band, Lower band, Bands
Type MA: choose between SMA, EMA, RMA, HullMA, WMA, VWMA (default), DEMA, TEMA, NONE (off)
Length: Length of moving average and Donchian calculations (default 20)
Colour Bands
🔹 S/R (Support/Resistance, visible with Clouds, Upper band or Lower band)
Type MA: choose between SMA, EMA, RMA, HullMA, WMA, VWMA (default), DEMA, TEMA, NONE (off)
Length: Length of moving average and Donchian calculations (default 20)
Colour S/R

Bitcoin wave modelBitcoin wave model is based on the logarithmic regression model and the sinusoidal waves, induced by the halving events.
This chart presents the outcome of an in-depth analysis of the complete set of Bitcoin price data available from October 2009 to August 2023.
The central concept is that the logarithm of the Bitcoin price closely adheres to the logarithmic regression model. If we plot the logarithm of the price against the logarithm of time, it forms a nearly straight line.
The parameters of this model are provided in the script as follows: log (BTCUSD) = 1.48 + 5.44log(h).
The secondary concept involves employing the inherent time unit of Bitcoin instead of days:
'h' denotes a slightly adjusted time measurement intrinsic to the Bitcoin blockchain. It can be approximated as (days since the genesis block) * 0.0007. Precisely, 'h' is defined as follows: h = 0 at the genesis block, h = 1 at the first halving block, and so forth. In general, h = block height / 210,000.
Adjustments are made to account for variations in block creation time.
The third concept revolves around investigating halving waves triggered by supply shock events resulting from the halvings. These halvings occur at regular intervals in Bitcoin's native time 'h'. All halvings transpire when 'h' is an integer. These events induce waves with intervals denoted as h = 1.
Consequently, we can model these waves using a sin(2pih - a) function. The parameter determining the time shift is assessed as 'a = 0.4', aligning with earlier expectations for halving events and their subsequent outcomes.
The fourth concept introduces the notion that the waves gradually diminish in amplitude over the progression of "time h," diminishing at a rate of 0.7^h.
Lastly, we can create bands around the modeled sinusoidal waves. The upper band is derived by multiplying the sine wave by a factor of 3.1*(1-0.16)^h, while the lower band is obtained by dividing the sine wave by the same factor, 3.1*(1-0.16)^h.
The current bandwidth is 2.5x. That means that the upper band is 2.5 times the lower band. These bands are forming an exceptionally narrow predictive channel for Bitcoin. Consequently, a highly accurate estimation of the peak of the next cycle can be derived.
The prediction indicates that the zenith past the fourth halving, expected around the summer of 2025, could result in prices ranging between 200,000 and 240,000 USD.
Enjoy the mathematical insights!

Oscillator Profile IndicatorDescription:
The Oscillator Profile Indicator (OPI) is designed to provide insights into market trends and potential reversal points by profiling the value distribution of an oscillator or the price chart over a specified lookback period.
The OPI works by calculating the Point of Control (PoC) for the oscillator values or prices in the given lookback period. This PoC, essentially a median, is considered the fair value where most trading activities have happened. Along with this, OPI also calculates lower and upper boundaries by taking the specified percentile of the sorted distribution of values. These boundaries outline the value area within which a significant portion of trading activity has occurred.
The main feature of the OPI is the interpretation of PoC movement and how it relates to general market trends. If the PoC moves above 0 on the oscillator, it's a potential indication that we are in a general uptrend. Conversely, if the PoC moves below 0, this can be a signal for a general downtrend.
Usage:
While OPI can be used on both price charts and oscillators, its effectiveness is more pronounced when used on oscillators. Applying this indicator to oscillators such as the Relative Strength Index (RSI) or the Moving Average Convergence Divergence (MACD) can provide useful insights.
How to Read:
PoC line: The line represents the median of the past 'n' periods. Its movement above or below 0 can be used to identify general uptrends or downtrends respectively.
Upper and Lower Boundary lines: These lines represent the specified percentile of the value distribution in the lookback period.
Colored Fills: The fills between the upper and lower boundary lines visually represent the value area. The color changes based on the relative position of the source value (price or oscillator value) to the PoC.
Signals:
An uptrend is indicated when the PoC moves above 0 on the oscillator, especially when coupled with an upward crossover of the source value through the PoC.
A downtrend is signaled when the PoC drops below 0 on the oscillator, particularly when paired with a downward crossover of the source value through the PoC.
(!) Note: Like all indicators, OPI should be used in conjunction with other technical analysis tools for the best results. It is also advisable to backtest this indicator with your strategy before using it in live trading.

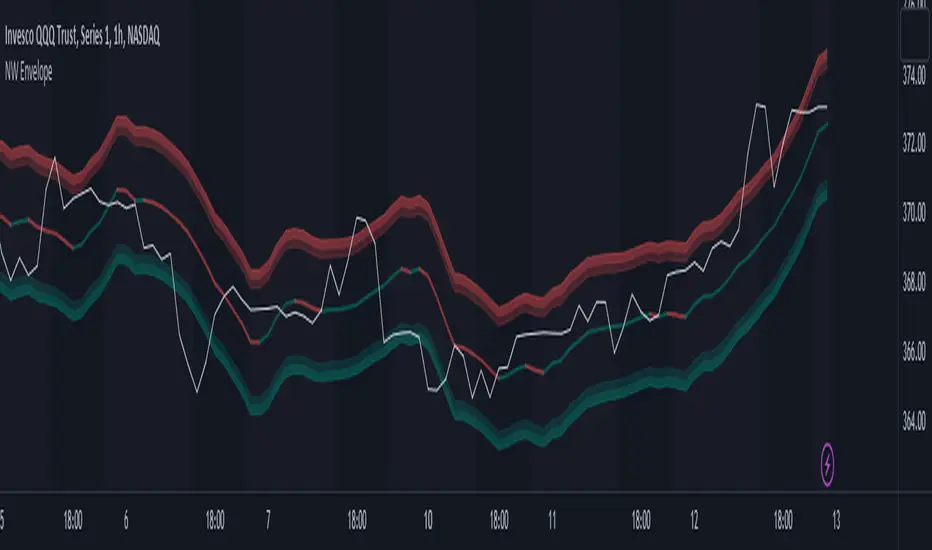
Nadaraya-Watson Envelope (Non-Repainting) Logarithmic ScaleIn the fast-paced world of trading, having a reliable and accurate indicator can make all the difference. Enter the Nadaraya-Watson Envelope Indicator, a cutting-edge tool designed to provide traders with valuable insights into market trends and potential price movements. In this article, we'll explore the advantages of this non-repainting indicator and how it can empower traders to make informed decisions with confidence.
Accurate Price Analysis:
The Nadaraya-Watson Envelope Indicator operates in a logarithmic scale, allowing for more accurate price analysis. By considering the logarithmic nature of price movements, this indicator captures the subtle nuances of market dynamics, providing a comprehensive view of price action. Traders can leverage this advantage to identify key support and resistance levels, spot potential breakouts, and anticipate trend reversals.
Non-Repainting Reliability:
One of the most significant advantages of the Nadaraya-Watson Envelope Indicator is its non-repainting nature. Repainting indicators can mislead traders by changing historical signals, making it difficult to evaluate past performance accurately. With the non-repainting characteristic of this indicator, traders can have confidence in the reliability and consistency of the signals generated, ensuring more accurate backtesting and decision-making.
Customizable Parameters:
Every trader has unique preferences and trading styles. The Nadaraya-Watson Envelope Indicator offers a range of customizable parameters, allowing traders to fine-tune the indicator to their specific needs. From adjusting the lookback window and relative weighting to defining the start of regression, traders have the flexibility to adapt the indicator to different timeframes and trading strategies, enhancing its effectiveness and versatility.
Envelope Bounds and Estimation:
The Nadaraya-Watson Envelope Indicator calculates upper and lower bounds based on the Average True Range (ATR) and specified factors. These envelope bounds act as dynamic support and resistance levels, providing traders with valuable reference points for potential price targets and stop-loss levels. Additionally, the indicator generates an estimation plot, visually representing the projected price movement, enabling traders to anticipate market trends and make well-informed trading decisions.
Visual Clarity with Plots and Fills:
Clear visualization is crucial for effective technical analysis. The Nadaraya-Watson Envelope Indicator offers plots and fills to enhance visual clarity and ease of interpretation. The upper and lower boundaries are plotted, along with the estimation line, allowing traders to quickly assess price trends and volatility. Fills between the boundaries provide a visual representation of different price regions, aiding in identifying potential trading opportunities and risk management.
Conclusion:
The Nadaraya-Watson Envelope Indicator is a powerful tool for traders seeking accurate and reliable insights into market trends and price movements. With its logarithmic scale, non-repainting nature, customizable parameters, and visual clarity, this indicator equips traders with a competitive edge in the financial markets. By harnessing the advantages offered by the Nadaraya-Watson Envelope Indicator, traders can navigate the complexities of trading with confidence and precision. Unlock the potential of this advanced indicator and elevate your trading strategy to new heights.
Multi-Band Breakout IndicatorThe Multi-Band Breakout Indicator was created to help identify potential breakout opportunities in the market. It combines multiple bands (ATR-Based and Donchian) and moving averages to provide valuable insights into the underlying trend and potential breakouts. By understanding the calculations, interpretation, parameter adjustments, potential applications, and limitations of the indicator, traders can effectively incorporate it into their trading strategy.
Calculation:
The indicator utilizes several calculations to plot the bands and moving averages. The length parameter determines the period used for the Average True Range (ATR), which measures volatility. A higher length captures a longer-term view of price movement, while a lower length focuses on shorter-term volatility. The multiplier parameter adjusts the distance of the upper and lower bands from the ATR. A higher multiplier expands the bands, accommodating greater price volatility, while a lower multiplier tightens the bands, reflecting lower volatility. The MA Length parameter determines the period for the moving averages used to calculate the trend and trend moving average. A higher MA Length creates a smoother trend line, filtering out shorter-term fluctuations, while a lower MA Length provides a more sensitive trend line.
The Donchian calculations in the Multi-Band Breakout Indicator play a significant role in identifying potential breakout opportunities and providing additional confirmation for trading signals. In this indicator, the Donchian calculations are applied to the trend line, which represents the average of the upper and lower bands. To calculate the Donchian levels, the indicator uses the Donchian Length parameter, which determines the period over which the highest high and lowest low are calculated. A longer Donchian Length captures a broader price range, while a shorter length focuses on more recent price action. By incorporating the Donchian calculations into the Multi-Band Breakout Indicator, traders gain an additional layer of confirmation for breakout signals.
Interpretation:
The Multi-Band Breakout Indicator offers valuable interpretation for traders. The upper and lower bands represent dynamic levels of resistance and support, respectively. These bands reflect the potential price range within which the asset is expected to trade. The trend line is the average of these bands and provides a central reference point for the overall trend. When the price moves above the upper band, it suggests a potential overbought condition and a higher probability of a pullback. Conversely, when the price falls below the lower band, it indicates a potential oversold condition and an increased likelihood of a bounce. The trend moving average further smooths the trend line, making it easier to identify the prevailing direction.
The crossover of the trend line (representing the average of the upper and lower bands) and the trend moving average holds a significant benefit for traders. This crossover serves as a powerful signal for potential trend changes and breakout opportunities in the market. When the trend line crosses above the trend moving average, it suggests a shift in momentum towards the upside, indicating a potential bullish trend. This provides traders with an early indication of a possible upward movement in prices. Conversely, when the trend line crosses below the trend moving average, it indicates a shift in momentum towards the downside, signaling a potential bearish trend. This crossover acts as an early warning for potential downward price movement. By identifying these crossovers, traders can capture the initial stages of a new trend, enabling them to enter trades at favorable entry points and potentially maximize their profit potential.
Breakout Signals:
For bullish breakouts, the indicator looks for a bullish crossover between the trend line and the trend moving average. This crossover suggests a shift in momentum towards the upside. Additionally, it checks if the current price has broken above the upper band and the previous Donchian high. This confirms that the price is surpassing a previous resistance level, indicating further upward movement.
For bearish breakouts, the indicator looks for a bearish crossunder between the trend line and the trend moving average. This crossunder indicates a shift in momentum towards the downside. It also checks if the current price has broken below the lower band and the previous Donchian low. This confirms that the price is breaking through a previous support level, signaling potential downward movement.
When a bullish or bearish breakout is detected, it suggests a potential trading opportunity. Traders may consider initiating positions in the direction of the breakout, anticipating further price movement in that direction. However, it's important to remember that breakouts alone do not guarantee a successful trade. Other factors, such as market conditions, volume, and confirmation from additional indicators, should be taken into account. Risk management techniques should also be implemented to manage potential losses.
Coloration:
The coloration in the Multi-Band Breakout Indicator is used to visually represent different aspects of the indicator and provide valuable insights to traders. Let's break down the coloration components:
-- Trend/Basis Color : The tColor variable determines the color of the bars based on the relationship between the trend line (trend) and the closing price (close), as well as the relationship between the trend line and the trend moving average (trendMA). If the trend line is above the closing price and the trend moving average is also above the closing price, the bars are colored fuchsia, indicating a potential bullish trend. If the trend line is below the closing price and the trend moving average is also below the closing price, the bars are colored lime, indicating a potential bearish trend. If neither of these conditions is met, the bars are colored yellow, representing a neutral or indecisive market condition.
-- Moving Average Color : The maColor variable determines the color of the filled area between the trend line and the trend moving average. If the trend line is above the trend moving average, the area is filled with a lime color with 70% opacity, indicating a potential bullish trend. Conversely, if the trend line is below the trend moving average, the area is filled with a fuchsia color with 70% opacity, indicating a potential bearish trend. This coloration helps traders visually identify the relationship between the trend line and the trend moving average.
-- highColor and lowColor : The highColor and lowColor variables determine the colors of the high Donchian band (hhigh) and the low Donchian band (llow), respectively. These bands represent dynamic levels of resistance and support. If the highest point in the previous Donchian period (hhigh) is above the upper band, the highColor is set to olive with 90% opacity, indicating a potential resistance level. On the other hand, if the lowest point in the previous Donchian period (llow) is below the lower band, the lowColor is set to red with 90% opacity, suggesting a potential support level. These colorations help traders quickly identify important price levels and assess their significance in relation to the bands.
By incorporating coloration, the Multi-Band Breakout Indicator provides visual cues to traders, making it easier to interpret the relationships between various components and assisting in identifying potential trend changes and breakout opportunities. Traders can use these color cues to quickly assess the prevailing market conditions and make informed trading decisions.
Adjusting Parameters:
The Multi-Band Breakout Indicator offers flexibility through parameter adjustments. Traders can customize the indicator based on their preferences and trading style. The length parameter controls the sensitivity to price changes, with higher values capturing longer-term trends, while lower values focus on shorter-term price movements. By adjusting the parameters, such as the ATR length, multiplier, Donchian length, and MA length, traders can customize the indicator to suit different timeframes and trading strategies. For shorter timeframes, smaller values for these parameters may be more suitable, while longer timeframes may require larger values.
Potential Applications:
The Multi-Band Breakout Indicator can be applied in various trading strategies. It helps identify potential breakout opportunities, allowing traders to enter trades in the direction of the breakout. Traders can use the indicator to initiate trades when the price moves above the upper band or below the lower band, confirming a potential breakout and providing a signal to enter a trade. Additionally, the indicator can be combined with other technical analysis tools, such as support and resistance levels, candlestick patterns, or trend indicators, to increase the probability of successful trades. By incorporating the Multi-Band Breakout Indicator into their trading approach, traders can gain a better understanding of market trends and capture potential profit opportunities.
Limitations:
While the Multi-Band Breakout Indicator is a useful tool, it has some limitations that traders should consider. The indicator performs best in trending markets where price movements are relatively strong and sustained. During ranging or choppy market conditions, the indicator may generate false signals, leading to potential losses. It is crucial to use the indicator in conjunction with other analysis techniques and risk management strategies to enhance its effectiveness. Additionally, traders should consider external factors such as market news, economic events, and overall market sentiment when interpreting the signals generated by the indicator.
By combining multiple bands and moving averages, this indicator offers valuable insights into the underlying trend and helps traders make informed trading decisions. With customization options and careful interpretation, this indicator can be a valuable addition to any trader's toolkit, assisting in identifying potential breakouts, capturing profitable trades, and enhancing overall trading performance.

Scalp Tool
This script is primarily intended as a scalping tool.
The theory of the tool is based on the fact that the price always returns to its mean.
Elements used:
1. VWMA as a moving average. VWMA is calculated once based on source close and once based on source open.
2. the bands are not calculated like the Bollinger Band, but only a settlement is calculated for the lower bands based on the Lows and for the upper bands based on the Highs. Thus the bands do not become thicker or thinner, but remain in the same measure to the mean value above or below the price.
3. a volume filter on simple calculation of a MA with deviation. Therefore, it can be identified if a volume breakout has occurred.
4. support and resistance zones which are calculated based on the highs and lows over a certain length.
5. RSI to determine oversold and overbought zones. It also tries to capture the momentum by using a moving average (variable selectable) to filter the signals. The theory is that in an uptrend the RSI does not go below 50 and in a downtrend it does not go above 50.
However, this can be very different depending on the financial instrument.
Explanation of the signals:
The main signal in this indicator Serves for pure short-term trading and is generated purely on the basis of the bands and the RSI.
Only the first bands are taken into account.
Buy signal is generated when the price opens below the lower band 1 and closes above the lower band 1 or the RSI crosses a value of 25 from bottom to top.
Sell signal is generated when the price opens above the Upper Band 1 and closes below the Upper Band 1 or the RSI crosses a value of 75 from top to bottom.
The position should be closed when the price hits the opposite band. Alternatively, it can also be closed at the mean.
Other side signals:
1. breakouts:
The indicator includes 2 support and resistance zones, which differ only in length. For the breakout signals, the short version of the R/S is used. A signal is generated when the price breaks through the zones with increased volume. It is then assumed that the price will continue to follow the breakout.
The values of the S/R are adjustable and marked with "BK".
The value under Threshold 2 defines the volume breakout. 4 is considered as the highest value. The smaller the value, the smaller the volume must be during a breakout.
2. bounce
If the price hits a S/R (here the long variant is used with the designation "Support" or "Resistance") and makes a wick with small volume, the script assumes a bounce and generates a Sell or Buy signal accordingly.
The volume can be defined under "Threshold".
The S/R according to the designation as well.
Combined signals:
If the value of the S/R BK and the S/R is the same and the bounce logic of the S/R BK applies and an RSI signal is also generated, a signal is also plotted.
Here the idea was to get very strong signals for possible swing entries.
4. RSI Signals
The script contains two RSI.
RSI 1:
Bullish signal is generated when the set value is crossed from the bottom to the top.
Bearish signal is generated when the set value is crossed from the top to the bottom.
RSI 2:
Bullish signal is generated when the set value is crossed from the top to the bottom.
Bearish signal is generated when the set value is crossed from bottom to top.
For RSI 2 the theory is taken into account according to the description under Used elements point 5
Optical trend filter:
Also an optical trend filter was generated which fills the bands accordingly.
For this the VWMA is used and the two average values of the band.
Color definition:
Gray = Neutral
Red = Bearish
Green = Bullish
If the mean value is above the VWMA and the mean value based on the closing price is above the mean value based on the open price, the band is colored green. It is a bullish trend
If the mean value is below the VWMA and the mean value based on the closing price is below the mean value based on the open price, the band is colored red.
The band is colored gray if the mean value is correspondingly opposite. A sideways phase is assumed.
The script was developed on the basis of the pair BTCUSD in the 15 minute chart and the settings were defined accordingly on it. The display of S/R for forex pairs does not work correctly and should be hidden. The logic works anyway.
When using the script, all options should first be set accordingly to the asset and tested before trading afterwards. It applies of course also here that there is no 100% guarantee.
Also, a strong breakout leads to false signals and overheating of the indicator.

Volatility-Based Mean Reversion BandsThe Volatility-Based Mean Reversion Bands indicator is a powerful tool designed to identify potential mean reversion trading opportunities based on market volatility. The indicator consists of three lines: the mean line, upper band, and lower band. These bands dynamically adjust based on the average true range (ATR) and act as reference levels for identifying overbought and oversold conditions.
The calculation of the indicator involves several steps. The average true range (ATR) is calculated using a specified lookback period. The ATR measures the market's volatility by considering the range between high and low prices over a given period. The mean line is calculated as a simple moving average (SMA) of the closing prices over the same lookback period. The upper band is derived by adding the product of the ATR and a multiplier to the mean line, while the lower band is derived by subtracting the product of the ATR and the same multiplier from the mean line.
Interpreting the indicator is relatively straightforward. When the price approaches or exceeds the upper band, it suggests that the market is overbought and may be due for a potential reversal to the downside. On the other hand, when the price approaches or falls below the lower band, it indicates that the market is oversold and may be poised for a potential reversal to the upside. Traders can look for opportunities to enter short positions near the upper band and long positions near the lower band, anticipating the price to revert back towards the mean line.
The bar color and background color play a crucial role in visualizing the indicator's signals and market conditions. Lime-colored bars are used when the price is above the upper band, indicating a potential bearish mean reversion signal. Conversely, fuchsia-colored bars are employed when the price is below the lower band, suggesting a potential bullish mean reversion signal. This color scheme helps traders quickly identify the prevailing market condition and potential reversal zones. The background color complements the bar color by providing further context. Lime-colored background indicates a potential bearish condition, while fuchsia-colored background suggests a potential bullish condition. The transparency level of the background color is set to 80% to avoid obscuring the price chart while still providing a visual reference.
To provide additional confirmation for mean reversion setups, the indicator incorporates the option to use the Relative Strength Index (RSI) as a confluence factor. The RSI is a popular momentum oscillator that measures the speed and change of price movements. When enabled, the indicator checks if the RSI is in overbought territory (above 70) or oversold territory (below 30), providing additional confirmation for potential mean reversion setups.
In addition to visual signals, the indicator includes entry arrows above or below the bars to highlight the occurrence of short or long entries. When the price is above the upper band and the confluence condition is met, a fuchsia-colored triangle-up arrow is displayed above the bar, indicating a potential short entry signal. Similarly, when the price is below the lower band and the confluence condition is met, a lime-colored triangle-down arrow is displayed below the bar, indicating a potential long entry signal.
Traders can customize the indicator's parameters according to their trading preferences. The "Lookback Period" determines the number of periods used in calculating the mean line and the average true range (ATR). Adjusting this parameter can affect the sensitivity and responsiveness of the indicator. Smaller values make the indicator more reactive to short-term price movements, while larger values smooth out the indicator and make it less responsive to short-term fluctuations. The "Multiplier" parameter determines the distance between the mean line and the upper/lower bands. Increasing the multiplier widens the bands, indicating a broader range for potential mean reversion opportunities, while decreasing the multiplier narrows the bands, indicating a tighter range for potential mean reversion opportunities.
It's important to note that the Volatility-Based Mean Reversion Bands indicator is not a standalone trading strategy but rather a tool to assist traders in identifying potential mean reversion setups. Traders should consider using additional analysis techniques and risk management strategies to make informed trading decisions. Additionally, the indicator's performance may vary across different market conditions and instruments, so it's advisable to conduct thorough testing and analysis before integrating it into a trading strategy.

3 Fib EMAs To Scalp Them AllThe "3 Fib EMAs To Scalp Them All" was made in order to clear up when we should look for shorts, longs, or walk away. Also it can alert you when a trend starts, or when there is a possible reversal. I use it for scalping/day trading in 5m-1h timeframes.
1. EMAs: By default, the indicator uses Fibonacci numbers (21, 55, 233), but you can change them.
2. Color Changes: The color of the Micro EMA line changes depending on its relation to the Mid and Macro EMAs.
When Micro EMA < Mid < Macro EMA, it turns red, indicating a potential bearish trend - that's when you should look for shorts
When Micro EMA > Mid > Macro EMA, it turns green, indicating a potential bullish trend - that's when you should look for longs
A white Micro EMA is when you need to take some rest, enjoy your coffee, and avoid overtrading.
3. Signals: The indicator provides visual signals in the form of diamonds and crosses and corresponding alert signals.
A red diamond above the bar signals a potential beginning of a downtrend
A red cross above the bar signals the end of the downtrend and can be used as a signal for a possible reversal up/breakout.
A green diamond below the bar signals a potential beginning of a downtrend,
A green cross below the bar signals the end of the uptrend and can be used as a signal for a possible reversal down/breakout.
4. Alerts: For algo traders and people who prefer to stay away from the monitor... there are alerts for every signal.
Friendly note: Don't blindly follow the signals for your long and short entries. The signals only pop up when the EMA cross value gets a confirmation. A smart move would be to wait for a retracement to the EMA line and use momentum indicators like market cipher B to pinpoint those ideal entry points.

AggBands (v1) [qrsq]The "AggBands" indicator is a custom trading indicator designed to provide a consolidated view of the price action across multiple assets or trading pairs. It combines the price data from multiple tickers and calculates an aggregated price using user-defined weights for each ticker.
The indicator starts by defining the tickers to be included in the aggregation. You can choose from predefined configurations such as "BTC PAIRS," "CRYPTO TOTAL MARKET CAP," "TOP 5 PAIRS," "TOP 5 MEMECOINS," "SPX," "DXY," or "FANG." Each configuration includes specific tickers or indices relevant to the chosen category.
The indicator then fetches the closing, high, and low prices for each ticker and applies the user-defined weights to calculate the aggregated prices. The aggregated prices are normalized within a specified length to provide a consistent scale across different assets or pairs.
Next, the indicator calculates the midpoint, which is the average of the highest high and lowest low of the aggregated prices over a specified aggregation period.
To assess the volatility, the indicator calculates the price range and applies the Average True Range (ATR) indicator to determine the volatility value. The standard deviation is then computed using the price range and aggregation period, with an additional scaling factor applied to the volatility value.
Based on the standard deviation, the indicator generates multiple bands above and below the midpoint. By default, three standard deviation bands are calculated, but the user can choose between one and five bands. The upper and lower bands are smoothed using various moving average (MA) types, such as Simple Moving Average (SMA), Exponential Moving Average (EMA), Smoothed Moving Average (SMMA/RMA), Weighted Moving Average (WMA), Volume Weighted Moving Average (VWMA), Volume Weighted Average Price (VWAP), or Arnaud Legoux Moving Average (ALMA). The user can also adjust the length, offset, and sigma parameters for the moving averages.
The indicator can optionally smooth the midpoint, upper bands, and lower bands using a separate set of moving average parameters.
The indicator can be useful for traders and analysts who want to gain a consolidated view of price movements across multiple assets or trading pairs. It helps identify trends, volatility, and potential support and resistance levels based on the aggregated price and standard deviation bands. Traders can use this information to make informed decisions about trading strategies, risk management, and market analysis.

Alpha Fractal BandsWilliams fractals are remarkable support and resistance levels used by many traders. However, it can sometimes be challenging to use them frequently and get confirmation from other oscillators and indicators. With the new "Alpha Fractal Bands", a unique blend of Williams Fractals and Bollinger Bands emerges, offering a fresh perspective. Extremes can be utilized as price reversals or for taking profits. I look forward to hearing your thoughts. Best regards... Happy trading!
An easy solution for long positions is to:
Identify a bullish trend or a potential entry point for a long position.
Set a stop-loss order to limit potential losses if the trade goes against you.
Determine a target price or take-profit level to lock in profits.
Consider using technical indicators or analysis tools to confirm the strength of the bullish trend.
Regularly monitor the trade and make necessary adjustments based on market conditions.
An easy solution for short positions could be to follow these steps:
Identify a bearish trend or a potential entry point for a short position.
Set a stop-loss order to limit potential losses if the trade goes against you.
Determine a target price or take-profit level to lock in profits.
Consider using technical indicators or analysis tools to confirm the strength of the bearish trend.
Regularly monitor the trade and make necessary adjustments based on market conditions.
Remember, it's important to conduct thorough research and analysis before entering any trade and to manage your risk effectively.
To stay updated with the content, don't forget to follow and engage with it on TV, my friends. Remember to leave comments as well :)

Ultimate Trend ChannelThe "Ultimate Trend Channel" indicator is a comprehensive trend analysis tool that calculates and displays a series of upper and lower bands based on user-defined input lengths. It uses linear regression and standard deviation to determine these bands for each of the 21 different group lengths. The indicator then computes the averages of these upper and lower bands, as well as the average of all the bands combined.
The visualization on the chart includes the plotting of the average upper and lower bands, with the space between these bands shaded for easy visualization of the overall trend. Additionally, the average of all the bands, referred to as the "Ultimate Trend Line," is also plotted on the chart.
This indicator provides a robust way of assessing market trends and volatility over varying periods, which can be extremely useful for both short-term and long-term trading strategies.

Strongest TrendlineUnleashing the Power of Trendlines with the "Strongest Trendline" Indicator.
Trendlines are an invaluable tool in technical analysis, providing traders with insights into price movements and market trends. The "Strongest Trendline" indicator offers a powerful approach to identifying robust trendlines based on various parameters and technical analysis metrics.
When using the "Strongest Trendline" indicator, it is recommended to utilize a logarithmic scale . This scale accurately represents percentage changes in price, allowing for a more comprehensive visualization of trends. Logarithmic scales highlight the proportional relationship between prices, ensuring that both large and small price movements are given due consideration.
One of the notable advantages of logarithmic scales is their ability to balance price movements on a chart. This prevents larger price changes from dominating the visual representation, providing a more balanced perspective on the overall trend. Logarithmic scales are particularly useful when analyzing assets with significant price fluctuations.
In some cases, traders may need to scroll back on the chart to view the trendlines generated by the "Strongest Trendline" indicator. By scrolling back, traders ensure they have a sufficient historical context to accurately assess the strength and reliability of the trendline. This comprehensive analysis allows for the identification of trendline patterns and correlations between historical price movements and current market conditions.
The "Strongest Trendline" indicator calculates trendlines based on historical data, requiring an adequate number of data points to identify the strongest trend. By scrolling back and considering historical patterns, traders can make more informed trading decisions and identify potential entry or exit points.
When using the "Strongest Trendline" indicator, a higher Pearson's R value signifies a stronger trendline. The closer the Pearson's R value is to 1, the more reliable and robust the trendline is considered to be.
In conclusion, the "Strongest Trendline" indicator offers traders a robust method for identifying trendlines with significant predictive power. By utilizing a logarithmic scale and considering historical data, traders can unleash the full potential of this indicator and gain valuable insights into price trends. Trendlines, when used in conjunction with other technical analysis tools, can help traders make more informed decisions in the dynamic world of financial markets.

TrueLevel BandsTrueLevel Bands is a powerful trading indicator that employs linear regression and standard deviation to create dynamic, envelope-style bands around the price action of a financial instrument. These bands are designed to help traders identify potential support and resistance levels, trend direction, and volatility.
The TrueLevel Bands indicator consists of multiple envelope bands, each constructed using different timeframes or lengths, and a multiple (mult) factor. The multiple factor determines the width of the bands by adjusting the number of standard deviations from the linear regression line.
Key Features of TrueLevel Bands
1. Multi-Timeframe Analysis: Unlike traditional moving average-based indicators, TrueLevel Bands allow traders to incorporate multiple timeframes into their analysis. This helps traders capture both short-term and long-term market dynamics, offering a more comprehensive understanding of price behavior.
2. Customization: The TrueLevel Bands indicator offers a high level of customization, allowing traders to adjust the lengths and multiple factors to suit their trading style and preferences. This flexibility enables traders to fine-tune the indicator to work optimally with various instruments and market conditions.
3. Adaptive Volatility: By incorporating standard deviation, TrueLevel Bands can automatically adjust to changing market volatility. This feature enables the bands to expand during periods of high volatility and contract during periods of low volatility, providing traders with a more accurate representation of market dynamics.
4. Dynamic Support and Resistance Levels: TrueLevel Bands can help traders identify dynamic support and resistance levels, as the bands adjust in real-time according to price action. This can be particularly useful for traders looking to enter or exit positions based on support and resistance levels.
5. The "Global Trend Line" refers to the average of the bands used to indicate the overall trend.
Why TrueLevel Bands are Different from Classic Moving Averages
TrueLevel Bands differ from conventional moving averages in several ways:
1. Linear Regression: While moving averages are based on simple arithmetic means, TrueLevel Bands use linear regression to determine the centerline. This offers a more accurate representation of the trend and helps traders better assess potential entry and exit points.
2. Envelope Style Bands: Unlike moving averages, which are single lines, TrueLevel Bands form envelope-style bands around the price action. This provides traders with a visual representation of potential support and resistance levels, trend direction, and volatility.
3. Multi-Timeframe Analysis: Classic moving averages typically focus on a single timeframe. In contrast, TrueLevel Bands incorporate multiple timeframes, enabling traders to capture a broader understanding of market dynamics.
4. Adaptive Volatility: Traditional moving averages do not account for changing market volatility, whereas TrueLevel Bands automatically adjust to volatility shifts through the use of standard deviation.
The TrueLevel Bands indicator is a powerful, versatile tool that offers traders a unique approach to technical analysis. With its ability to adapt to changing market conditions, provide multi-timeframe analysis, and dynamic support and resistance levels, TrueLevel Bands can serve as an invaluable asset to both novice and experienced traders looking to gain an edge in the markets.

Matrix Momentum Expansion [IkkeOmar]The indicator consists of several features:
Candlestick chart: The indicator plots a candlestick chart based on the input parameters of the user. The candlesticks are colored blue or orange depending on whether the closing price is above or below the upper and lower bands.
Support and Resistance levels: The indicator also plots support and resistance levels based on the CCI (Commodity Channel Index) of the asset's price. These levels are dynamic and change based on the user's input parameters.
Momentum: The indicator calculates the momentum of the market based on the smoothed and standard deviation of the asset's price. It uses this momentum to calculate upper and lower bands that are plotted on the chart.
Warning signals: The indicator can also be used to identify potential warning signals. When the closing price of the asset moves above the upper band, it could indicate that the market is overbought and a potential reversal could occur. Conversely, when the closing price moves below the lower band, it could indicate that the market is oversold and a potential reversal could occur.
Contractions and expansions in the bands can provide important information to traders about potential price movements.
When the bands contract, it indicates that the market is experiencing low volatility and the price is likely to move sideways. During these periods, traders may look for other signals, such as support and resistance levels or price patterns, to determine potential entry and exit points.
On the other hand, when the bands expand, it indicates that the market is experiencing high volatility and the price is likely to move in a particular direction. Traders can use this information to identify potential trend reversals or continuation patterns. When the upper and lower bands move further apart, it indicates that the trend is becoming stronger, while when they move closer together, it indicates that the trend may be weakening.
When the price moves outside of the bands, it can also provide important information to traders. If the price moves above the upper band, it could indicate that the market is overbought and a potential reversal could occur. Conversely, if the price moves below the lower band, it could indicate that the market is oversold and a potential reversal could occur.
Very important note!
When you see contractions, please understand that it's a wonderful opportunity to pivot into position to catch a good trade because we will see an expansion after!
