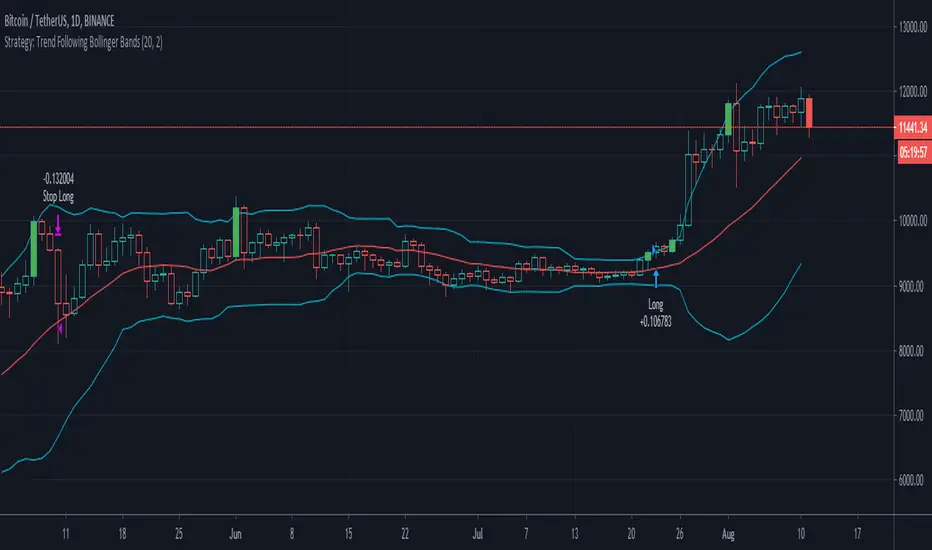
Setup Trend Following Bollinger Bands - ValenteBuy when the candle closes above upper BB
Sell when the candle closes bellow lower BB
Stop always on base line
Bands
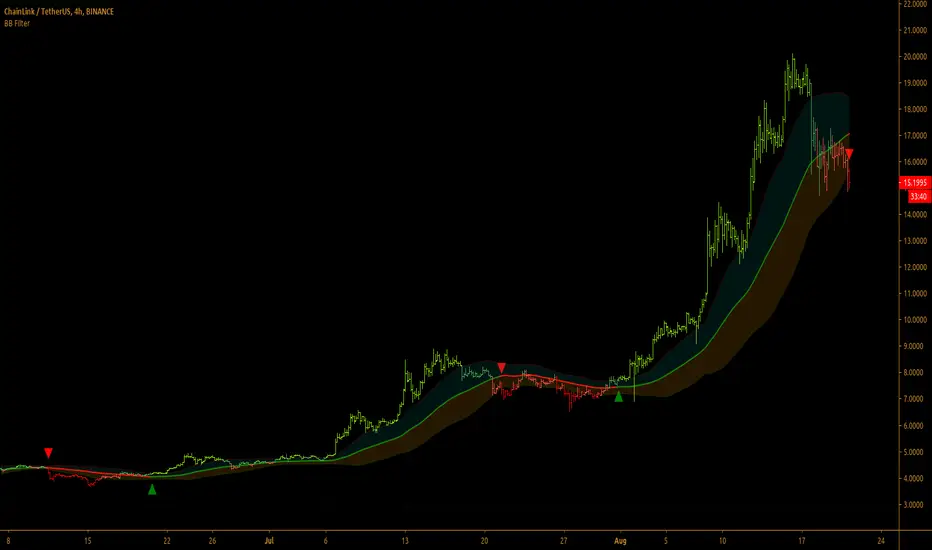
Bollinger Bands Filter
Bollinger Bands is a classic indicator that uses a simple moving average of 20 periods, along with plots of upper and lower bands that are 2 standard deviations away from the basis line. These bands help visualize price volatility and trend based on where the price is, in relation to the bands.
Bollinger Bands filter plots a long signal when price closes above the upper band and plots a short signal when price closes below the lower band. It doesn't take into account any other parameters such as Volume/RSI/ Fundamentals etc, so user must use discretion based on confirmations from another indicator or based on fundamentals.
The filter works great when the price closes above/below upper/lower bands with continuation on next bar. It is definitely useful to have this filter along with other indicators to get early glimpse of breach/fail of bands on candle close during BB squeeze or based on volatility.
This can be used on Heikin Ashi candles for spotting trends, but HA candles are not recommended for trade entries as they don't reflect true price of the asset.
This filter's default is 55 SMA and 1 standard deviation, but these can be changed from settings.
It is definitely worth reading the 22 rules of Bollinger Bands written by John Bollinger.
==================================================================
Note:
1. Alerts can be created for long and short signals using "Once per bar close".
2. The indicator doesn't repaint.
==================================================================
MedianBandsHere I propose another simple S/R band technique, works on all TF and all securities, this is again one of the simplest forms of logic with a little tweak to tackle modern volatile markets.
It enables us to trade both mean reversion as well as breakout trades as it works in both trending and non-trending markets. You can even use pre-existing ranges as good position management markers.
It requires little to no intervention from the user. The white line is the opening price of the day, I'm a big believer of that so you will find it everywhere in my indicators. :3
Past performance is not assurance of the future performance and this is for educational purposes only.
The script will be protected to avoid theft but you can add to your favorites to use it as you please.
Enjoy~

Alpha BandsAlpha Bands, this is a new idea I've been playing with recently in all my indicators.
In layman terms we are here using mult to multiply length of the plot to replicate effect of multi time frame plot. Under the hood it is basically fast ma crossing over slow one but with this simple multiplier introduction is able to give it properties of higher TF ma's but without the usual problem of the TV where multitimeframe MA plots rather crudely if you use security function.
Introducing it as core trend indicator, and around it I've utilized ATR to create simple but complete indicator to give good view of the market state and trend. Due to this setup it can be used for both trending and mean reversion trades, you can also utilize existing ranges for entry, exit and SL.
This indicator is example of how simple little tweaks can turn a age old tools into more advanced solutions.
This is purely for educational purposes, any past or claimed results may not replicate themselves while you trade them so use your own discretion. Author takes no responsibility of individual traders success or loss on this.
Source code will be protected since there is trend on TV where ideas are stolen and sold to unsuspecting retailers.

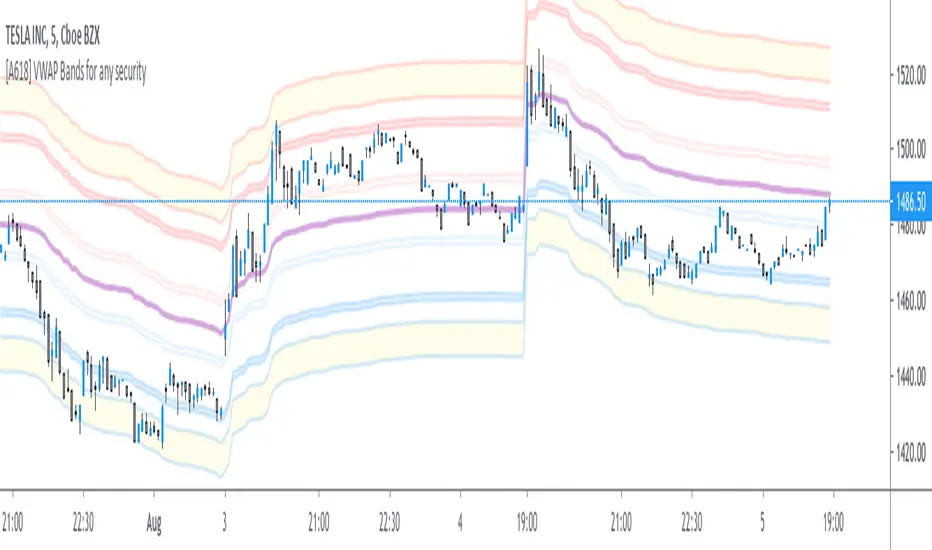
[A618] VWAP bands for any SecurityThe Script plots Standard Deviation Bands around The VWAP line,
This will help you out with detecting market overbought and oversold Conditions on the Fly
Use this in conjunction with an oscillator
- stoch, macd, etc...
- if you find a positive crossover with oscillator on a VWAP level its time to go long, targeting the next vwap level and vice-versa
CDub's BolBands SetupUses a set of Bollinger Bands (user defined deviation, user defined deviation * 2) to determine possible entry set ups.
Signals are triggered when price crosses the first band (closest to the baseline MA) in the desired direction.
baseline can be your take profit 1 target
The inside band determines entry and can be used as a take profit 2 target (Opposite side of baseline)
The outside band is a suggested stop loss target (Same side of baseline) and can be used as a take profit 3 target (Opposite side of baseline)
Suggestions are welcome!
-CDub

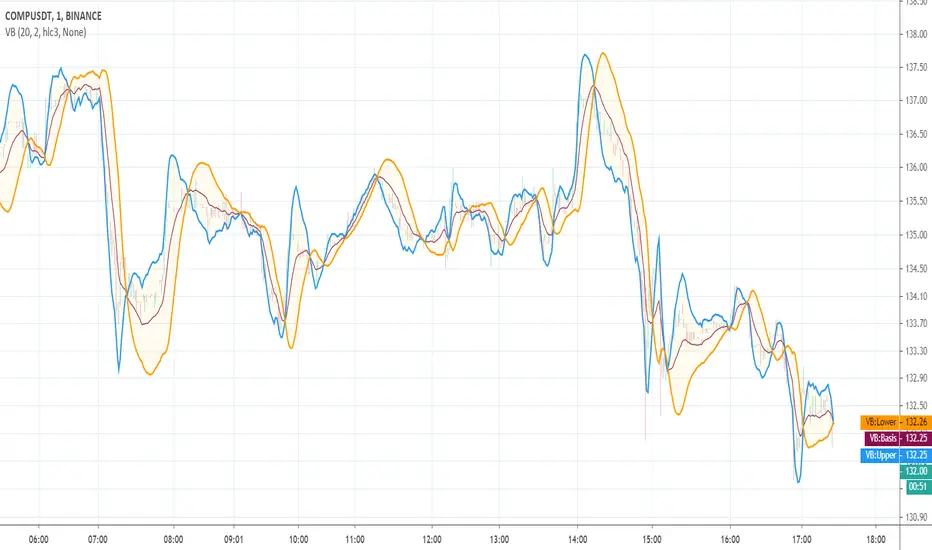
Vortex BandsA slighty modified version of Better Bollinger Bands. The idea of the experiment was to do a thing like the well-known Vortex Indicator, but an overlay:
Obvious trading rules are:
go Long when the blue line is above other two
go Short when the orange line is above other two
stop when price crosses the basis line
The tool is EXPERIMENTAL . Good luck!
CDub's BolBandsUses a set of Bollinger Bands (user defined deviation, user defined deviation * 2) to determine possible entry set ups.
Signals are triggered when price crosses and closes, and crosses the first band (closest to the baseline MA) in the desired direction.
baseline can be your take profit 1 target
The inside band determines entry and can be used as a take profit 2 target (Opposite side of baseline)
The outside band is a suggested stop loss target (Same side of baseline) and can be used as a take profit 3 target (Opposite side of baseline)
Suggestions are welcome!
-CDub

Trends & RangesTrends & Ranges uses EMA ATR bands as a SuperTrend indicator.
How to use:
This indicator can be used to give you a direction bias, with the added function to create ranges which often lead to reversals or flat trading periods. Trade the break-out or wait for pull backs in the direction of the trend.
I'm not great at explaining stuff and will probably make things only more complicated, so I won't bother for now,
but if you have a question on how the script works I will gladly give it a try.
The option "Flexible Trends" will disable the min/max function (trailing or non trailing).
Flexible Trends enabled:
Flexible Trends disabled:
Settings are not optimized for any asset or time frame, you will have to do that for yourself. Feel free to share them in the comments.
Thanks for showing interest, enjoy and good luck! :)

VAMA Volume Adjusted Moving Average BandsThis indicator is standard deviation bands using a live analysis adaptation of Richard Arms' Volume Adjusted Moving Average as their basis. VAMA utilizes a period length that is based on volume increments rather than time.
• SampleN - N volume bars used as sample to calculate average volume , 0 equals all bars.
• VAMA Source - Price used for volume weighted calculations.
• VAMA Length - Specified number of volume ratio buckets to be reached.
• VAMA VI Fct - Size of volume ratio buckets.
• VAMA Strict - Must meet desired volume requirements, even if number of bars has to exceed VAMA Length to do it.
• STDV Factor - Standard Deviation multiplier.
• STDV Length - Standard Deviation period.
• Brightness - Color opaqueness for the band fills.
Please see previous published example here for more details on VAMA's usage and inability to redraw the past on time based charts.
NOTICE: This is an example script and not meant to be used as an actual strategy. By using this script or any portion thereof, you acknowledge that you have read and understood that this is for research purposes only and I am not responsible for any financial losses you may incur by using this script!

Rolling Linear Regression ChannelCompute a rolling linear regression channel, the value of the bands at a precise point in time is equal to the last value of the corresponding extremity of a regression channel of equal length and mult at that point. The bands are made by adding/subtracting the RMSE of a linear regression to a least-squares moving average.
Settings
Length : Period of the indicator
Mult : Multiplication factor for the RMSE, determine the distance between the upper and lower extremities
Src : Input data for the indicator
Gradient : Determine if the area within the bands must be filled with a gradient, a color closer to blue indicates that src is close/superior to the upper band while a color closer to red indicates that src is close/inferior to the lower band. True by default, if false no filling is applied.
Usage
The indicator can be used like any other band indicator. Because the indicator makes use of the LSMA we can expect the bands to be more reactive to price changes, the indicator can also be more accurate when the bands must act as support and resistance as long as the underlying trend in the price is linear.
In blue/red the indicator, with the Bollinger bands in dark green with the same length/mult settings.
Since the indicator is derived from the linear regression channel indicator it can also be used to look at how drastically the regression channels changed over time, that is if the bands look linear, then it implies that the channel didn't change a lot with the arrival of new closing prices.
Details
As said the last value of each band is equal to the last value of the corresponding extremity of a linear regression channel.
In blue/red the indicator, with the linear regression channel in orange with the same length/mult settings, the last circle of the upper band is equal to the last value of the upper regression channel, same thing with the lower band, you can see this more clearly using the replay mode.
Notes
Thx to the twitter fans for their feedback and support, note that I often ask about feedback or about what kind of indicators I should do next on Twitter.

Magic BandThis indicator can help you to understand the current trend and help you to take an entry, If your analysis looks good to go for long entry, check that where is your candle based on this indicator,If the candle is above the indicator it is goo to go for long and if it is bellow the indicator it is good to go for short.
More than that the candle is closing strong above the indicator after crossing the indicator , then it is a good sign to take a long position. Similarly if the candle close strongly bellow the indicator after crossing the indicator then it is good to go for short position.
Use the indicator with other indicators or your analysis.
Please contact me for more details.

Trend Risk Indicator (TRI)The Trend Risk Indicator is a simple bands indicator made of 2 custom averages of candlesticks ranges calculated within the variable “ BandBars ” period.
Upper and lower channel bands width can be adjusted with the “ Deviation ” variable, which act as a simple factor to enlarge the spread between them.
When Close crosses over the upper band, it is a bearish signal and candlesticks are painted in Red.
When Close crosses under the lower band, it’s a bullish signal and candlesticks are painted in Green.
One of the most interesting indicators for 1 minute scalping. Recommended to use on Renko bars.
*drag to chart and pin to scale, also remove borders from candlesticks.


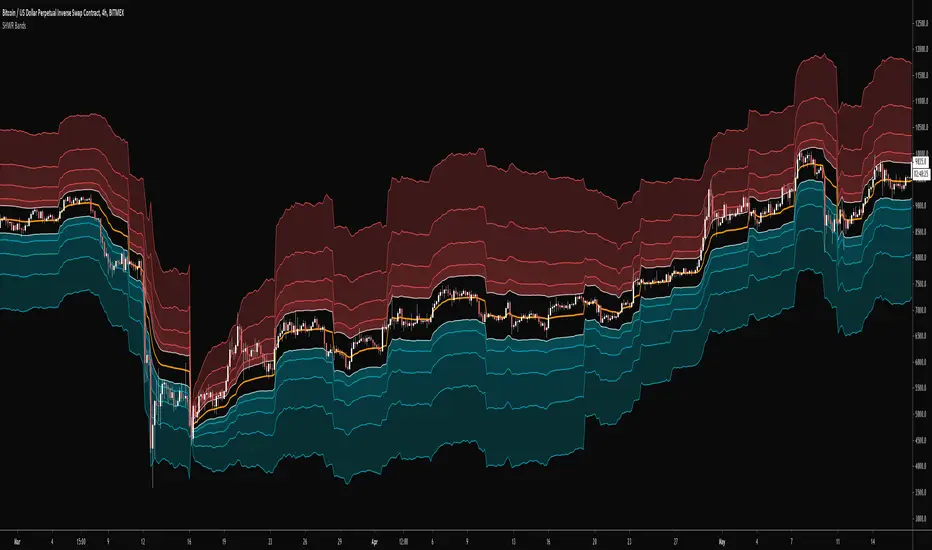
SHWR Bands"SHWR Bands" are designed for multiple types of traders such as scalpers, knife catching degenerates, swing traders, etc.
The midline is based off of an Event Anchored VWAP ("eVWAP"?) instead of a periodic or period based one because that just doesn't make sense to me for a 24/7 market.
The bands aren't regular stdevs, they're devs based off of something else besides the "eVWAP" and are mathed against another math.
A lot of different ways to play this indicator such as ping ponging between the first two bands and the midline, knife catching trend reversals with the outer bands, confluence for swing traders if price is at a resistant/support and is within one of the middle bands, etc
Useful for all timeframes in different ways.
I've butchered all those explanations but I hope you enjoy and use it anyways.
Periodic EllipsesThe following script periodically plot ellipses to the chart, where the maximum height of the ellipses is determined by the price high of the user-selected time frame while the price low determines the minimum height of the ellipses.
The selected time frame affects the frequency at which the ellipses are plotted, for example, a selected time frame of 1 week will plot an ellipse every week
Note that time frames that are close to the one used in the main chart can return noncircular shapes
Here the main time frame is 15 minutes, while the time frame in the script is 1 hour.
By default the script uses future data, and as such repaint which makes it only useful in offline (non-real time) situations, you can make the script use only past data by deselecting the "repaint" option.
Interpretation And Construction
In terms of usages and interpretation ellipses are similar to bands indicators, as such we can use ellipses in a breakout methodology, where a closing price crossing over the upper bound indicating an uptrend and a closing price crossing under the lower bound indicating a downtrend.
By default, the color of the plots are based on a gradient determined by the position of the closing price relative to the ellipse, with a closing price closer to the upper bound of the ellipse returning a blue color and a closing price closer to the lower bound returning a red color, the intermediate color is violet. When repainting mode is deactivated a blue color indicates an up-trend, while a red color indicates a down-trend, violet colors on the other hand indicate a ranging market.
The ellipses can also determine possible retracements, as such the upper bound of the ellipse can act as a support in an uptrend while the lower bound can act as a resistance in a downtrend.
Construction
Peoples might be interested in the construction of ellipses, this task is not complicated. We can construct circular shapes by using the equation of a semi-circle described as follows:
C = √(1 - x*x)
with 1 ≥ x ≥ -1 , values of x greater than 1 or lower than -1 will return na . In the script, the variable basis creates a line starting at -1 and ending at 1, we then only need to apply the previous equation to this line to have a semi-circle. This semi-circle is in a range of (0,1), so we need to rescale it in a useful range, let's define the highest high of the selected time frame as H and the lowest low as L , the upper and lower bound of the ellipse are calculated as follows:
upper = avg(H,L) + C*(H - avg(H,L))
lower = avg(H,L) - C*(avg(H,L) - L)
Summary
A script plotting ellipses has been proposed, we have seen that the signals that can be generated are similar to the one generated by band indicators, note however that the script has not been made to be a serious indicator, it would be more advisable to use regular band indicators instead.
Thx to @freds_view for the question.

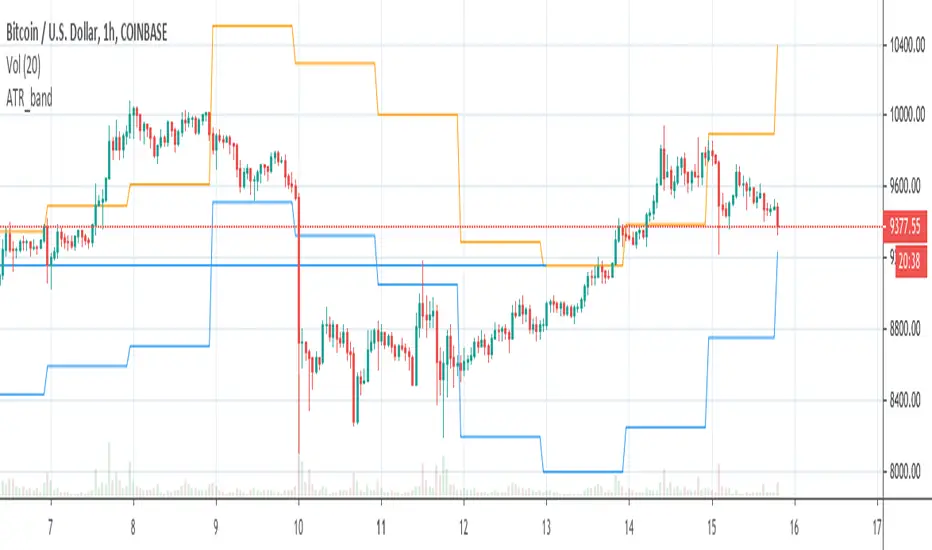
ATR_bandCreates lower and upper band on BTCUSD chart based on ATR value of the previous day and daily open of the current day
High-Low BandsThis is a simple but powerful indicator. It calculates (selectable) moving averages separately from high , low and close .
It can be used as support-resistance, trend or volatility indicator.


Mean Reversion w/ Bollinger BandsThis is a more advanced version of my original mean reversion script.
It employs the famous Bollinger Bands.
This robot will buy when price falls below the lower Bollinger Band, and sell when price moves above the upper Bollinger Band.
I've only tested it on the S&P 500, though you could try it out on other assets to see the backtest performance.
During the recent COVID-19 bear market drop, it produced several buy signals on the S&P which I followed, and made some nice gains so far.
I still think this would make a better investing strategy (buy undervalued / sell over-valued), rather than a trading strategy.
I use this robot for my long term portfolio.

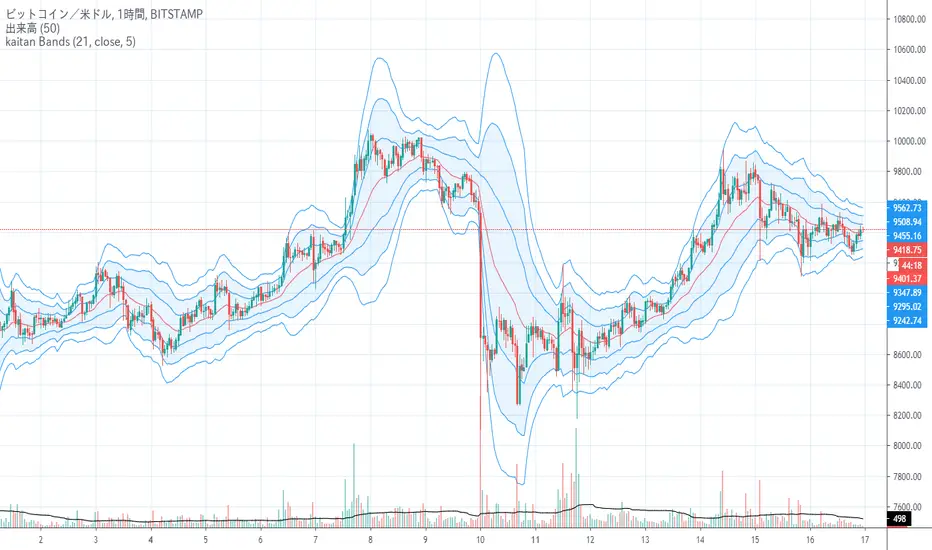
kaitan Bands
Reference: 200 section kaitan Bands
参考:200区間のkaitan Bands
Changing the Bollinger Band's midline from SMA to EMA is not so good in terms of the standard deviation calculation formula, and it was hard to say that EMABB is an index that can be used by the author in different calculation formulas.
This time, when I came up with the deviation, I came up with a method of weighting the latest deviation like EMA instead of the average and neglecting past deviations, so I made it.
The variation in the calculation result seems to be difficult to handle, so the finished product is the one with smoothed EMA deviation.
ボリンジャーバンドの中線をSMAからEMA変更にするのは標準偏差の計算式上いまいちで、EMABBは作者によって計算式もばらばらで使える指標とは言い難かった。
今回、偏差から求めるときに平均ではなくてEMAのように最新の偏差を重くし過去の偏差を軽視する方法を考え付きましたので、作ってみました。
単純に計算結果のばらつきが大きく扱いづらそうなので、EMA偏差をスムージングしたものを完成品としました。
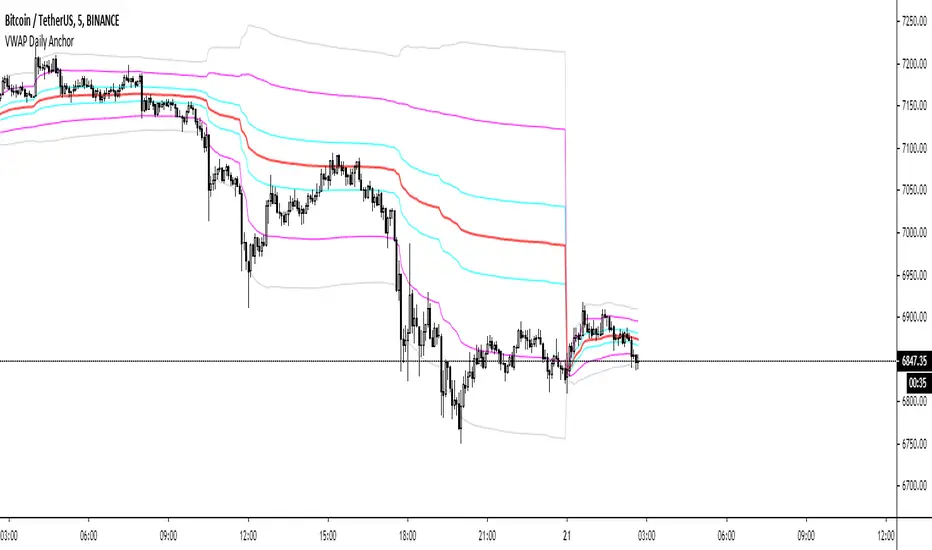
VWAP Daily AnchorAnchored daily VWAP with adjustable standard deviation bands - intended for intraday scalping.
Anchored VWAP is useful because not matter what timeframe you look at it on, it will look the same, unlike normal VWAP indicators. This means there's nothing left to interpretation.
BTC Mayer Multiple BandsIntroduced by Trace Mayer as a way to gauge the current price of Bitcoin against its long range historical price movements (200 day moving average), the Mayer Multiple highlights when Bitcoin is overbought or oversold in the context of longer time frames.
It's worth noting that as the market becomes larger and less volatile, the peaks are becoming less exaggerated. This is because a 200 day moving average baseline is a static yardstick against an ever growing, more stable, Bitcoin market. We should recalibrate what constitutes the overbought/oversold extremes on this chart accordingly.
Idea by CryptoKea. Original author:
