VolumeFlowOscillatorLibVolume Flow Oscillator Library
Overview
The Volume Flow Oscillator library provides a comprehensive framework for analyzing directional volume flow in financial markets. It creates a multi-band oscillator system that transforms price and volume data into a spectrum of sensitivity bands, revealing the underlying buying and selling pressure.
Technical Approach
The library combines price direction with trading volume to generate an oscillator that fluctuates around a zero line, with positive values indicating buying pressure and negative values showing selling pressure. Using sophisticated ALMA (Arnaud Legoux Moving Average) smoothing techniques with asymmetric sensitivity, the library creates seven distinct bands that help identify various intensity levels of volume flow.
Key Features
Multi-band oscillator system with seven sensitivity levels
Directional volume flow analysis combining price movement and volume
Zero-line oscillation showing the balance between buying and selling pressure
Asymmetric ALMA smoothing for different sensitivity on positive/negative bands
Customizable lookback periods and multipliers for fine-tuning
Color-coded visualization for intuitive chart reading
Applications
This library offers developers a versatile foundation for creating volume-based indicators that go beyond simple volume measurement to reveal the directional force behind market movements. Ideal for confirming price trends, detecting divergences, identifying volume climaxes, and assessing overall market strength.
Bands

PolyBand Convergence System (PBCS)PolyBand Convergence System (PBCS)
The PolyBand Convergence System (PBCS) is an advanced technical analysis indicator that combines multiple polynomial regressions with statistical bands to identify trend strength and potential reversal zones.
Key Features
Multi-Degree Polynomial Analysis: Combines 1st, 2nd, 3rd, and 4th degree polynomial regressions into a composite regression line
Adaptive Statistical Bands: Uses percentile-based bands enhanced with standard deviation multipliers
Asymmetric Volatility Measurement: Separately calculates upside and downside volatility for more accurate band placement
Smart Trend Detection: Identifies bullish, bearish, or neutral market conditions based on price position relative to bands
How It Works
PBCS creates a composite regression line from multiple polynomial fits to better capture the underlying price structure. This line is then surrounded by adaptive bands that represent statistical thresholds for price movement. When price breaks above the upper band, a bullish trend is signaled; when it breaks below the lower band, a bearish trend is indicated.
Customization Options
Regression Settings: Adjust source data, lookback period, and smoothing parameters
Percentile Controls: Fine-tune the statistical thresholds for upper and lower bands
Volatility Sensitivity: Modify standard deviation multipliers to control band width
Visual Preferences: Choose from multiple color schemes to match your trading platform
Disclaimer
This indicator is provided for educational and informational purposes only and does not constitute investment advice. Trading involves risk and may result in financial loss. Always perform your own research and consult with a qualified financial advisor before making any trading decisions.

Kernel Regression Bands SuiteMulti-Kernel Regression Bands
A versatile indicator that applies kernel regression smoothing to price data, then dynamically calculates upper and lower bands using a wide variety of deviation methods. This tool is designed to help traders identify trend direction, volatility, and potential reversal zones with customizable visual styles.
Key Features
Multiple Kernel Types: Choose from 17+ kernel regression styles (Gaussian, Laplace, Epanechnikov, etc.) for smoothing.
Flexible Band Calculation: Select from 12+ deviation types including Standard Deviation, Mean/Median Absolute Deviation, Exponential, True Range, Hull, Parabolic SAR, Quantile, and more.
Adaptive Bands: Bands are calculated around the kernel regression line, with a user-defined multiplier.
Signal Logic: Trend state is determined by crossovers/crossunders of price and bands, coloring the regression line and band fills accordingly.
Custom Color Modes: Six unique color palettes for visual clarity and personal preference.
Highly Customizable Inputs: Adjust kernel type, lookback, deviation method, band source, and more.
How to Use
Trend Identification: The regression line changes color based on the detected trend (up/down)
Volatility Zones: Bands expand/contract with volatility, helping spot breakouts or mean-reversion opportunities.
Visual Styling: Use color modes to match your chart theme or highlight specific market states.
Credits:
Kernel regression logic adapted from:
ChartPrime | Multi-Kernel-Regression-ChartPrime (Link in the script)
Disclaimer
This script is for educational and informational purposes only. Not financial advice. Use at your own risk.

Mean Reversion Bundle [ActiveQuants]The Mean Reversion Bundle indicator is a powerful and versatile toolkit designed for traders who specialize in mean reversion strategies . This comprehensive bundle integrates eight key technical indicators renowned for their ability to identify potential price reversals, overbought/oversold conditions, and market exhaustion points. By consolidating Moving Averages (Fast & Slow) , Bollinger Bands , RSI (with Divergence) , Stochastic , Keltner Channels , Standard Pivot Points , ATR , and the Choppiness Index into a single, efficient script, it significantly streamlines chart analysis and empowers robust strategy development.
This bundle operates on the core principle of mean reversion: prices tend to revert to their historical average or mean over time . The included indicators provide multiple perspectives to assess these potential turning points:
Dynamic Support/Resistance: Moving Averages, Bollinger Bands, Keltner Channels, Pivot Points.
Momentum Oscillators: RSI, Stochastic.
Overbought/Oversold Conditions: RSI, Stochastic, Bollinger Bands.
Volatility Assessment: ATR, Bollinger Bands, Keltner Channels.
Market Condition Filter: Choppiness Index (Range vs. Trend).
Reversal Signals: RSI Divergence, Bollinger Band recovery.
By enabling users to selectively activate, extensively customize, and visualize these tools ( often with multi-timeframe capabilities ), the Mean Reversion Bundle facilitates a nuanced and layered approach to identifying high-probability mean reversion setups.
█ KEY FEATURES
All-in-One Mean Reversion Suite: Access eight distinct mean reversion indicators within a single TradingView script slot, saving valuable indicator space.
Modular Design: Easily toggle each indicator (Fast MA, Slow MA, Bollinger Bands, RSI, Stochastic, Keltner Channels, Pivot Points, ATR, Choppiness Index) On or Off through the intuitive settings menu to tailor your analysis.
Deep Customization: Fine-tune a wide array of parameters for every indicator, including lengths, sources, MA types, colors, line styles, levels, and specific calculation methods to precisely match your trading strategy and the asset's characteristics.
Multi-Timeframe (MTF) Capability: Configure most indicator components to analyze data from a different timeframe than your main chart, providing crucial higher-level context for mean reversion signals (e.g., daily RSI on an hourly chart).
Integrated Alert System: Pre-built alert conditions for critical mean reversion events such as:
- Price Crossover/Crossunder (Fast MA)
- Price Crossover/Crossunder (Slow MA)
- Lower Bollinger Band Recovery
- Upper Bollinger Band Recovery
- Bullish RSI Divergence
- Bearish RSI Divergence
Set up these alerts directly through TradingView's alert creation dialog. (See section on "█ SETTING UP ALERTS " for more details).
Advanced MA & RSI Smoothing: Option to apply a secondary smoothing MA or even Bollinger Bands directly to the Fast MA, Slow MA, and RSI lines for refined signal generation.
Sophisticated Pivot Points Module: Includes multiple Pivot Point types (Traditional, Fibonacci, Woodie, Classic, DM, Camarilla) with flexible timeframes (Daily to Decennially) and dynamic drawing of historical levels.
RSI Divergence Detection: Automatically plots potential bullish and bearish divergences between price and the RSI, a classic reversal signal.
█ USER INPUTS
The settings panel is organized into distinct sections for each of the 8 core indicator components:
Fast MA & Slow MA: On/Off, MA Type, Source, Length, Color, Line Width, Smoothing Type (None, MA, or MA + BBs), Smoothing Length, BB StdDev (if smoothing with BBs), Timeframe, Wait TF Close.
Bollinger Bands: On/Off, Length, Basis MA Type, Source, StdDev Multiplier, Offset, Colors, Timeframe, Wait TF Close.
RSI: On/Off, Source, Length, Overbought/Middle/Oversold Levels, Color, Line Width, Smoothing Type (None, MA, or MA + BBs), Smoothing Length, BB StdDev (if smoothing with BBs), Plot Divergence, Divergence Lookback Left/Right, Timeframe, Wait TF Close.
Stochastic: On/Off, %K Length, %K Smoothing, %D Smoothing, Overbought/Middle/Oversold Levels, Colors, Timeframe, Wait TF Close.
Keltner Channels: On/Off, Length, Multiplier, Source, Use Exponential MA (for basis), Bands Style (ATR, TR, Range), ATR Length, Colors, Timeframe, Wait TF Close.
Pivot Points: On/Off, Type, Pivots Timeframe (Anchor), Number of Pivots Back, Use Daily-based Values, Show Labels, Show Prices, Labels Position, Line Width, Line Style, and individual color/visibility toggles for P, S1-S5, R1-R5.
ATR: On/Off, Length, Smoothing Type, Color, Timeframe, Wait TF Close.
Choppiness Index: On/Off, Length, Offset, Upper/Middle/Lower Band Levels, Color, Timeframe, Wait TF Close.
█ SETTING UP ALERTS
The Mean Reversion Bundle comes with several pre-configured alert conditions to notify you of potential trading opportunities. To set up an alert:
Click the " Alert " button (clock icon) on TradingView's right-hand toolbar or top panel.
In the " Condition " dropdown, select " Mean Reversion Bundle ".
A second dropdown will appear, allowing you to choose from the specific alert conditions built into the script (e.g., " Price Crossover (Fast MA) ", " Bullish RSI Divergence ", " Lower Bollinger Band Recovery ").
You can also create more complex alerts by selecting one of the indicator's plotted lines (e.g., " RSI ", " Stochastic %K ", " Bollinger Band Basis ") in the first condition box, then choosing a comparison (e.g., " Crossing Down ", " Greater Than "), and then selecting another value or plotted line from the indicator in the third box.
Choose your preferred " Trigger " option:
- " Only Once ": The alert triggers the first time the condition is met, even on an unclosed (intra-bar) candle. The alert then deactivates.
- " Once Per Bar Close ": (Recommended for most mean reversion signals) The alert triggers only after the current bar closes if the condition was true on that closed bar. This ensures signals are based on confirmed price action and allows the alert to re-trigger on subsequent bars if the condition remains true.
- Other options like " Once Per Bar " or " Once Per Minute " are also available for different needs.
Customize the alert name, message, and notification preferences.
Click " Create ".
█ STRATEGY EXAMPLES
The following examples are for illustrative purposes only to demonstrate how indicators in this bundle can be combined for mean reversion strategies. They are not financial advice. Always conduct thorough backtesting and research.
1. Bollinger Band Reversal with RSI Confirmation
Goal: Identify potential reversals when price touches an outer Bollinger Band and RSI shows overbought/oversold conditions.
Setup: Enable Bollinger Bands (e.g., 20,2), RSI (e.g., 14), and optionally the Choppiness Index.
Entry (Long):
- Price touches or briefly closes below the Lower Bollinger Band.
- RSI is in the oversold region (e.g., below 30) or shows bullish divergence.
- Optional Filter: Choppiness Index > 61.8 (indicating a ranging market favorable for BB mean reversion).
- Enter on a confirming candle (e.g., price closes back inside the Lower Band, or a bullish candle pattern forms).
Entry (Short): Reverse logic for Upper Bollinger Band and overbought RSI (e.g., above 70) or bearish divergence.
Management: Stop-loss beyond the recent swing low/high or a multiple of ATR. Target the Bollinger Band basis line or the opposite band.
2. Stochastic Oversold/Overbought with Pivot Point Support/Resistance
Goal: Trade bounces from key Pivot Point levels when confirmed by Stochastic extremes.
Setup: Enable Stochastic (e.g., 14,3,3), Pivot Points (e.g., Daily Traditional), and Fast MA (e.g., 9 EMA) for short-term trend context.
Entry (Long):
- Price approaches a significant Pivot Support level (S1, S2).
- Stochastic %K and %D lines are in the oversold region (e.g., below 20) and ideally show a bullish crossover (%K crosses above %D).
- Optional Filter: Price is above the Fast MA, or the Fast MA starts to slope up.
- Enter on signs of price rejection at the Pivot level.
Entry (Short): Reverse logic for Pivot Resistance levels (R1, R2) and overbought Stochastic (e.g., above 80) with a bearish crossover.
Management: Stop-loss below the Pivot Support (for longs) or above Pivot Resistance (for shorts). Target the next Pivot level or a fixed risk-reward ratio.
3. RSI Divergence at Keltner Channel Extremes
Goal: Capitalize on weakening momentum (divergence) as price tests the outer Keltner Channel bands.
Setup: Enable RSI (with Divergence plotting enabled), Keltner Channels (e.g., 20,2 EMA basis, ATR 10), and ATR (for stop placement).
Entry (Long):
- Price is testing or near the Lower Keltner Channel band.
- A Bullish RSI Divergence is plotted (price makes a lower low, but RSI makes a higher low).
- Enter once the divergence is confirmed and price shows signs of turning up.
Entry (Short):
- Price is testing or near the Upper Keltner Channel band.
- A Bearish RSI Divergence is plotted (price makes a higher high, but RSI makes a lower high).
- Enter once divergence is confirmed and price shows signs of turning down.
Management: Place stop-loss based on ATR (e.g., 1.5x ATR below entry for longs) or beyond the Keltner Channel. Target could be the Keltner basis line or a measured move.
█ CONCLUSION
The Mean Reversion Bundle offers a sophisticated yet user-friendly suite of tools essential for traders focusing on mean reversion. By consolidating these powerful indicators, providing extensive customization , multi-timeframe analysis , and integrated alerts , this bundle simplifies the analytical workflow and aids in the development of more robust and nuanced trading strategies. Whether identifying potential exhaustion points, confirming overbought/oversold conditions, or finding precise entry near dynamic support/resistance, this bundle is a versatile asset for your technical analysis toolkit.
█ IMPORTANT NOTES
⚠ Parameter Optimization: The default settings are starting points. Always adjust indicator parameters (lengths, multipliers, levels) based on the specific asset, its volatility, and the timeframe you are trading. Thorough backtesting is crucial.
⚠ Multi-Timeframe Dynamics: Using the " Timeframe " input can be very powerful. If " Wait TF Close " is enabled (default), signals from higher timeframes will only update upon the close of that higher timeframe bar. Disabling it may lead to signals changing intra-bar.
⚠ Confluence is Key: Avoid relying on a single indicator. The strength of this bundle lies in combining signals from multiple indicators to build a confluence case for a trade.
⚠ Chart Clarity: While many tools are available, only enable those pertinent to your current strategy to maintain a clear and actionable chart.
⚠ Signal Confirmation: Indicator signals are typically finalized on bar close. Be cautious when acting on intra-bar signals, as they can change before the bar is complete. Using " Once Per Bar Close " for alerts is generally recommended for mean reversion signals.
█ RISK DISCLAIMER
Trading involves a substantial risk of loss and is not suitable for all investors. The Mean Reversion Bundle indicator is provided for educational and informational purposes only . It does NOT constitute financial advice or a recommendation to buy or sell any asset. Indicator signals identify potential patterns based on historical data but do not guarantee future price movements or profitability. Always conduct your own thorough research, utilize multiple sources of information, and implement robust risk management practices before making any trading decisions. Past performance is not indicative of future results.
📊 Happy trading! 🚀

Savitzky Flow Bands [ChartPrime]An advanced trend-following tool that applies the Savitzky-Golay smoothing algorithm to price and dynamically adapts trend bands to visualize directional bias and trend strength.
savitzky_golay_filter_w_15_vectors(source) =>
float sum = 0.0
float polynomial = 0.0
float coefficients = array.new(16)
// Predefined 15 coefficients
for i = -4 to 4
coefficients.set(i + 4, i) // from -4 to 5
if i == 4
for j = 5 to -4
for g = 8 to 15
coefficients.set(g, j) // from 5 to -4
// Calculate normalization factor as the sum of absolute values of coefficients
float norm_factor = coefficients.sum()
// Loop through coefficients and calculate the weighted sum
for i = 0 to coefficients.size()-1
sum := sum + coefficients.get(i) * source
// Calculate the smoothed value
for i = 1 to length-1
polynomial := math.sum(sum / norm_factor, i) / i
polynomial
⯁ KEY FEATURES & HOW TO USE
Savitzky-Golay Filtered Line (Basis):
Smooths out price noise using the Savitzky-Golay method, offering a more refined trend path than traditional moving averages. This centerline acts as the trend anchor and visually changes color depending on its slope to reflect the active trend direction.
Dynamic Trend Bands (Upper/Lower):
Constructed from the filtered line with a dynamic offset based on recent price volatility (ATR). These bands shift based on price pressure and are locked once price closes beyond them.
Helpful for identifying breakout moments or exhaustion areas where reversals are likely.
Trend Direction Detection:
A directional signal is confirmed when price breaks and closes above the upper band (uptrend) or below the lower band (downtrend).
Provides a clear and systematic way to identify when a trend begins.
Trend Duration Counter (Visual Decay Line):
A fading overlay line shows how long a trend has been active since the last reversal. The longer the trend persists, the more transparent this extension becomes.
This visual fading effect helps traders anticipate potential trend exhaustion and prepare for reversals or take-profit zones.
Reversal Signals (Diamond Markers):
Diamond shapes are plotted at each market shift, allowing users to visually pinpoint when the trend has flipped.
These markers act as decision zones for entry, exit, or stop-loss adjustments based on directional flow changes.
Color-Based Bar and Candle Painting:
Candles are painted green in uptrends and orange in downtrends, providing an intuitive glance at trend state without needing to interpret numbers.
Helps users stay aligned with the trend visually and avoid counter-trend entries.
⯁ CONCLUSION
The Savitzky Flow Bands indicator offers a modernized, visually rich way to track trend shifts using a scientific smoothing method. With dynamic trend envelopes, color-coded cues, and visual markers, it equips traders with a structured framework to follow the market's flow and make data-driven decisions. Ideal for swing traders, momentum strategists, or any trader looking to trade in sync with the prevailing trend.

Moving Volume-Weighted Avg Price, % Channel, BBsThis script includes:
- Moving Volume-Weighted Average Price line.
- User-defined % band above and below, very useful for "breakout" signals, and mentally adjusting to the magnitude of price swings when viewing an automatic scale on the price axis.
- Volume-Weighted Bollinger Bands, which are more sensitive to volume.
More detail:
- This is like TV's basic VWAP in concept, except the major flaw in that is that it has reset periods that you can't override, and the volume is cumulative until the next hard reset. The 'reset' is OK for securities trading, that resets every day anyway. But not for crypto - and not if/when securities trading goes 24/7. Also, the denominator accumulating over the entire period is also *not* OK, because then what is shown means something different as the day progresses - which kind of makes it useless. In other words, it starts out very sensitive to volume, and gets progressively more numb to it as they day progresses, and starts flattening out.
- This fixes both problems, by using a user-definable moving window for the average. Essentially combining SMA with volume-weighting.
- You may also find an invaluable trading aid, in the % bands above and below.
- What can optionally be shown is standard deviation bands, aka Bollinger bands. The advantage over regular BB is that it's volume-weighted. Since it is already calculated on a moving average, the period for the standard deviation has been shortened by default, and the magnitude increased, to better approximate regular Bollinger Bands - but it's still more responsive to volume.

ZenAlgo - AvengerThe ZenAlgo - Avenger indicator provides a multi-layered view of market behavior by combining volume delta analytics, trend-following EMAs, average price comparison, and price-volume profiling into a unified overlay. It is designed to visually assist traders in identifying areas of interest, momentum shifts, and potential reversals using cumulative data from both spot and perpetual markets.
Volume Delta Calculation
This indicator computes delta as the difference between estimated buy and sell volumes using volume data from multiple centralized exchanges. It distinguishes between spot and perpetual volumes, combining them into total volume.
To estimate buying and selling volume from raw volume data, candle structure is broken down into body and wicks. The body is interpreted as the core directional movement (buy/sell), while the wicks are treated as uncertain or counteraction. This segmentation helps infer the likely share of buying and selling within each bar.
The delta is calculated per bar and then aggregated over a lookback period (default 14 bars) to generate a cumulative delta. This approach provides a smoothed value of volume pressure trends over time.
A moving average is applied to the delta values (using selectable MA types like EMA or SMA) to define signal crossovers and suppress noise.
Delta Visualization
To contextualize delta within price action, the delta is scaled dynamically (by ATR or user-defined value) and plotted as a band around the closing price. Positive delta expands upward from price, negative delta downward. This provides a visual overlay that reflects net market pressure in context with price movement.
In cases of extreme delta (threshold set at 80% of recent maximum), the indicator marks spike bars using symbols to indicate significant directional pressure.
Identification of Noteworthy Conditions
The indicator highlights points on the chart where specific conditions are met based on the interaction between volume delta and its moving average. These conditions may align with moments of market pressure imbalance and directional movement, but they are not to be interpreted as trade signals in isolation.
Instead, these chart markers serve as visual flags for potential interest. They are intended to draw the user’s attention to scenarios where:
The delta crosses above or below its moving average, suggesting a potential shift in volume pressure.
The cumulative delta supports the direction of this crossover.
Optional filters can further restrict these markings to periods where:
The short-term trend (as inferred from EMA slope) supports the direction.
Volume is elevated relative to a recent average.
A user-defined cooldown period prevents multiple markings within short succession to avoid clutter.
It is essential to underscore that these markers do not constitute buy or sell advice . Their role is diagnostic , helping the trader to identify potential moments of interest which should be analyzed in conjunction with broader context, such as trend structure, price action, support/resistance levels, or external market data.
EMA Structure
Six EMAs with fixed lengths (13 to 56) are plotted and colored dynamically based on the most recent crossover between the fastest and slowest (EMA1 and EMA6). These EMAs help visualize short- to mid-term trends. The crossover itself is marked with symbols, with vertical offset based on ATR to maintain chart readability.
Average Line (AVG)
The indicator also calculates an average price based on a fixed window (100 bars). This is not a standard moving average but rather a raw average of recent prices stored in a circular buffer. The average is plotted, and its relative distance to the current price is labeled as a percentage. This feature serves as a simplified representation of fair value or mean reversion anchor.
EMA6 vs AVG Cross
Another layer of point of interest detection involves EMA6 crossing the AVG line. This crossover is only considered valid if EMA6 shows slope consistency in the crossing direction. These events are marked using symbols and offset vertically to avoid overlapping price action.
Divergence Detection
The script detects both regular and hidden divergences between price and delta:
Regular divergences are defined when price makes a higher high or lower low, while delta fails to confirm (makes a lower high or higher low).
Hidden divergences occur when price retraces (lower high or higher low), but delta moves against this retracement, indicating underlying strength or weakness.
Divergence points are labeled with "R" (regular) or "H" (hidden) and appear at local pivot highs or lows. The number of visible divergence labels can be limited for chart clarity.
POC and nPOC Calculations
The script includes a simplified volume profile implementation, calculating:
POC (Point of Control): the price level with the highest volume for the given period.
nPOC (non-tested POC): historical POCs that have not yet been revisited by price.
Price levels are bucketed into rows (user-defined), and volume per bucket is tracked to identify the POC. Upon a new period (e.g., day, week), a horizontal POC line is drawn. Once tested by price, the line’s appearance changes (color fades, label shrinks), helping users distinguish between untouched and touched levels.
Limits are enforced on the number of retained POCs and their maximum distance from current bars to optimize performance and chart readability.
Exchange Aggregation
Volume data is aggregated across major exchanges. This ensures that the delta calculation captures a broader market picture beyond a single venue, reducing exchange-specific noise.
How to Interpret Values
Delta Band: Wide bands indicate strong directional imbalance. Narrow bands suggest indecision or low volume.
EMA Crossover Symbols: Appear on directional shifts in moving averages. Multiple EMAs reinforcing the same slope typically indicate stronger trend.
AVG Line: Represents average price over recent history. Large deviations can indicate overextension or potential mean reversion.
Divergences: Regular ones may point to weakening momentum; hidden ones can suggest continuation despite corrective price action.
POC / nPOC: Key volume-based support/resistance levels. Untested nPOCs can act as magnets for price retests.
How to Best Use This Indicator
Use in conjunction with trend context (e.g., higher timeframe EMAs) to avoid counter-trend indications.
Treat delta spikes as caution zones—especially if they occur at known support/resistance.
Watch for divergences as early warning signs before price reverses.
Use POC/nPOC as target levels, especially if aligned with delta signals.
Apply volume and trend filters to reduce noise on shorter timeframes.
Added Value
Multi-exchange volume aggregation makes the delta calculation more robust.
Real-time cumulative delta overlaid directly on the price chart provides immediate context.
Points of interest on chart are conservative and filterable, intended to reduce false positives.
The combination of delta, trend-following EMAs, fair value line, and volume profile data is rarely found in one overlay script.
POC/nPOC visualization based on real traded volume helps identify high-interest zones for future price interaction.
Why Is It Worth Paying For
While free alternatives may provide partial insights (e.g., basic delta or single EMA crossovers), this indicator integrates multiple domains—delta, divergence, average price, trend overlays, and profile levels—into a coherent, optimized chart tool. The value lies not just in having these tools, but in how they are synchronized and visualized.
Furthermore, sourcing and synchronizing volume data from multiple exchanges for delta estimation is not straightforward in Pine Script and adds to the indicator's complexity and utility.
Disclaimers and Limitations
Delta estimation is based on candle structure and assumes wick/body distribution reflects buyer/seller activity, which may not always be precise.
Multi-exchange volume data relies on availability via TradingView’s request.security() function; if exchange data is missing or delayed, results may be incomplete.
Divergences do not guarantee reversals—should be used as part of a broader analysis framework.
On illiquid instruments or exotic pairs, the value of delta and volume-based analytics may be reduced due to unreliable volume.

Trend Classifier [ChartPrime]Trend Classifier
This is a multi-level trend classification tool that detects bullish, bearish, and ranging conditions using an adaptive smoothing method. It highlights trend strength through color-coded candles and layered bands, making it easy to interpret market momentum visually.
⯁ KEY FEATURES
Classifies trend strength using 3 bullish and 3 bearish levels relative to an adaptive trend line.
Neutral (range) zones are marked when price stays between key bands, often signaling low volatility or consolidation.
Automatically filters band visibility based on current trend direction:
In uptrends, only levels below the price are displayed.
In downtrends, only levels above the price are shown.
Color-coded candles:
Aqua candles for bullish conditions.
Red candles for bearish conditions.
Orange candles during neutral or ranging conditions.
Includes a trend direction change marker (diamond), plotted when a shift in trend is detected.
Plots a central smoothed trend line to anchor the trend bands dynamically.
Displays a trend strength dashboard in the top-right corner with real-time bull and bear scores (0 to 3).
Labels with arrows (▲/▼) show current trend direction and strength on the chart.
⯁ HOW TO USE
Use bull and bear levels (1–3) to assess the momentum of the current trend.
When bull = 0 and bear = 0 , market is considered ranging or consolidating – consider fading or waiting for breakout confirmation.
Trend bands can be used as dynamic support/resistance during trending phases.
Monitor the trend change diamonds to spot potential early reversals.
Combine with volume or oscillator tools for confirmation of strength shifts.
⯁ CONCLUSION
Trend Classifier helps traders stay aligned with the dominant trend while visually breaking down market momentum into levels. Its clean color-coded design and strength dashboard make it ideal for both trend following and range trading strategies.

Dynamic Trend Bands [ChartPrime]The Dynamic Trend Bands is a versatile trend-following indicator that uses a double-smoothed Hull Moving Average (HMA) to detect market trends, combined with dynamic bands that provide insight into potential momentum shifts and volatility-based price zones.
⯁ KEY FEATURES
Double HMA Trend Filter
Utilizes a double-smoothed HMA for a smoother and more responsive trend line, reducing noise while highlighting clear market trends.
float base = ta.hma(ta.hma(close, length - 10), length)
Dynamic Volatility Bands
Plots upper and lower bands based on volatility, positioned above the price in a downtrend and below the price in an uptrend.
Momentum Shift Detection
Highlights bars in orange when a potential momentum shift occurs:
- During a downtrend, if the high breaks above the upper band.
- During an uptrend, if the low breaks below the lower band.
Customizable Band Appearance
Users can adjust the size, distance, and colors of the bands, as well as choose whether to display the mid-band line and fill the area between bands.
Timeframe Flexibility
Allows selection of different calculation timeframes, enabling traders to adapt the indicator to various trading strategies.
⯁ HOW TO USE
Identify Trend Direction
Use the double HMA line to confirm the prevailing trend:
- Above the bands: downtrend.
- Below the bands: uptrend.
Spot Potential Momentum Shifts
Watch for orange-highlighted bars signaling potential reversals or weakening trends.
Optimize Entries and Exits
Enter trades on trend continuation signals while using band breaks to spot potential reversal zones.
Customize to Fit Your Strategy
Adjust the bands’ size, distance, and calculation timeframe to suit scalping, swing, or position trading.
⯁ CONCLUSION
The Dynamic Trend Bands is an all-in-one tool that helps traders assess trend strength, detect momentum shifts, and identify key price zones. Its customizable features make it adaptable for various trading styles and market conditions.

HL2 Moving Average with BandsThis indicator is designed to assist traders in identifying potential trade entries and exits for S&P 500 (ES) and Nasdaq-100 (NQ) futures. It calculates a Simple Moving Average (SMA) based on the HL2 value (average of high and low prices) of the current candle over a user-defined lookback period (default: 200 periods). The indicator plots this SMA as a blue line, providing a smoothed reference for price trends.
Additionally, it includes upper and lower bands calculated as a percentage (default: 0.5%) above and below the SMA, plotted as green and red lines, respectively. These bands act as dynamic thresholds to identify overbought or oversold conditions. The indicator generates trade signals based on price action relative to these bands:
Long Entry: A green upward triangle is plotted below the candle when the close crosses above the upper band, signaling a potential buy.
Close Long: A red square is plotted above the candle when the close crosses back below the upper band, indicating an exit for the long position.
Short Entry: A red downward triangle is plotted above the candle when the close crosses below the lower band, signaling a potential sell.
Close Short: A green square is plotted below the candle when the close crosses back above the lower band, indicating an exit for the short position.
The script is customizable, allowing users to adjust the SMA length and band percentage to suit their trading style or market conditions. It is plotted as an overlay on the price chart for easy integration with other technical analysis tools.
Recommended Time Frame and Settings for Trading S&P 500 and Nasdaq-100 Futures
Based on research and market dynamics for S&P 500 (ES) and Nasdaq-100 (NQ) futures, the 5-minute chart is recommended as the optimal time frame for day trading with this indicator. This time frame strikes a balance between capturing intraday trends and filtering out excessive noise, which is critical for futures trading due to their high volatility and leverage. The 5-minute chart aligns well with periods of high liquidity and volatility, such as the U.S. market open (9:30 AM–11:00 AM EST) and the afternoon session (2:00 PM–4:00 PM EST), when institutional traders are most active.
Why 5-minute? It allows traders to react to short-term price movements while avoiding the rapid fluctuations of 1-minute charts, which can be prone to false signals in choppy markets. It also provides enough data points to make the SMA and bands meaningful without the lag associated with longer time frames like 15-minute or hourly charts.
Recommended Settings
SMA Length: Set to 200 periods. This longer lookback period smooths the HL2 data, reducing noise and providing a reliable trend reference for the 5-minute chart. A 200-period SMA helps identify significant trend shifts without being overly sensitive to minor price fluctuations.
Band Percentage: 0.5% is more suitable for the volatility of ES and NQ futures on a 5-minute chart, as it generates fewer but higher-probability signals. Wider bands (e.g., 1%) may miss short-term opportunities, while narrower bands (e.g., 0.1%) may produce excessive false signals.
Trading Session Recommendations
Futures markets for ES and NQ are open nearly 24 hours (Sunday 6:00 PM EST to Friday 5:00 PM EST, with a daily break from 4:00 PM–5:00 PM EST), but not all hours are equally optimal due to varying liquidity and volatility. The best times to trade with this indicator are:
U.S. Market Open (9:30 AM–11:00 AM EST): This period is characterized by high volume and volatility, driven by the opening of U.S. equity markets and economic data releases (e.g., 8:30 AM EST reports like CPI or GDP). The indicator’s signals are more reliable during this window due to strong order flow and price momentum.
Afternoon Session (2:00 PM–4:00 PM EST): After the lunchtime lull, volume picks up as institutional traders return, and news or FOMC announcements often drive price action. The indicator can capture breakout moves as prices test the upper or lower bands.
Pre-Market (7:30 AM–9:30 AM EST): For traders comfortable with lower liquidity, this period can offer opportunities, especially around 8:30 AM EST economic releases. However, use tighter risk management due to wider spreads and potential volatility spikes.
Additional Tips
Avoid Low-Volume Periods: Steer clear of trading during low-liquidity hours, such as the overnight session (11:00 PM–3:00 AM EST), when spreads widen and price movements can be erratic, leading to false signals from the indicator.
Combine with Other Tools: Enhance the indicator’s effectiveness by pairing it with support/resistance levels, Fibonacci retracements, or volume analysis to confirm signals. For example, a long entry signal above the upper band is stronger if it coincides with a breakout above a key resistance level.
Risk Management: Given the leverage in futures (e.g., Micro E-mini contracts require ~$1,200 margin for ES), use tight stop-losses (e.g., below the lower band for longs or above the upper band for shorts) to manage risk. Aim for a risk-reward ratio of at least 1:2.
Test Settings: Backtest the indicator on a demo account to optimize the SMA length and band percentage for your specific trading style and risk tolerance. Micro E-mini contracts (MES for S&P 500, MNQ for Nasdaq-100) are ideal for testing due to their lower capital requirements.
Why These Settings and Time Frame?
The 5-minute chart with a 200-period SMA and 0.5% bands is tailored for the volatility and liquidity of ES and NQ futures during peak trading hours. The longer SMA period ensures the indicator captures meaningful trends, while the 0.5% bands are tight enough to signal actionable breakouts but wide enough to avoid excessive whipsaws. Trading during high-volume sessions maximizes the likelihood of valid signals, as institutional participation drives clearer price action.
By focusing on these settings and time frames, traders can leverage the indicator to capitalize on the dynamic price movements of S&P 500 and Nasdaq-100 futures while managing the inherent risks of these markets.

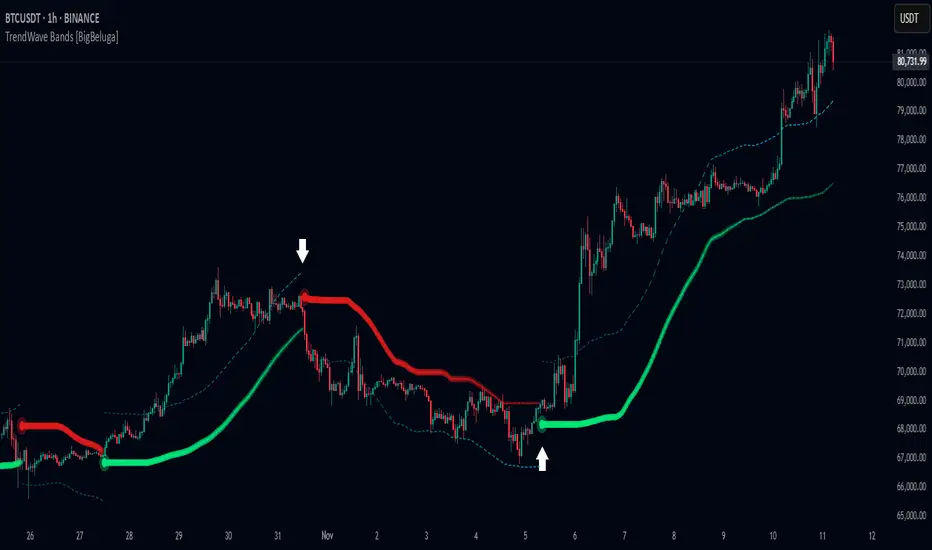
TrendWave Bands [BigBeluga]This is a trend-following indicator that dynamically adapts to market trends using upper and lower bands. It visually highlights trend strength and duration through color intensity while providing additional wave bands for deeper trend analysis.
🔵Key Features:
Adaptive Trend Bands:
➣ Displays a lower band in uptrends and an upper band in downtrends to indicate trend direction.
➣ The bands act as dynamic support and resistance levels, helping traders identify potential entry and exit points.
Wave Bands for Additional Analysis:
➣ A dashed wave band appears opposite the main trend band for deeper trend confirmation.
➣ In an uptrend, the upper dashed wave band helps analyze momentum, while in a downtrend, the lower dashed wave band serves the same purpose.
Gradient Color Intensity:
➣ The trend bands have a color gradient that fades as the trend continues, helping traders visualize trend duration.
➣ The wave bands have an inverse gradient effect—starting with low intensity at the trend's beginning and increasing in intensity as the trend progresses.
Trend Change Signals:
➣ Circular markers appear at trend reversals, providing clear entry and exit points.
➣ These signals mark transitions between bullish and bearish phases based on price action.
🔵Usage:
Trend Following: Use the lower band for confirmation in uptrends and the upper band in downtrends to stay on the right side of the market.
Trend Duration Analysis: Gradient wavebands give an idea of the duration of the current trend — new trends will have high-intensity colored wavebands and as time goes on, trends will fade.
Trend Reversal Detection: Circular markers highlight trend shifts, making it easier to spot entry and exit opportunities.
Volatility Awareness: Volatility-based bands help traders adjust their strategies based on market volatility, ensuring better risk management.
TrendWave Bands is a powerful tool for traders seeking to follow market trends with enhanced visual clarity. By combining trend bands, wave bands, and gradient-based color scaling, it provides a detailed view of market dynamics and trend evolution.
LinearRegressionLibrary "LinearRegression"
Calculates a variety of linear regression and deviation types, with optional emphasis weighting. Additionally, multiple of slope and Pearson’s R calculations.
calcSlope(_src, _len, _condition)
Calculates the slope of a linear regression over the specified length.
Parameters:
_src (float) : (float) The source data.
_len (int) : (int) The length of the lookback period for the linear regression.
_condition (bool) : (bool) Flag to enable calculation. Set to true to calculate on every bar; otherwise, set to barstate.islast for efficiency.
Returns: (float) The slope of the linear regression.
calcReg(_src, _len, _condition)
Calculates a basic linear regression, returning y1, y2, slope, and average.
Parameters:
_src (float) : (float) The source data series.
_len (int) : (int) The length of the lookback period.
_condition (bool) : (bool) Flag to enable calculation (true = calculate).
Returns: (float ) An array of 4 values: .
calcRegStandard(_src, _len, _emphasis, _condition)
Calculates an Standard linear regression with optional emphasis.
Parameters:
_src (float) : (series float) The source data series.
_len (int) : (int) The length of the lookback period.
_emphasis (float) : (float) The emphasis factor: 0 for equal weight; >0 emphasizes recent bars; <0 emphasizes older bars.
_condition (bool) : (bool) Flag to enable calculation (true = calculate).
Returns: (float ) .
calcRegRidge(_src, _len, lambda, _emphasis, _condition)
Calculates a ridge regression with optional emphasis.
Parameters:
_src (float) : (float) The source data series.
_len (int) : (int) The length of the lookback period.
lambda (float) : (float) The ridge regularization parameter.
_emphasis (float) : (float) The emphasis factor: 0 for equal weight; >0 emphasizes recent bars; <0 emphasizes older bars.
_condition (bool) : (bool) Flag to enable calculation (true = calculate).
Returns: (float ) .
calcRegLasso(_src, _len, lambda, _emphasis, _condition)
Calculates a Lasso regression with optional emphasis.
Parameters:
_src (float) : (float) The source data series.
_len (int) : (int) The length of the lookback period.
lambda (float) : (float) The Lasso regularization parameter.
_emphasis (float) : (float) The emphasis factor: 0 for equal weight; >0 emphasizes recent bars; <0 emphasizes older bars.
_condition (bool) : (bool) Flag to enable calculation (true = calculate).
Returns: (float ) .
calcElasticNetLinReg(_src, _len, lambda1, lambda2, _emphasis, _condition)
Calculates an Elastic Net regression with optional emphasis.
Parameters:
_src (float) : (float) The source data series.
_len (int) : (int) The length of the lookback period.
lambda1 (float) : (float) L1 regularization parameter (Lasso).
lambda2 (float) : (float) L2 regularization parameter (Ridge).
_emphasis (float) : (float) Emphasis factor: 0 for equal weight; >0 emphasizes recent bars; <0 emphasizes older bars.
_condition (bool) : (bool) Flag to enable calculation (true = calculate).
Returns: (float ) .
calcRegHuber(_src, _len, delta, iterations, _emphasis, _condition)
Calculates a Huber regression using Iteratively Reweighted Least Squares (IRLS).
Parameters:
_src (float) : (float) The source data series.
_len (int) : (int) The length of the lookback period.
delta (float) : (float) Huber threshold parameter.
iterations (int) : (int) Number of IRLS iterations.
_emphasis (float) : (float) Emphasis factor: 0 for equal weight; >0 emphasizes recent bars; <0 emphasizes older bars.
_condition (bool) : (bool) Flag to enable calculation (true = calculate).
Returns: (float ) .
calcRegLAD(_src, _len, iterations, _emphasis, _condition)
Calculates a Least Absolute Deviations (LAD) regression via IRLS.
Parameters:
_src (float) : (float) The source data series.
_len (int) : (int) The length of the lookback period.
iterations (int) : (int) Number of IRLS iterations for LAD.
_emphasis (float) : (float) Emphasis factor: 0 for equal weight; >0 emphasizes recent bars; <0 emphasizes older bars.
_condition (bool) : (bool) Flag to enable calculation (true = calculate).
Returns: (float ) .
calcRegBayesian(_src, _len, priorMean, priorSpan, sigma, _emphasis, _condition)
Calculates a Bayesian linear regression with optional emphasis.
Parameters:
_src (float) : (float) The source data series.
_len (int) : (int) The length of the lookback period.
priorMean (float) : (float) The prior mean for the slope.
priorSpan (float) : (float) The prior variance (or span) for the slope.
sigma (float) : (float) The assumed standard deviation of residuals.
_emphasis (float) : (float) Emphasis factor: 0 for equal weight; >0 emphasizes recent bars; <0 emphasizes older bars.
_condition (bool) : (bool) Flag to enable calculation (true = calculate).
Returns: (float ) .
calcRFromLinReg(_src, _len, _slope, _average, _y1, _condition)
Calculates the Pearson correlation coefficient (R) based on linear regression parameters.
Parameters:
_src (float) : (float) The source data.
_len (int) : (int) The length of the lookback period.
_slope (float) : (float) The slope of the linear regression.
_average (float) : (float) The average value of the source data series.
_y1 (float) : (float) The starting point (y-intercept of the oldest bar) for the linear regression.
_condition (bool) : (bool) Flag to enable calculation. Set to true to calculate on every bar; otherwise, set to barstate.islast for efficiency.
Returns: (float) The Pearson correlation coefficient (R) adjusted for the direction of the slope.
calcRFromSource(_src, _len, _condition)
Calculates the correlation coefficient (R) using a specified length and source data.
Parameters:
_src (float) : (float) The source data.
_len (int) : (int) The length of the lookback period.
_condition (bool) : (bool) Flag to enable calculation. Set to true to calculate on every bar; otherwise, set to barstate.islast for efficiency.
Returns: (float) The correlation coefficient (R).
calcSlopeLengthZero(_src, _len, _minLen, _step, _condition)
Identifies the length at which the slope is flattest (closest to zero).
Parameters:
_src (float) : (float) The source data.
_len (int) : (int) The maximum lookback length to consider (minimum of 2).
_minLen (int) : (int) The minimum length to start from (cannot exceed the max length).
_step (int) : (int) The increment step for lengths.
_condition (bool) : (bool) Flag to enable calculation. Set to true to calculate on every bar; otherwise, set to barstate.islast.
Returns: (int) The length at which the slope is flattest.
calcSlopeLengthHighest(_src, _len, _minLen, _step, _condition)
Identifies the length at which the slope is highest.
Parameters:
_src (float) : (float) The source data.
_len (int) : (int) The maximum lookback length (minimum of 2).
_minLen (int) : (int) The minimum length to start from.
_step (int) : (int) The step for incrementing lengths.
_condition (bool) : (bool) Flag to enable calculation. Set to true to calculate on every bar; otherwise, set to barstate.islast.
Returns: (int) The length at which the slope is highest.
calcSlopeLengthLowest(_src, _len, _minLen, _step, _condition)
Identifies the length at which the slope is lowest.
Parameters:
_src (float) : (float) The source data.
_len (int) : (int) The maximum lookback length (minimum of 2).
_minLen (int) : (int) The minimum length to start from.
_step (int) : (int) The step for incrementing lengths.
_condition (bool) : (bool) Flag to enable calculation. Set to true to calculate on every bar; otherwise, set to barstate.islast.
Returns: (int) The length at which the slope is lowest.
calcSlopeLengthAbsolute(_src, _len, _minLen, _step, _condition)
Identifies the length at which the absolute slope value is highest.
Parameters:
_src (float) : (float) The source data.
_len (int) : (int) The maximum lookback length (minimum of 2).
_minLen (int) : (int) The minimum length to start from.
_step (int) : (int) The step for incrementing lengths.
_condition (bool) : (bool) Flag to enable calculation. Set to true to calculate on every bar; otherwise, set to barstate.islast.
Returns: (int) The length at which the absolute slope value is highest.
calcRLengthZero(_src, _len, _minLen, _step, _condition)
Identifies the length with the lowest absolute R value.
Parameters:
_src (float) : (float) The source data.
_len (int) : (int) The maximum lookback length (minimum of 2).
_minLen (int) : (int) The minimum length to start from.
_step (int) : (int) The step for incrementing lengths.
_condition (bool) : (bool) Flag to enable calculation. Set to true to calculate on every bar; otherwise, set to barstate.islast.
Returns: (int) The length with the lowest absolute R value.
calcRLengthHighest(_src, _len, _minLen, _step, _condition)
Identifies the length with the highest R value.
Parameters:
_src (float) : (float) The source data.
_len (int) : (int) The maximum lookback length (minimum of 2).
_minLen (int) : (int) The minimum length to start from.
_step (int) : (int) The step for incrementing lengths.
_condition (bool) : (bool) Flag to enable calculation. Set to true to calculate on every bar; otherwise, set to barstate.islast.
Returns: (int) The length with the highest R value.
calcRLengthLowest(_src, _len, _minLen, _step, _condition)
Identifies the length with the lowest R value.
Parameters:
_src (float) : (float) The source data.
_len (int) : (int) The maximum lookback length (minimum of 2).
_minLen (int) : (int) The minimum length to start from.
_step (int) : (int) The step for incrementing lengths.
_condition (bool) : (bool) Flag to enable calculation. Set to true to calculate on every bar; otherwise, set to barstate.islast.
Returns: (int) The length with the lowest R value.
calcRLengthAbsolute(_src, _len, _minLen, _step, _condition)
Identifies the length with the highest absolute R value.
Parameters:
_src (float) : (float) The source data.
_len (int) : (int) The maximum lookback length (minimum of 2).
_minLen (int) : (int) The minimum length to start from.
_step (int) : (int) The step for incrementing lengths.
_condition (bool) : (bool) Flag to enable calculation. Set to true to calculate on every bar; otherwise, set to barstate.islast.
Returns: (int) The length with the highest absolute R value.
calcDevReverse(_src, _len, _slope, _y1, _inputDev, _emphasis, _condition)
Calculates the regressive linear deviation in reverse order, with optional emphasis on recent data.
Parameters:
_src (float) : (float) The source data.
_len (int) : (int) The length of the lookback period.
_slope (float) : (float) The slope of the linear regression.
_y1 (float) : (float) The y-intercept (oldest bar) of the linear regression.
_inputDev (float) : (float) The input deviation multiplier.
_emphasis (float) : (float) Emphasis factor: 0 for equal weight; >0 emphasizes recent bars; <0 emphasizes older bars.
_condition (bool) : (bool) Flag to enable calculation (true = calculate).
Returns: A 2-element tuple: .
calcDevForward(_src, _len, _slope, _y1, _inputDev, _emphasis, _condition)
Calculates the progressive linear deviation in forward order (oldest to most recent bar), with optional emphasis.
Parameters:
_src (float) : (float) The source data array, where _src is oldest and _src is most recent.
_len (int) : (int) The length of the lookback period.
_slope (float) : (float) The slope of the linear regression.
_y1 (float) : (float) The y-intercept of the linear regression (value at the most recent bar, adjusted by slope).
_inputDev (float) : (float) The input deviation multiplier.
_emphasis (float) : (float) Emphasis factor: 0 for equal weight; >0 emphasizes recent bars; <0 emphasizes older bars.
_condition (bool) : (bool) Flag to enable calculation (true = calculate).
Returns: A 2-element tuple: .
calcDevBalanced(_src, _len, _slope, _y1, _inputDev, _emphasis, _condition)
Calculates the balanced linear deviation with optional emphasis on recent or older data.
Parameters:
_src (float) : (float) Source data array, where _src is the most recent and _src is the oldest.
_len (int) : (int) The length of the lookback period.
_slope (float) : (float) The slope of the linear regression.
_y1 (float) : (float) The y-intercept of the linear regression (value at the oldest bar).
_inputDev (float) : (float) The input deviation multiplier.
_emphasis (float) : (float) Emphasis factor: 0 for equal weight; >0 emphasizes recent bars; <0 emphasizes older bars.
_condition (bool) : (bool) Flag to enable calculation (true = calculate).
Returns: A 2-element tuple: .
calcDevMean(_src, _len, _slope, _y1, _inputDev, _emphasis, _condition)
Calculates the mean absolute deviation from a forward-applied linear trend (oldest to most recent), with optional emphasis.
Parameters:
_src (float) : (float) The source data array, where _src is the most recent and _src is the oldest.
_len (int) : (int) The length of the lookback period.
_slope (float) : (float) The slope of the linear regression.
_y1 (float) : (float) The y-intercept (oldest bar) of the linear regression.
_inputDev (float) : (float) The input deviation multiplier.
_emphasis (float) : (float) Emphasis factor: 0 for equal weight; >0 emphasizes recent bars; <0 emphasizes older bars.
_condition (bool) : (bool) Flag to enable calculation (true = calculate).
Returns: A 2-element tuple: .
calcDevMedian(_src, _len, _slope, _y1, _inputDev, _emphasis, _condition)
Calculates the median absolute deviation with optional emphasis on recent data.
Parameters:
_src (float) : (float) The source data array (index 0 = oldest, index _len - 1 = most recent).
_len (int) : (int) The length of the lookback period.
_slope (float) : (float) The slope of the linear regression.
_y1 (float) : (float) The y-intercept (oldest bar) of the linear regression.
_inputDev (float) : (float) The deviation multiplier.
_emphasis (float) : (float) Emphasis factor: 0 for equal weight; >0 emphasizes recent bars; <0 emphasizes older bars.
_condition (bool) : (bool) Flag to enable calculation (true = calculate).
Returns:
calcDevPercent(_y1, _inputDev, _condition)
Calculates the percent deviation from a given value and a specified percentage.
Parameters:
_y1 (float) : (float) The base value from which to calculate deviation.
_inputDev (float) : (float) The deviation percentage.
_condition (bool) : (bool) Flag to enable calculation (true = calculate).
Returns: A 2-element tuple: .
calcDevFitted(_len, _slope, _y1, _emphasis, _condition)
Calculates the weighted fitted deviation based on high and low series data, showing max deviation, with optional emphasis.
Parameters:
_len (int) : (int) The length of the lookback period.
_slope (float) : (float) The slope of the linear regression.
_y1 (float) : (float) The Y-intercept (oldest bar) of the linear regression.
_emphasis (float) : (float) Emphasis factor: 0 for equal weight; >0 emphasizes recent bars; <0 emphasizes older bars.
_condition (bool) : (bool) Flag to enable calculation (true = calculate).
Returns: A 2-element tuple: .
calcDevATR(_src, _len, _slope, _y1, _inputDev, _emphasis, _condition)
Calculates an ATR-style deviation with optional emphasis on recent data.
Parameters:
_src (float) : (float) The source data (typically close).
_len (int) : (int) The length of the lookback period.
_slope (float) : (float) The slope of the linear regression.
_y1 (float) : (float) The Y-intercept (oldest bar) of the linear regression.
_inputDev (float) : (float) The input deviation multiplier.
_emphasis (float) : (float) Emphasis factor: 0 for equal weight; >0 emphasizes recent bars; <0 emphasizes older bars.
_condition (bool) : (bool) Flag to enable calculation (true = calculate).
Returns: A 2-element tuple: .
calcPricePositionPercent(_top, _bot, _src)
Calculates the percent position of a price within a linear regression channel. Top=100%, Bottom=0%.
Parameters:
_top (float) : (float) The top (positive) deviation, corresponding to 100%.
_bot (float) : (float) The bottom (negative) deviation, corresponding to 0%.
_src (float) : (float) The source price.
Returns: (float) The percent position within the channel.
plotLinReg(_len, _y1, _y2, _slope, _devTop, _devBot, _scaleTypeLog, _lineWidth, _extendLines, _channelStyle, _colorFill, _colUpLine, _colDnLine, _colUpFill, _colDnFill)
Plots the linear regression line and its deviations, with configurable styles and fill.
Parameters:
_len (int) : (int) The lookback period for the linear regression.
_y1 (float) : (float) The starting y-value of the regression line.
_y2 (float) : (float) The ending y-value of the regression line.
_slope (float) : (float) The slope of the regression line (used to determine line color).
_devTop (float) : (float) The top deviation to add to the line.
_devBot (float) : (float) The bottom deviation to subtract from the line.
_scaleTypeLog (bool) : (bool) Use a log scale if true; otherwise, linear scale.
_lineWidth (int) : (int) The width of the plotted lines.
_extendLines (string) : (string) How lines should extend (none, left, right, both).
_channelStyle (string) : (string) The style of the channel lines (solid, dashed, dotted).
_colorFill (bool) : (bool) Whether to fill the space between the top and bottom deviation lines.
_colUpLine (color) : (color) Line color when slope is positive.
_colDnLine (color) : (color) Line color when slope is negative.
_colUpFill (color) : (color) Fill color when slope is positive.
_colDnFill (color) : (color) Fill color when slope is negative.

Dynamic Heat Levels [BigBeluga]This indicator visualizes dynamic support and resistance levels with an adaptive heatmap effect. It helps traders identify key price interaction zones and potential mean reversion opportunities by displaying multiple levels that react to price movement.
🔵Key Features:
Multi-Level Heatmap Channel:
- The indicator plots multiple dynamic levels forming a structured channel.
- Each level represents a historical price interaction zone, helping traders identify critical areas.
- The channel expands or contracts based on market conditions, adapting dynamically to price movements.
Heatmap-Based Strength Indication:
- Levels change in transparency and color intensity based on price interactions for the length period .
- The more frequently price interacts with a level, the more visible and intense the color becomes.
- When a level reaches a threshold (count > 10), it starts to turn red, signaling a high-heat zone with significant price activity.
🔵Usage:
Support & Resistance Analysis: Identify price levels where the market frequently interacts, making them strong areas for trade decisions.
Heatmap Strength Assessment: More intense red levels indicate areas with heavy price activity, useful for detecting key liquidity zones.
Dynamic Heat Levels is a powerful tool for traders looking to analyze price interaction zones with a heatmap effect. It offers a structured visualization of market dynamics, allowing traders to gauge the significance of key levels and detect mean reversion setups effectively.

Lowess Channel + (RSI) [ChartPrime]The Lowess Channel + (RSI) indicator applies the LOWESS (Locally Weighted Scatterplot Smoothing) algorithm to filter price fluctuations and construct a dynamic channel. LOWESS is a non-parametric regression method that smooths noisy data by fitting weighted linear regressions at localized segments. This technique is widely used in statistical analysis to reveal trends while preserving data structure.
In this indicator, the LOWESS algorithm is used to create a central trend line and deviation-based bands. The midline changes color based on trend direction, and diamonds are plotted when a trend shift occurs. Additionally, an RSI gauge is positioned at the end of the channel to display the current RSI level in relation to the price bands.
lowess_smooth(src, length, bandwidth) =>
sum_weights = 0.0
sum_weighted_y = 0.0
sum_weighted_xy = 0.0
sum_weighted_x2 = 0.0
sum_weighted_x = 0.0
for i = 0 to length - 1
x = float(i)
weight = math.exp(-0.5 * (x / bandwidth) * (x / bandwidth))
y = nz(src , 0)
sum_weights := sum_weights + weight
sum_weighted_x := sum_weighted_x + weight * x
sum_weighted_y := sum_weighted_y + weight * y
sum_weighted_xy := sum_weighted_xy + weight * x * y
sum_weighted_x2 := sum_weighted_x2 + weight * x * x
mean_x = sum_weighted_x / sum_weights
mean_y = sum_weighted_y / sum_weights
beta = (sum_weighted_xy - mean_x * mean_y * sum_weights) / (sum_weighted_x2 - mean_x * mean_x * sum_weights)
alpha = mean_y - beta * mean_x
alpha + beta * float(length / 2) // Centered smoothing
⯁ KEY FEATURES
LOWESS Price Filtering – Smooths price fluctuations to reveal the underlying trend with minimal lag.
Dynamic Trend Coloring – The midline changes color based on trend direction (e.g., bullish or bearish).
Trend Shift Diamonds – Marks points where the midline color changes, indicating a possible trend shift.
Deviation-Based Bands – Expands above and below the midline using ATR-based multipliers for volatility tracking.
RSI Gauge Display – A vertical gauge at the right side of the chart shows the current RSI level relative to the price channel.
Fully Customizable – Users can adjust LOWESS length, band width, colors, and enable or disable the RSI gauge and adjust RSIlength.
⯁ HOW TO USE
Use the LOWESS midline as a trend filter —bullish when green, bearish when purple.
Watch for trend shift diamonds as potential entry or exit signals.
Utilize the price bands to gauge overbought and oversold zones based on volatility.
Monitor the RSI gauge to confirm trend strength—high RSI near upper bands suggests overbought conditions, while low RSI near lower bands indicates oversold conditions.
⯁ CONCLUSION
The Lowess Channel + (RSI) indicator offers a powerful way to analyze market trends by applying a statistically robust smoothing algorithm. Unlike traditional moving averages, LOWESS filtering provides a flexible, responsive trendline that adapts to price movements. The integrated RSI gauge enhances decision-making by displaying momentum conditions alongside trend dynamics. Whether used for trend-following or mean reversion strategies, this indicator provides traders with a well-rounded perspective on market behavior.

Adaptive Fibonacci Volatility Bands (AFVB)
**Adaptive Fibonacci Volatility Bands (AFVB)**
### **Overview**
The **Adaptive Fibonacci Volatility Bands (AFVB)** indicator enhances standard **Fibonacci retracement levels** by dynamically adjusting them based on market **volatility**. By incorporating **ATR (Average True Range) adjustments**, this indicator refines key **support and resistance zones**, helping traders identify **more reliable entry and exit points**.
**Key Features:**
- **ATR-based adaptive Fibonacci levels** that adjust to changing market volatility.
- **Buy and Sell signals** based on price interactions with dynamic support/resistance.
- **Toggleable confirmation filter** for refining trade signals.
- **Customizable color schemes** and alerts.
---
## **How This Indicator Works**
The **AFVB** operates in three main steps:
### **1️⃣ Detecting Key Fibonacci Levels**
The script calculates **swing highs and swing lows** using a user-defined lookback period. From this, it derives **Fibonacci retracement levels**:
- **0% (High)**
- **23.6%**
- **38.2%**
- **50% (Mid-Level)**
- **61.8%**
- **78.6%**
- **100% (Low)**
### **2️⃣ Adjusting for Market Volatility**
Instead of using **fixed retracement levels**, this indicator incorporates an **ATR-based adjustment**:
- **Resistance levels** shift **upward** based on ATR.
- **Support levels** shift **downward** based on ATR.
- This makes levels more **responsive** to price action.
### **3️⃣ Generating Buy & Sell Signals**
AFVB provides **two types of signals** based on price interactions with key levels:
✔ **Buy Signal**:
Occurs when price **dips below** a support level (78.6% or 100%) and **then closes back above it**.
- **Optionally**, a confirmation buffer can be enabled to require price to close **above an additional threshold** (based on ATR).
✔ **Sell Signal**:
Triggered when price **breaks above a resistance level** (0% or 23.6%) and **then closes below it**.
📌 **Important:**
- The **buy threshold setting** allows traders to **fine-tune** entry conditions.
- Turning this setting **off** generates **more frequent** buy signals.
- Keeping it **on** reduces false signals but may result in **fewer trade opportunities**.
---
## **How to Use This Indicator in Trading**
### 🔹 **Entry Strategy (Buying)**
1️⃣ Look for **buy signals** at the **78.6% or 100% Fibonacci levels**.
2️⃣ Ensure price **closes above** the support level before entering a long trade.
3️⃣ **Enable or disable** the buy threshold filter depending on desired trade strictness.
### 🔹 **Exit Strategy (Selling)**
1️⃣ Watch for **sell signals** at the **0% or 23.6% Fibonacci levels**.
2️⃣ If price **breaks above resistance and then closes below**, consider exiting long positions.
3️⃣ Can be used **alone** or **combined with trend confirmation tools** (e.g., moving averages, RSI).
### 🔹 **Using the Toggleable Buy Threshold**
- **ON**: Buy signal requires **extra confirmation** (reduces false signals but fewer trades).
- **OFF**: Buy triggers as soon as price **closes back above support** (more signals, but may include weaker setups).
---
## **User Inputs**
### **🔧 Customization Options**
- **ATR Length**: Defines the period for **ATR calculation**.
- **Swing Lookback**: Determines how far back to find **swing highs and lows**.
- **ATR Multiplier**: Adjusts the size of **volatility-based modifications**.
- **Buy/Sell Threshold Factor**: Fine-tunes the **entry signal strictness**.
- **Show Level Labels**: Enables/disables **Fibonacci level annotations**.
- **Color Settings**: Customize **support/resistance colors**.
### **📢 Alerts**
AFVB includes built-in **alert conditions** for:
- **Buy Signals** ("AFVB BUY SIGNAL - Possible reversal at support")
- **Sell Signals** ("AFVB SELL SIGNAL - Possible reversal at resistance")
- **Any Signal Triggered** (Useful for automated alerts)
---
## **Who Is This Indicator For?**
✅ **Scalpers & Day Traders** – Helps identify **short-term reversals**.
✅ **Swing Traders** – Useful for **buying dips** and **selling rallies**.
✅ **Trend Traders** – Can be combined with **momentum indicators** for confirmation.
**Best Timeframes:**
⏳ **15-minute, 1-hour, 4-hour, Daily charts** (works across multiple assets).
---
## **Limitations & Considerations**
🚨 **Important Notes**:
- **No indicator guarantees profits**. Always **combine** it with **risk management strategies**.
- Works best **in trending & mean-reverting markets**—may generate false signals in **choppy conditions**.
- Performance may vary across **different assets & timeframes**.
📢 **Backtesting is recommended** before using it for live trading.

OBV Trend Bands [Alpha Extract]OBV Trend Bands 📊
The OBV Trend Bands indicator leverages On-Balance Volume (OBV) to assess trend strength and potential reversals by plotting a dynamic median line alongside upper and lower bands based on standard deviation. This tool helps traders identify overbought or oversold conditions and visualize OBV momentum relative to historical trends.
🔶 CALCULATION
The indicator calculates OBV, a dynamic median of OBV, and standard deviation bands to measure volume-driven momentum:
• OBV: Cumulative volume that adds or subtracts based on price direction.
• Aggregate Median: A smoothed median of OBV over a user-defined lookback period, adjusted by a minimum lookback for robustness.
• Standard Deviation Bands: Upper and lower bands derived from the scaled aggregate median, adjusted by a multiplier.
• Scaled OBV: OBV divided by a customizable scaling factor for better visualization.
Formula:
• OBV = Cumulative sum of volume (positive if price increases, negative if price decreases)
• Aggregate Median = Average of simple medians over a range from minLookbackPeriod to length
• Upper Band = Aggregate Median / Scaling Factor + StdMultiplier * StdDev
• Lower Band = Aggregate Median / Scaling Factor - StdMultiplier * StdDev
🔶 DETAILS
Visual Features:
• OBV Line (Dynamic Color): Plotted with a color that shifts based on its position—green above the upper band (bullish), red below the lower band (bearish), and white between bands (neutral).
• Upper Band (Green): Represents the overbought threshold, lightly shaded for clarity.
• Lower Band (Red): Indicates the oversold threshold, also lightly shaded.
• Aggregate Median Line (Gray): Acts as the central trend reference.
• Fill Areas: Transparent green fill when OBV exceeds the upper band, transparent red fill when below the lower band, and no fill within the bands.
Interpretation:
• Bullish Signal: OBV rises above the upper band, suggesting strong buying pressure and potential trend continuation.
• Bearish Signal: OBV falls below the lower band, indicating selling pressure and possible trend weakness.
• Neutral Zone: OBV between bands reflects consolidation or indecision in the market.
🔶 EXAMPLES
The chart demonstrates:
• Bullish Momentum: OBV crosses above the upper band with a green line and fill, signaling robust accumulation.
• Bearish Momentum: OBV drops below the lower band with a red line and fill, indicating distribution or selling pressure.
• Reversal Points: Transitions of OBV from below the lower band to above the upper band (or vice versa) suggest potential trend shifts.
Example Snapshots:
• A sustained bullish phase where OBV remains above the upper band with consistent green coloring.
• A bearish trend change where OBV falls below the upper band hinting at weakening momentum leading to a change in trend.
🔶 SETTINGS
Customization Options:
• Median Length (Default: 100): Adjusts the period for calculating the aggregate median, tailoring trend sensitivity.
• Minimum Lookback Period (Default: 30): Sets the shortest period for median aggregation, refining responsiveness.
• Standard Deviation Multiplier (Default: 1.0): Controls the width of the bands—higher values widen them, lower values tighten them.
• Scaling Factor (Default: 100,000): Scales OBV for better chart readability, adjustable based on asset volume.
The OBV Trend Bands indicator is a versatile tool for traders, blending volume analysis with statistical boundaries to effectively pinpoint market extremes and momentum shifts.

Anchored Powered KAMA [LuxAlgo]The Anchored Powered KAMA tool is a new flavor of the famous Kaufman's Adaptive Moving Average (KAMA).
It adds 5 different anchoring periods, a power exponent to the original KAMA calculation to increase the degree of filtering during ranging trends, and standard deviation bands calculated against the KAMA itself.
🔶 USAGE
In the image above we can see the different parts of the tool, it displays the Anchored Powered KAMA surrounded by standard deviation bands at 2x (solid) and 1x (dashed) by default.
This tool provides a simple and easy way to determine if the current market is ranging or trending and where the market extremes are in the current period.
As a rule of thumb, traders may want to trade extremes in ranges and pullbacks in trends.
When the KAMA is flat, a range is in place, so traders may want to wait for the price to reach an extreme before opening a trade in the other direction.
Conversely, if the KAMA is moving up or down, a trend is in place and traders may want to wait for the price to pull back to the KAMA before opening a trade in the direction of the trend.
🔹 Anchor Period
On the above chart, we can see different anchor periods on different chart timeframes.
This option is very useful for those traders who use multi-timeframe analysis, allowing them to see how the market behaves over different timeframes.
The valid values for this parameter are:
Hourly
Daily
Weekly
Monthly
Yearly
The tool has a built-in Auto feature for traders convenience, it automatically selects the optimal Anchor Period in function of the chart timeframe.
timeframes up to 2m: Hourly
timeframes up to 15m: Daily
timeframes up to 1H: Weekly
timeframes up to 4H: Monthly
larger timeframes: Yearly
🔹 Choosing the Right Anchor Period
In the chart above we can see the custom error message that the tool displays when the Auto feature is disabled and the Anchor Period is too large for the current chart timeframe.
Traders can select a smaller Anchor Period or a larger chart timeframe for the tool to display correctly.
🔶 DETAILS
The tool uses Welford's algorithm to calculate the KAMA's standard deviation, then plots the outer bands at the multiplier specified in the settings panel, and the inner bands at the multiplier specified minus 1.
🔹 Power Exponent
The graph above shows how different values of this parameter can affect the output.
To display the original KAMA a value of 1 must be set, by default this parameter is set to 2.
The higher the value, the better the tool's ability to detect ranges.
🔶 SETTINGS
Anchor Period: Select up to 5 different time periods from Hourly, Daily, Weekly, Monthly, and Yearly.
Source: Choose the source for all calculations.
Power Exponent: Fine-tune the KAMA calculation, a value of 1 will output the original KAMA, and is set to 2 by default.
Band Multiplier: Select the multiplier for the standard deviation bands.

Bitcoin Log Growth Curve OscillatorThis script presents the oscillator version of the Bitcoin Logarithmic Growth Curve 2024 indicator, offering a new perspective on Bitcoin’s long-term price trajectory.
By transforming the original logarithmic growth curve into an oscillator, this version provides a normalized view of price movements within a fixed range, making it easier to identify overbought and oversold conditions.
For a comprehensive explanation of the mathematical derivation, underlying concepts, and overall development of the Bitcoin Logarithmic Growth Curve, we encourage you to explore our primary script, Bitcoin Logarithmic Growth Curve 2024, available here . This foundational script details the regression-based approach used to model Bitcoin’s long-term price evolution.
Normalization Process
The core principle behind this oscillator lies in the normalization of Bitcoin’s price relative to the upper and lower regression boundaries. By applying Min-Max Normalization, we effectively scale the price into a bounded range, facilitating clearer trend analysis. The normalization follows the formula:
normalized price = (upper regresionline − lower regressionline) / (price − lower regressionline)
This transformation ensures that price movements are always mapped within a fixed range, preventing distortions caused by Bitcoin’s exponential long-term growth. Furthermore, this normalization technique has been applied to each of the confidence interval lines, allowing for a structured and systematic approach to analyzing Bitcoin’s historical and projected price behavior.
By representing the logarithmic growth curve in oscillator form, this indicator helps traders and analysts more effectively gauge Bitcoin’s position within its long-term growth trajectory while identifying potential opportunities based on historical price tendencies.

[COG]StochRSI Zenith📊 StochRSI Zenith
This indicator combines the traditional Stochastic RSI with enhanced visualization features and multi-timeframe analysis capabilities. It's designed to provide traders with a comprehensive view of market conditions through various technical components.
🔑 Key Features:
• Advanced StochRSI Implementation
- Customizable RSI and Stochastic calculation periods
- Multiple moving average type options (SMA, EMA, SMMA, LWMA)
- Adjustable signal line parameters
• Visual Enhancement System
- Dynamic wave effect visualization
- Energy field display for momentum visualization
- Customizable color schemes for bullish and bearish signals
- Adaptive transparency settings
• Multi-Timeframe Analysis
- Higher timeframe confirmation
- Synchronized market structure analysis
- Cross-timeframe signal validation
• Divergence Detection
- Automated bullish and bearish divergence identification
- Customizable lookback period
- Clear visual signals for confirmed divergences
• Signal Generation Framework
- Price action confirmation
- SMA-based trend filtering
- Multiple confirmation levels for reduced noise
- Clear entry signals with customizable display options
📈 Technical Components:
1. Core Oscillator
- Base calculation: 13-period RSI (adjustable)
- Stochastic calculation: 8-period (adjustable)
- Signal lines: 5,3 smoothing (adjustable)
2. Visual Systems
- Wave effect with three layers of visualization
- Energy field display with dynamic intensity
- Reference bands at 20/30/50/70/80 levels
3. Confirmation Mechanisms
- SMA trend filter
- Higher timeframe alignment
- Price action validation
- Divergence confirmation
⚙️ Customization Options:
• Visual Parameters
- Wave effect intensity and speed
- Energy field sensitivity
- Color schemes for bullish/bearish signals
- Signal display preferences
• Technical Parameters
- All core calculation periods
- Moving average types
- Divergence detection settings
- Signal confirmation criteria
• Display Settings
- Chart and indicator signal placement
- SMA line visualization
- Background highlighting options
- Label positioning and size
🔍 Technical Implementation:
The indicator combines several advanced techniques to generate signals. Here are key components with code examples:
1. Core StochRSI Calculation:
// Base RSI calculation
rsi = ta.rsi(close, rsi_length)
// StochRSI transformation
stochRSI = ((ta.highest(rsi, stoch_length) - ta.lowest(rsi, stoch_length)) != 0) ?
(100 * (rsi - ta.lowest(rsi, stoch_length))) /
(ta.highest(rsi, stoch_length) - ta.lowest(rsi, stoch_length)) : 0
2. Signal Generation System:
// Core signal conditions
crossover_buy = crossOver(sk, sd, cross_threshold)
valid_buy_zone = sk < 30 and sd < 30
price_within_sma_bands = close <= sma_high and close >= sma_low
// Enhanced signal generation
if crossover_buy and valid_buy_zone and price_within_sma_bands and htf_allows_long
if is_bullish_candle
long_signal := true
else
awaiting_bull_confirmation := true
3. Multi-Timeframe Analysis:
= request.security(syminfo.tickerid, mtf_period,
)
The HTF filter looks at a higher timeframe (default: 4H) to confirm the trend
It only allows:
Long trades when the higher timeframe is bullish
Short trades when the higher timeframe is bearish
📈 Trading Application Guide:
1. Signal Identification
• Oversold Opportunities (< 30 level)
- Look for bullish crosses of K-line above D-line
- Confirm with higher timeframe alignment
- Wait for price action confirmation (bullish candle)
• Overbought Conditions (> 70 level)
- Watch for bearish crosses of K-line below D-line
- Verify higher timeframe condition
- Confirm with bearish price action
2. Divergence Trading
• Bullish Divergence
- Price makes lower lows while indicator makes higher lows
- Most effective when occurring in oversold territory
- Use with support levels for entry timing
• Bearish Divergence
- Price makes higher highs while indicator shows lower highs
- Most reliable in overbought conditions
- Combine with resistance levels
3. Wave Effect Analysis
• Strong Waves
- Multiple wave lines moving in same direction indicate momentum
- Wider wave spread suggests increased volatility
- Use for trend strength confirmation
• Energy Field
- Higher intensity in trading zones suggests stronger moves
- Use for momentum confirmation
- Watch for energy field convergence with price action
The energy field is like a heat map that shows momentum strength
It gets stronger (more visible) when:
Price is in oversold (<30) or overbought (>70) zones
The indicator lines are moving apart quickly
A strong signal is forming
Think of it as a "strength meter" - the more visible the energy field, the stronger the potential move
4. Risk Management Integration
• Entry Confirmation
- Wait for all signal components to align
- Use higher timeframe for trend direction
- Confirm with price action and SMA positions
• Stop Loss Placement
- Consider placing stops beyond recent swing points
- Use ATR for dynamic stop calculation
- Account for market volatility
5. Position Management
• Partial Profit Taking
- Consider scaling out at overbought/oversold levels
- Use wave effect intensity for exit timing
- Monitor energy field for momentum shifts
• Trade Duration
- Short-term: Use primary signals in trading zones
- Swing trades: Focus on divergence signals
- Position trades: Utilize higher timeframe signals
⚠️ Important Usage Notes:
• Avoid:
- Trading against strong trends
- Relying solely on single signals
- Ignoring higher timeframe context
- Over-leveraging based on signals
Remember: This tool is designed to assist in analysis but should never be used as the sole decision-maker for trades. Always maintain proper risk management and combine with other forms of analysis.

MTF Signal XpertMTF Signal Xpert – Detailed Description
Overview:
MTF Signal Xpert is a proprietary, open‑source trading signal indicator that fuses multiple technical analysis methods into one cohesive strategy. Developed after rigorous backtesting and extensive research, this advanced tool is designed to deliver clear BUY and SELL signals by analyzing trend, momentum, and volatility across various timeframes. Its integrated approach not only enhances signal reliability but also incorporates dynamic risk management, helping traders protect their capital while navigating complex market conditions.
Detailed Explanation of How It Works:
Trend Detection via Moving Averages
Dual Moving Averages:
MTF Signal Xpert computes two moving averages—a fast MA and a slow MA—with the flexibility to choose from Simple (SMA), Exponential (EMA), or Hull (HMA) methods. This dual-MA system helps identify the prevailing market trend by contrasting short-term momentum with longer-term trends.
Crossover Logic:
A BUY signal is initiated when the fast MA crosses above the slow MA, coupled with the condition that the current price is above the lower Bollinger Band. This suggests that the market may be emerging from a lower price region. Conversely, a SELL signal is generated when the fast MA crosses below the slow MA and the price is below the upper Bollinger Band, indicating potential bearish pressure.
Recent Crossover Confirmation:
To ensure that signals reflect current market dynamics, the script tracks the number of bars since the moving average crossover event. Only crossovers that occur within a user-defined “candle confirmation” period are considered, which helps filter out outdated signals and improves overall signal accuracy.
Volatility and Price Extremes with Bollinger Bands
Calculation of Bands:
Bollinger Bands are calculated using a 20‑period simple moving average as the central basis, with the upper and lower bands derived from a standard deviation multiplier. This creates dynamic boundaries that adjust according to recent market volatility.
Signal Reinforcement:
For BUY signals, the condition that the price is above the lower Bollinger Band suggests an undervalued market condition, while for SELL signals, the price falling below the upper Bollinger Band reinforces the bearish bias. This volatility context adds depth to the moving average crossover signals.
Momentum Confirmation Using Multiple Oscillators
RSI (Relative Strength Index):
The RSI is computed over 14 periods to determine if the market is in an overbought or oversold state. Only readings within an optimal range (defined by user inputs) validate the signal, ensuring that entries are made during balanced conditions.
MACD (Moving Average Convergence Divergence):
The MACD line is compared with its signal line to assess momentum. A bullish scenario is confirmed when the MACD line is above the signal line, while a bearish scenario is indicated when it is below, thus adding another layer of confirmation.
Awesome Oscillator (AO):
The AO measures the difference between short-term and long-term simple moving averages of the median price. Positive AO values support BUY signals, while negative values back SELL signals, offering additional momentum insight.
ADX (Average Directional Index):
The ADX quantifies trend strength. MTF Signal Xpert only considers signals when the ADX value exceeds a specified threshold, ensuring that trades are taken in strongly trending markets.
Optional Stochastic Oscillator:
An optional stochastic oscillator filter can be enabled to further refine signals. It checks for overbought conditions (supporting SELL signals) or oversold conditions (supporting BUY signals), thus reducing ambiguity.
Multi-Timeframe Verification
Higher Timeframe Filter:
To align short-term signals with broader market trends, the script calculates an EMA on a higher timeframe as specified by the user. This multi-timeframe approach helps ensure that signals on the primary chart are consistent with the overall trend, thereby reducing false signals.
Dynamic Risk Management with ATR
ATR-Based Calculations:
The Average True Range (ATR) is used to measure current market volatility. This value is multiplied by a user-defined factor to dynamically determine stop loss (SL) and take profit (TP) levels, adapting to changing market conditions.
Visual SL/TP Markers:
The calculated SL and TP levels are plotted on the chart as distinct colored dots, enabling traders to quickly identify recommended exit points.
Optional Trailing Stop:
An optional trailing stop feature is available, which adjusts the stop loss as the trade moves favorably, helping to lock in profits while protecting against sudden reversals.
Risk/Reward Ratio Calculation:
MTF Signal Xpert computes a risk/reward ratio based on the dynamic SL and TP levels. This quantitative measure allows traders to assess whether the potential reward justifies the risk associated with a trade.
Condition Weighting and Signal Scoring
Binary Condition Checks:
Each technical condition—ranging from moving average crossovers, Bollinger Band positioning, and RSI range to MACD, AO, ADX, and volume filters—is assigned a binary score (1 if met, 0 if not).
Cumulative Scoring:
These individual scores are summed to generate cumulative bullish and bearish scores, quantifying the overall strength of the signal and providing traders with an objective measure of its viability.
Detailed Signal Explanation:
A comprehensive explanation string is generated, outlining which conditions contributed to the current BUY or SELL signal. This explanation is displayed on an on‑chart dashboard, offering transparency and clarity into the signal generation process.
On-Chart Visualizations and Debug Information
Chart Elements:
The indicator plots all key components—moving averages, Bollinger Bands, SL and TP markers—directly on the chart, providing a clear visual framework for understanding market conditions.
Combined Dashboard:
A dedicated dashboard displays key metrics such as RSI, ADX, and the bullish/bearish scores, alongside a detailed explanation of the current signal. This consolidated view allows traders to quickly grasp the underlying logic.
Debug Table (Optional):
For advanced users, an optional debug table is available. This table breaks down each individual condition, indicating which criteria were met or not met, thus aiding in further analysis and strategy refinement.
Mashup Justification and Originality
MTF Signal Xpert is more than just an aggregation of existing indicators—it is an original synthesis designed to address real-world trading complexities. Here’s how its components work together:
Integrated Trend, Volatility, and Momentum Analysis:
By combining moving averages, Bollinger Bands, and multiple oscillators (RSI, MACD, AO, ADX, and an optional stochastic), the indicator captures diverse market dynamics. Each component reinforces the others, reducing noise and filtering out false signals.
Multi-Timeframe Analysis:
The inclusion of a higher timeframe filter aligns short-term signals with longer-term trends, enhancing overall reliability and reducing the potential for contradictory signals.
Adaptive Risk Management:
Dynamic stop loss and take profit levels, determined using ATR, ensure that the risk management strategy adapts to current market conditions. The optional trailing stop further refines this approach, protecting profits as the market evolves.
Quantitative Signal Scoring:
The condition weighting system provides an objective measure of signal strength, giving traders clear insight into how each technical component contributes to the final decision.
How to Use MTF Signal Xpert:
Input Customization:
Adjust the moving average type and period settings, ATR multipliers, and oscillator thresholds to align with your trading style and the specific market conditions.
Enable or disable the optional stochastic oscillator and trailing stop based on your preference.
Interpreting the Signals:
When a BUY or SELL signal appears, refer to the on‑chart dashboard, which displays key metrics (e.g., RSI, ADX, bullish/bearish scores) along with a detailed breakdown of the conditions that triggered the signal.
Review the SL and TP markers on the chart to understand the associated risk/reward setup.
Risk Management:
Use the dynamically calculated stop loss and take profit levels as guidelines for setting your exit points.
Evaluate the provided risk/reward ratio to ensure that the potential reward justifies the risk before entering a trade.
Debugging and Verification:
Advanced users can enable the debug table to see a condition-by-condition breakdown of the signal generation process, helping refine the strategy and deepen understanding of market dynamics.
Disclaimer:
MTF Signal Xpert is intended for educational and analytical purposes only. Although it is based on robust technical analysis methods and has undergone extensive backtesting, past performance is not indicative of future results. Traders should employ proper risk management and adjust the settings to suit their financial circumstances and risk tolerance.
MTF Signal Xpert represents a comprehensive, original approach to trading signal generation. By blending trend detection, volatility assessment, momentum analysis, multi-timeframe alignment, and adaptive risk management into one integrated system, it provides traders with actionable signals and the transparency needed to understand the logic behind them.

VWAP Bands with ML [CryptoSea]VWAP Machine Learning Bands is an advanced indicator designed to enhance trading analysis by integrating VWAP with a machine learning-inspired adaptive smoothing approach. This tool helps traders identify trend-based support and resistance zones, predict potential price movements, and generate dynamic trade signals.
Key Features
Adaptive ML VWAP Calculation: Uses a dynamically adjusted SMA-based VWAP model with volatility sensitivity for improved trend analysis.
Forecasting Mechanism: The 'Forecast' parameter shifts the ML output forward, providing predictive insights into potential price movements.
Volatility-Based Band Adjustments: The 'Sigma' parameter fine-tunes the impact of volatility on ML smoothing, adapting to market conditions.
Multi-Tier Standard Deviation Bands: Includes two levels of bands to define potential breakout or mean-reversion zones.
Dynamic Trend-Based Colouring: The VWAP and ML lines change colour based on their relative positions, visually indicating bullish and bearish conditions.
Custom Signal Detection Modes: Allows traders to choose between signals from Band 1, Band 2, or both, for more tailored trade setups.
In the image below, you can see an example of the bands on higher timeframe showing good mean reversion signal opportunities, these tend to work better in ranging markets rather than strong trending ones.
How It Works
VWAP & ML Integration: The script computes VWAP and applies a machine learning-inspired adjustment using SMA smoothing and volatility-based adaptation.
Forecasting Impact: The 'Forecast' setting shifts the ML output forward in time, allowing for anticipatory trend analysis.
Volatility Scaling (Sigma): Adjusts the ML smoothing sensitivity based on market volatility, providing more responsive or stable trend lines.
Trend Confirmation via Colouring: The VWAP line dynamically switches colour depending on whether it is above or below the ML output.
Multi-Level Band Analysis: Two standard deviation-based bands provide a framework for identifying breakouts, trend reversals, or continuation patterns.
In the example below, we can see some of the most reliable signals where we have mean reversion signals from the band whilst the price is also pulling back into the VWAP, these signals have the additional confluence which can give you a higher probabilty move.
Alerts
Bullish Signal Band 1: Alerts when the price crosses above the lower ML Band 1.
Bearish Signal Band 1: Alerts when the price crosses below the upper ML Band 1.
Bullish Signal Band 2: Alerts when the price crosses above the lower ML Band 2.
Bearish Signal Band 2: Alerts when the price crosses below the upper ML Band 2.
Filtered Bullish Signal: Alerts when a bullish signal is triggered based on the selected signal detection mode.
Filtered Bearish Signal: Alerts when a bearish signal is triggered based on the selected signal detection mode.
Application
Trend & Momentum Analysis: Helps traders identify key market trends and potential momentum shifts.
Dynamic Support & Resistance: Standard deviation bands serve as adaptive price zones for potential breakouts or reversals.
Enhanced Trade Signal Confirmation: The integration of ML smoothing with VWAP provides clearer entry and exit signals.
Customizable Risk Management: Allows users to adjust parameters for fine-tuned signal detection, aligning with their trading strategy.
The VWAP Machine Learning Bands indicator offers traders an innovative tool to improve market entries, recognize potential reversals, and enhance trend analysis with intelligent data-driven signals.

Machine Learning Moving Average [LuxAlgo]The Machine Learning Moving Average (MLMA) is a responsive moving average making use of the weighting function obtained Gaussian Process Regression method. Characteristic such as responsiveness and smoothness can be adjusted by the user from the settings.
The moving average also includes bands, used to highlight possible reversals.
🔶 USAGE
The Machine Learning Moving Average smooths out noisy variations from the price, directly estimating the underlying trend in the price.
A higher "Window" setting will return a longer-term moving average while increasing the "Forecast" setting will affect the responsiveness and smoothness of the moving average, with higher positive values returning a more responsive moving average and negative values returning a smoother but less responsive moving average.
Do note that an excessively high "Forecast" setting will result in overshoots, with the moving average having a poor fit with the price.
The moving average color is determined according to the estimated trend direction based on the bands described below, shifting to blue (default) in an uptrend and fushia (default) in downtrends.
The upper and lower extremities represent the range within which price movements likely fluctuate.
Signals are generated when the price crosses above or below the band extremities, with turning points being highlighted by colored circles on the chart.
🔶 SETTINGS
Window: Calculation period of the moving average. Higher values yield a smoother average, emphasizing long-term trends and filtering out short-term fluctuations.
Forecast: Sets the projection horizon for Gaussian Process Regression. Higher values create a more responsive moving average but will result in more overshoots, potentially worsening the fit with the price. Negative values will result in a smoother moving average.
Sigma: Controls the standard deviation of the Gaussian kernel, influencing weight distribution. Higher Sigma values return a longer-term moving average.
Multiplicative Factor: Adjusts the upper and lower extremity bounds, with higher values widening the bands and lowering the amount of returned turning points.
🔶 RELATED SCRIPTS
Machine-Learning-Gaussian-Process-Regression
SuperTrend-AI-Clustering

Trendilo ARTrendilo AR is a custom trading indicator designed to identify market trends using advanced techniques such as the Arnaud Legoux Moving Average (ALMA), volume confirmations, and dynamic volatility bands. This indicator provides a clear visualization of trends, including significant changes and custom alerts.
Review of Indicators Used
1. ALMA
Description:
ALMA is a moving average that applies an advanced filter to smooth price data, reducing noise and focusing on actual trends.
Usage in the Indicator:
Used to calculate the smoothed percentage price change and determine trend direction. Customizable parameters include:
- Length: Defines the number of bars to consider.
- Offset: Adjusts sensitivity toward recent prices.
- Sigma: Controls the degree of smoothing.
Advantages:
- Reduced lag in trend detection.
- Resistance to market noise.
2. ATR
Description:
ATR measures the market’s average volatility by considering the range between high and low prices over a given period.
Usage in the Indicator:
ATR is used to calculate "dynamic smoothing", adjusting the indicator’s sensitivity based on current market volatility.
Advantages:
- Adapts to high or low volatility conditions.
- Helps define dynamic support and resistance levels.
3. SMA
Description:
SMA calculates the average of prices or volume over a specific time period.
Usage in the Indicator:
Used to calculate the volume moving average (Volume SMA) to confirm whether the current volume supports the detected trend.
Advantages:
- Easy to understand and calculate.
- Provides volume-based trend confirmation.
4. RMS Bands
Description:
RMS Bands calculate the standard deviation of percentage price changes, creating upper and lower levels that act as overbought and oversold indicators.
Usage in the Indicator:
- Define the range within which the market is considered neutral.
- Crosses above or below the bands indicate trend changes.
Advantages:
- Visual identification of strong trends.
- Helps filter false signals.
Colors and Visuals Used in the Indicator
1. ALMA Line
Colors:
- Green: Indicates a confirmed uptrend (with sufficient volume).
- Red: Indicates a confirmed downtrend (with sufficient volume).
- Gray: Indicates a neutral phase or insufficient volume to confirm a trend.
2. RMS Bands
- Upper and Lower Lines:
- Purple (with transparency): These lines represent the RMS bands (upper and lower) and
adjust opacity based on trend strength.
- Stronger trends result in less transparency (more solid colors).
3. Highlighted Background (Strong Trends)
- Color:
- Light Green (transparent): Highlights a strong trend when the smoothed percentage change (ALMA) exceeds 1.5 times the RMS.
4. Horizontal Lines
- Baseline (0):
- Dark Gray: Serves as a central reference to identify the directionality of percentage changes.
- Additional Line (0.1):
- Blue: A customizable line to mark user-defined key levels.
5. Bar Colors
- Bar Colors:
- Green: When the price is in a confirmed uptrend.
- Red: When the price is in a confirmed downtrend.
- No color: When there is insufficient volume or no clear trend.
How to Use the Indicator
1. Initial Setup
1. Add the Indicator to Your Chart: Copy the code into the Pine Editor on TradingView and apply it to your chart.
2. Customize Parameters: Adjust values based on your trading strategy:
- Smoothing: Controls the level of smoothing for percentage changes.
- Lookback Length: Defines the observation period for calculations.
- Band Multiplier: Adjusts the width of RMS bands.
2. Signal Interpretation
1. Indicator Colors:
- Green: Confirmed uptrend.
- Red: Confirmed downtrend.
- Gray: No clear trend or insufficient volume.
2. RMS Bands:
- If the ALMA line (smoothed percentage change) crosses above the upper RMS band, it signals a potential uptrend.
- If it crosses below the lower RMS band, it signals a potential downtrend.
3. Volume Confirmation:
- The indicator's color activates only if the current volume exceeds the Volume SMA.
3. Alerts and Decisions
1. Trend Change Alerts:
- The indicator automatically triggers alerts when an uptrend or downtrend is detected.
- Configure these alerts to receive real-time notifications.
2. Strong Trend Signals:
- When the magnitude of the percentage change exceeds 1.5 times the RMS, the chart background highlights the strong trend.
4. Trading Strategies
1. Buy:
- Enter long positions when:
- The indicator turns green.
- Volume confirms the trend.
- Consider placing a stop-loss just below the lower RMS band.
2. Sell:
- Enter short positions when:
- The indicator turns red.
- Volume confirms the trend.
- Consider placing a stop-loss just above the upper RMS band.
3. Neutral:
- Avoid trading when the indicator is gray, as no clear trend or insufficient volume is present.
Disclaimer: As this is my first published indicator, please use it with caution. Feedback is highly appreciated to improve its performance.
Happy Trading!
