BD Momentum ChannelIntroducing the BD Momentum Channel, a new indicator that helps traders identify market trends and momentum through a combination of upper and lower channels, as well as fast and slow moving averages. The BD Momentum Channel can be used in standalone mode or in combination with other technical analysis tools to enhance trading strategies. We recommend using it in combination with the Wave Master indicator.
To use the indicator, simply input the desired length for the upper and lower channels, as well as the smoothing periods for the fast and slow moving averages or use the provided defaults. The Bull and Bear Levels can be set to the desired values, while the Extreme Bull and Extreme Bear Levels can be used to signal significant market movements.
The BD Momentum Channel works by calculating the highest and lowest prices over a specified period, and then finding the average of these two values, which is used as the basis for the upper and lower channels. The width of the channel is calculated as the difference between the upper and lower channels, while the position of the current price in relation to the upper and lower channels is used to determine the percentage change and which half of the channel the price is in.
The fast and slow moving averages are then calculated using a simple moving average function, and plotted as histograms on the chart. The Bull and Bear Levels are also plotted on the chart as horizontal lines, providing a quick reference for market direction.
The BD Momentum Channel also includes a range of color-coded signals, including extreme bull and bear levels, and cross-under and cross-over signals that can be used to confirm trends and changes in market momentum.
Overall, the BD Momentum Channel is a powerful tool for traders looking to identify market trends and momentum, and can be easily customized to suit individual trading strategies.
Bands
Ignition Band Angles are Bollinger Bands with numeric angleI developed Bollinger Bands that provide a numeric value indicating their strength. To achieve this, I used the degree of the angle of attack and color-coded the numbers. The top band displays the number in the upper corner of the chart, the bottom band in the bottom corner, and the Basis is in the left middle. These numbers quantify the slope of the bands, which can be difficult to discern on a chart because stretching out the x and y axis can flatten or exaggerate a slope. With my Bollinger Bands, you get a constant reading that provides an accurate measurement of the angle and strength of a trend. I hope this helps.

[TTI] Minervini Envelopes––––History & Credit
This is an indicator that I saw Mark Minervini using. Picture attached to the Session he showed it.
–––––What it does
The indicator is a Envelopes band. Envelopes represent bands that are plotted in a certain, identical relationship above and below the Moving Average. Envelopes are a very complex theme with many interpretation and trading rules. Basically, envelopes capture a significant part of price movements. Concrete trading signals are released if prices approach or move away form their envelope.
Envelopes are plotted around a Moving Average in a constant percentage distance. Hence they are added to or subtracted from this average. Both envelope lines thus define the prevailing trading range.
–––––How to use it
While several different trading rules are available, the most simple approach uses the price band as an entry and exit point. When price penetrates the upper price band, you initiate a long position or buy. If you have an existing short position, you close out shorts and go long. Conversely, when prices penetrate the lower price band, you close out long positions and go short.
–––––How to Mark Minervini uses it
He applies it to the SPY ONLY and ONLY on WEEKLY! When the price action is above the Envelope then he is in his long term portfolio (he disclaimed it is only a small portfolio for his daugther!)

Fibonacci Volatility BandsFibonacci Volatility Bands are just an alternative that allows for more margin than regular Bollinger Bands. They are created based on an average of moving averages that use the Fibonacci sequence as lookback periods.
The use of the Fibonacci Volatility Bands is exactly the same as the Bollinger Bands.

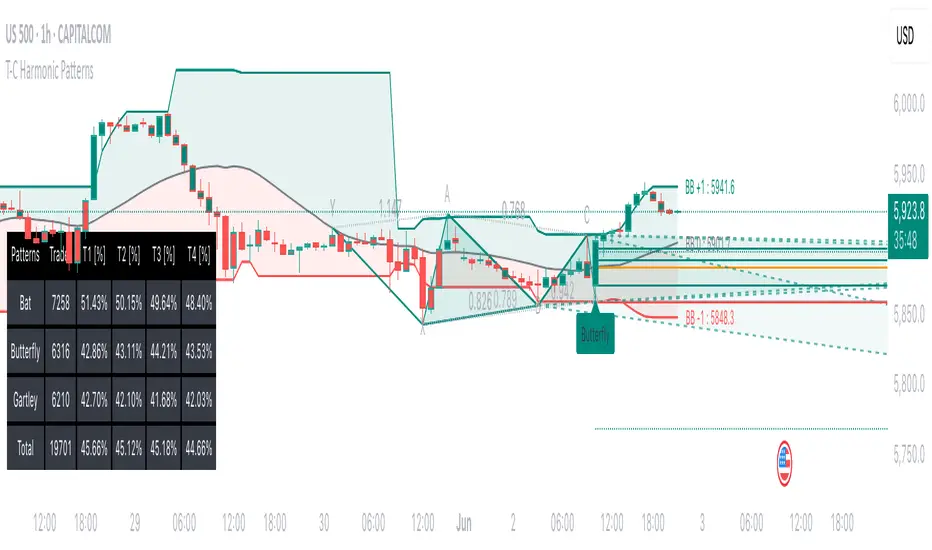
Tailored-Custom Hamonic Patterns█ OVERVIEW
We have included by default 3 known Patterns. The Bat, the Butterfly and the Gartley. But have you ever wondered how effective other,
not yet known models could be? Don't ask yourself the question anymore, it's time to find out for yourself! You have the option to customize
your own Patterns with the Backtesting tool and set Retracement Ratios and Targets for your own Patterns. In addition to this, in order to determine
the Trend at a glance and make Pattern detection more efficient, we have linked the calculation of Patterns to Bands of several types to choose
from (Bollinger, Keltner, Donchian) that you can select from a drop-down menu in the settings and play with the Multiplier
and the Adaptive Length of the Patterns to see how it affects the success rate in the Backtesting table.
█ HOW DOES IT WORK?
- Harmonic Patterns
-Pattern Names, Colors, Style etc… Everything is customizable.
-Dynamic Adaptative Length with Min/Max Length.
- XAB/ABC Ratio
-Min/Max XAB/ABC Configurable Ratio for each Pattern to create your own Patterns.
(This is really the particular option of this Indicator, because it allows you to be able to Backtest in real time
after having played at configuring your own Ratios)
- Bands
-Contrary to the original logic of the HeWhoMustNotBeNamed script, here when the price breaks out of the upper Bands
(example, Bollinger band, Keltner Channel or Donchian Channel) , with a predetermined Minimum and Maximum Length and Multiplier, we can consider
the Trend to be Bearish (and not Bullish) and similarly when the price breaks down in the lower band, we can consider the Trend
to be Bullish (not Bearish) . We have also added the middle line of the Channels (which can be useful for 'Scalper' type Traders.
-The Length of the Bands Filter is directly related to the Dynamic Length of the Patterns.
-You can use a drop-down menu to select from the following Bands Filters :
SMA, EMA, HMA, RMA, WMA, VWMA, HIGH/LOW, LINREG, MEDIAN.
-Sticky and Adaptive Bands options has been included.
- Projections
-BD/CD Projection Ratio configurable for each Pattern.
(Projections are visible as Dotted Lines which we can choose to Extend or not)
- Targets
-Target, PRZ and Stop Levels are set to optimal values based on individual Patterns. (The PRZ Level corresponds to point D
of the detected Pattern so its value should always be 0) but you can change the Targets value (defined in %) as you wish.
Again here, you have the option to fully configure the Style and Extend the Lines or not.
- Backtesting Table
-As said previously, with the possibility of testing the Success Rate of each of the 3 Customizable Patterns,
this option is part of the logic of this Indicator.
- Alerts
-We originally believe that this Indicator does not even need Alerts. But we still decided to include at least one Alert
that you can set for when a new Pattern is detected.
█ NOTES
Thanks to HeWhoMustNotBeNamed for his permission to reuse some part of his zigzag scripts.
Remember to only make a decision once you are sure of your analysis. Good trading sessions to everyone and don't forget,
risk management remains the most important!
Keltner Channels Bands (RMA)Keltner Channel Bands
These normally consist of:
Keltner Channel Upper Band = EMA + Multiplier ∗ ATR
Keltner Channel Lower Band = EMA − Multiplier ∗ ATR
However instead of using ATR we are using RMA
This gives us a much smoother take of the KCB
We are also using 2 sets of bands built on 1 Moving average, this is a common set up for mean reversion strategies.
This can often be paired with RSI for lower timeframe divergences
Divergence
This is using the RSI to calculate when price sets new lows/highs whilst the RSI movement is in the opposite direction.
The way this is calculated is slightly different to traditional divergence scripts. instead of looking for pivot highs/lows in the RSI we are logging the RSI value when price makes it pivot highs/lows.
Gradient Bands
The Gradient Colouring on the bands is measuring how long price has been either side of the MA.
As Keltner bands are commonly used as a mean reversion strategy, I thought it would be useful to see how long price has been trending in a certain direction, the stronger the colours get,
the longer price has been trending that direction which could suggest we are looking for a retrace soon.
Alerts
Alerts included let you choose whether you want to receive an alert for the inside, outside or both band touches.
To set up these alerts, simply toggle them on in the settings, then click on the 3 dots next to the indicators name, from there you click 'Add Alert'.
From there you can customise the alert settings but make sure to leave the 2 top boxes which control the alert conditions. They will be default selected onto your correct settings, the rest you may want to change.
Once you create the alert, it will then trigger as soon as price touches your chosen inside/outside band.
Suggestions
Please feel free to offer any suggestions which you think could improve the script
Disclaimer
The default settings/parameters were shared by Jimtalbott, feel free to play about with the and use this code to make your own strategies.

Faytterro Bandswhat is Faytterro Bands?
it is a channel indicator like "Bollinger Bands".
what it does?
creates a channel using standard deviations and means. thus giving users an idea about the expensive and cheap zones. It uses a special weighted moving average different from standard bollinger bands, it also averages not only price but also deviations.
how it does it?
it uses this formulas:
how to use it?
its usage is the same as "bollinger band".
length represents the number of candles to be taken into account, source represents the source of those candles and stdev represents the coefficient of the standard deviation.
you can use it with other indicators:

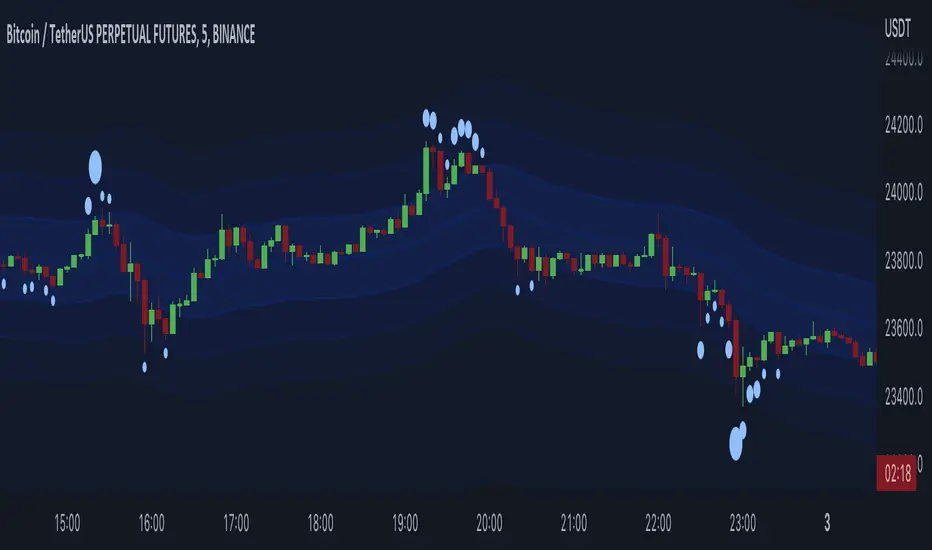
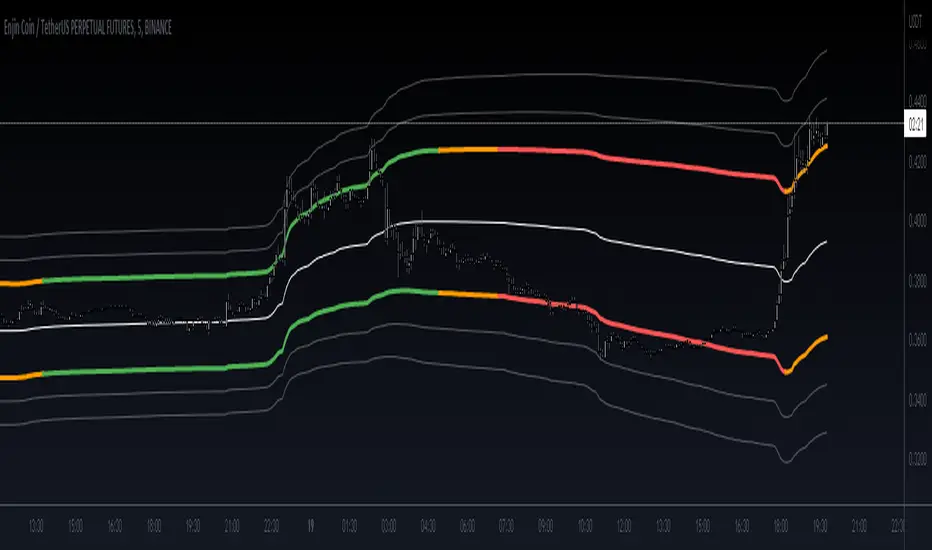
Liquidation Bands (+CVD Bubbles) - By LeviathanAlong with CVD bubbles, this script plots continuous bands that represent 100x, 75x, 50x, 25x liquidation levels. The bands can serve as support/resistance, reversal points, expected volatility range and more.
The indicator uses either the Exponential Moving Average (EMA) or the Volume Weighted Average Price (VWAP) as a base for plotting continuous lines and zones set at the approximate distance of 100x, 75x, 50x, 25x leverage liquidation prices.
These bands can help you visualize:
- Dynamic Support and Resistance levels
- Levels that the price will gravitate towards
- Expected price range (potential volatility)
- Reversal points
- ...
The "CVD Bubbles" part of this script plots circles that are based on my imitation of Cumulative Volume Delta (CVD).
CVD Bubbles will appear when buy/sell volume is increased. The larger the bubble, the more buying/selling at that candle.
"Buy Order" CVD Bubbles appear above candles and might signal:
- Late longers entering the market
- Large short liquidations (closed short=buy order)
- Large market buys getting absorbed by limit sell orders
=> Bias: potential reversal to the downside
"Sell Order" CVD Bubbles appear below candles and might signal:
- Late shorters entering the market
- Large long liquidations (closed long=sell order)
- Large market sells getting absorbed by limit buy orders
=> Bias: potential reversal to the upside
Combining Liquidation Bands and CVD Bubbles can serve you as confluence for taking a trade, but don't follow them blindly.
Settings:
"Mode" - Choose the base for Liquidation Bands (EMA or VWAP)
"EMA/CVD Length" - Choose the length (number of bars) for calculating EMA and CVD
"Level Calculation Mode" - Choose between 3 variations of calculating the distance to Liquidation Bands
"Standard Deviation Length" - Choose the length used for calculating the thresholds of CVD
"Appearance" - Choose the colors of lines, zones and CVD Bubbles
"STDEV MULT." - Multiply the thresholds used for CVD Bubble Sizes
Bollinger Bands [Anan]Hello friends,,
This is my own enhanced version of Bollinger Bands based on some backtesting,,
It's the same logic behind standard BB but instead of using length(period), I created a formula and used a "factor" to scale it up/down.
The formula is just average of averages of averages... (But it's backtested with good results)
I also added two standard deviations so that the distance between them will be the (over-bought/over-sold zones)
And finally added a squeeze indicator to identify the predicted price action movements..
You have the options to control everything like:
-Timeframe
-Source
-Calculation Method
-Length Factor
-StdDev#1
-StdDev#2
-Squeeze Factor
-Squeeze Threshold

LNL Keltner CandlesLNL Keltner Candles
This indicator plots mean reversion (reversal) arrows with custom painted candles based on the price touch or close above or below keltner channel limits (upper & lower bands). This study was created primarily for swing trading & higher time frames such as daily and weekly. Lower time frames might result in more false signals.
Mean Reversal Arrows:
1. Reversal Arrow Up - If the price drops below the lower band extremes, reversal up is the trigger for a bullish mean reversion.
2. Reversal Arrow Down - Once the price reach the higher band extremes, reversal down is the trigger for a bearish mean reversion.
The Concept of Mean Reversion:
There are just two types of moves in any market: The market is either expanding from the mean or retracing back to the mean. These reversions & epxansions are happening across all types of markets. The goal of this study is to catch the powerful mean reversion from extremes back to the mean. Once the candles light up green / red, it is time to look for the reversal (purple) arrow which triggers the mean reversion setup. Mean reversion is not about catching the next big swing turn to new highs or lows. It is all about the base hits = the mean. So the target here is always the average price. The idea here is to catch the average market ebbs & flows, not the next home run.
What Do I Mean by Mean?
Mean is usually the average price from the last 20-30 bars. Basically something like a 20 MA or Keltner Channel or Bollinger Band midline are really good visual representators of the mean (average price).
Hope it helps.

Fibonacci Breakout Target LevelsFibonacci Extension
Fibonacci Extension is a powerful technical analysis tool that traders use to predict where the market might find support and resistance. It is based on the Fibonacci sequence and uses levels that are found by extending the 23.6%, 38.2%, 50%, 61.8%, and 100% Fibonacci ratios from a swing high or low. These levels can be used to find possible areas of support and resistance, and traders often use them to figure out when to get into or get out of a trade.
What does this indicator do?
This indicator gets five levels of the Fibonacci Extension and uses it for both the low and the high. The default lookback period is 10 days, and it checks for the highest and lowest price in that period. Then it calculates the extension levels and plots them, and it also adds a line that shows you the current breakout target levels.
How to use?
The primary use intended for this indicator is to be used to determine possible breakout target levels. Let's say you are trading a range and a breakout happens. You can use this indicator to determine possible take-profit zones and possible support and resistance zones.
Features:
Change the lookback period for the Fibonacci Extension levels.
Disable the Fibonacci Bands if you just want to see the FIB levels.
You can also change the 5 levels and add different Fibonacci numbers.
In this image, you can see how you can use this indicator to determine take-profit levels. The Fibonacci Extensions will determine potential support and resistance levels, which could be good places to exit your long or short positions.

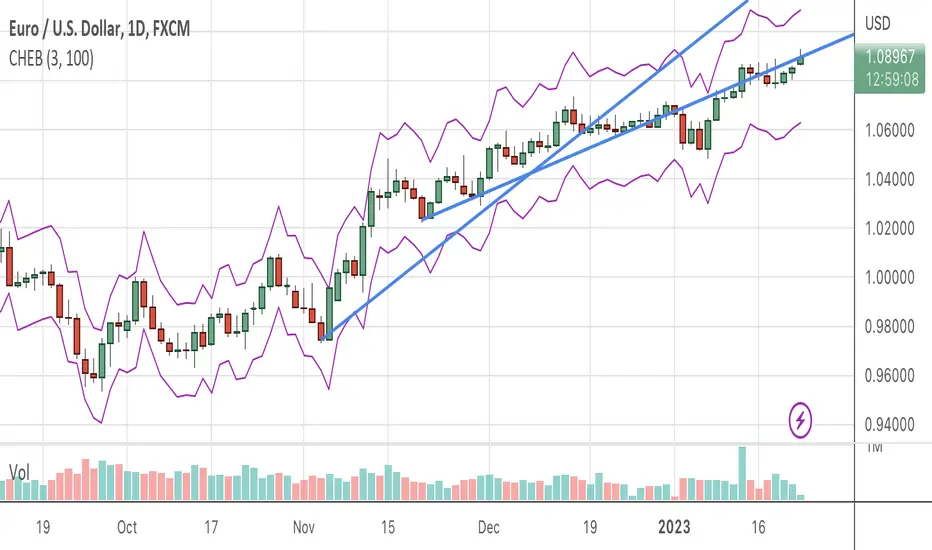
Chebyshevs BandsThis script calculates upper and lower bands using Chebyshev's inequality formula.
The main pros.: the band doesn't depend on particular distribution. It fits to any type of random variables. Also it allows to calculate bands for instruments with extremely high volatility.
Cons.: formula provides a rough estimation in some special cases like lognormal distribution.
Squeeze Range: Bollinger Bands / Keltner Channels [Whvntr]Presenting Squeeze Range: Bollinger Bands / Keltner Channels
TTMSqueeze method is a volatility and momentum indicator introduced by John Carter of Simpler Trading, which capitalizes on the tendency for price to break out strongly after consolidating in a tight trading range.
How did I make this indicator? The Bollinger Bands & Keltner Channels base scripts are from the standard indicators of their class in the Technicals section... I made this indicator first then noticed there were 3 others with a similar concept, but this differs in it's unique features and application of the TTMSqueeze strategy. This indicator plots the True Range of the Keltner Channel (Customizable in 'Bands Style" in the Inputs Menu) the instances the Bollinger Bands are within the range of the Keltner channel (the market just entered a squeeze).
Featuring: customizable Moving Averages
1. Exponential (Default for both BB & KC)
2. Simple
3. RMA (MA used in RSI )
Keltner channels have a multiplier of 2 & 3 on the Chart (3 being the outer).
How do I use this indicator? Once the teal dots are inside the solid red lines this would indicate that TTMperiod of low market volatility (the market is preparing itself for an explosive move up or down). Do some research and study how to use the TTMSqueeze method by John Carter. Disclaimer: not a guarantee of future favorable results.

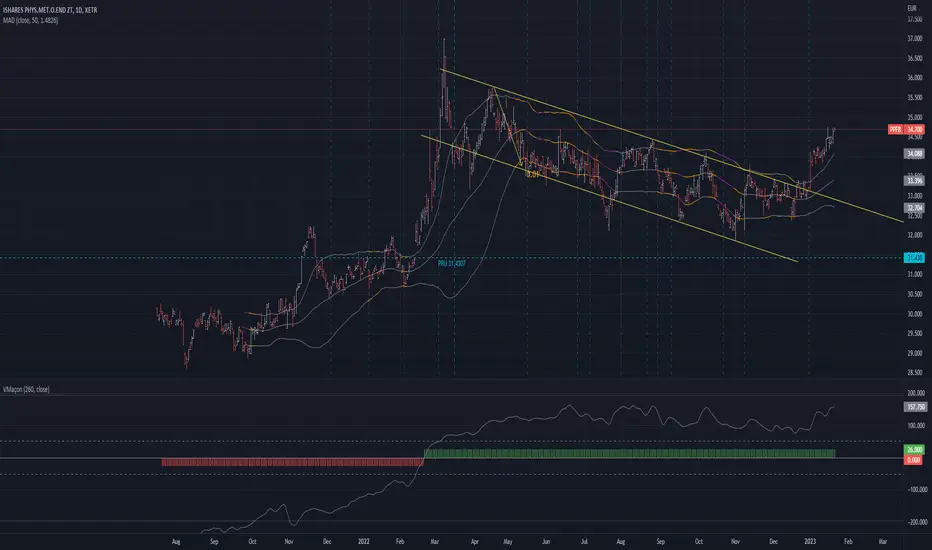
MAD - Mean Absolute Deviation purpose :implementation of MAD Mean Absolute Deviation in pinescript
implementation by : patmaba
type : measures of spread
Mean absolute deviation
The mean absolute deviation of a dataset is the average distance between each data point and the mean. It gives us an idea about the variability in a dataset.
Here's how to calculate the median absolute deviation.
Step 1: Calculate the mean.
Step 2: Calculate how far away each data point is from the mean using positive distances. These are called absolute deviations.
Step 3: Add those deviations together.
Step 4: Divide the sum by the number of data points.
Source of MAD:
www.khanacademy.org
Formula :
MAD = ( ∑ |xi−µ| ) / n
where
xi = the value of a data point
|xi − µ| = absolute deviation
µ = mean
n = sample size
Click VWAP Anchored with Standard Devation BandsSimply use it by clicking on your chart on the places you find important to determine whether you entries or exits look strong or weak.

Flying Dragon Trend IndicatorFlying Dragon Trend Indicator can be used to indicate the trend on all timeframes by finetuning the input settings.
The Flying Dragon Trend family includes both the strategy and the indicator, where the strategy supports of selecting the optimal set of inputs for the indicator in each scenario. Highly recommended to get familiar with the strategy first to get the best out of the indicator.
Flying Dragon Trend plots the trend bands into the ribbon, where the colours indicate the trend of each band. The plotting of the bands can be turned off in the input settings. Based on the user selectable Risk Level the trend pivot indicator is shown for the possible trend pivot when the price crosses the certain moving average line, or at the Lowest risk level all the bands have the same colour. The trend pivot indicator is not shown on the Lowest risk level, but the colour of the trend bands is the indicator instead .
The main idea is to combine two different moving averages to cross each other at the possible trend pivot point, but trying to avoid any short term bounces to affect the trend indication. The ingenuity resides in the combination of selected moving average types, lengths and especially the offsets. The trend bands give visual hint for the user while observing the price interaction with the bands, one could say that when "the Dragon swallows the candles the jaws wide open", then there is high possibility for the pivot. The leading moving average should be fast while the lagging moving average should be, well, lagging behind the leading one. There is Offset selections for each moving average, three for leading one and one for the lagging one, those are where the magic happens. After user has selected preferred moving average types and lengths, by tuning each offset the optimal sweet spot for each timeframe and equity will be found. The default values are good enough starting points for longer (4h and up) timeframes, but shorter timeframes (minutes to hours) require different combination of settings, some hints are provided in tooltips. Basically the slower the "leading" moving average (like HMA75 or HMA115) and quicker the "lagging" moving average (like SMA12 or SMA5) become, the better performance at the Lowest risk level on minute scales. This "reversed" approach at the minute scales is shown also as reversed colour for the "lagging" moving average trend band, which seems to make it work surprisingly well.
The Flying Dragon Trend does not necessarily work well on zig zag and range bounce scenarios without additional finetuning of the input settings to fit the current condition.

Flying Dragon Trend StrategyFlying Dragon Trend Strategy can be used to indicate the trend on all timeframes by finetuning the input settings.
The Flying Dragon Trend family includes both the strategy and the indicator, where the strategy supports of selecting the optimal set of inputs for the indicator in each scenario. Highly recommended to get familiar with the strategy first to get the best out of the indicator.
Flying Dragon Trend plots the trend bands into the ribbon, where the colours indicate the trend of each band. The plotting of the bands can be turned off in the input settings. Based on the user selectable Risk Level the strategy is executed when the price crosses the certain moving average line, or at the Lowest risk level all the bands have the same colour.
The main idea is to combine two different moving averages to cross each other at the possible trend pivot point, but trying to avoid any short term bounces to affect the trend indication. The ingenuity resides in the combination of selected moving average types, lengths and especially the offsets. The trend bands give visual hint for the user while observing the price interaction with the bands, one could say that when "the Dragon swallows the candles the jaws wide open", then there is high possibility for the pivot. The leading moving average should be fast while the lagging moving average should be, well, lagging behind the leading one. There is Offset selections for each moving average, three for leading one and one for the lagging one, those are where the magic happens. After user has selected preferred moving average types and lengths, by tuning each offset the optimal sweet spot for each timeframe and equity will be found. The default values are good enough starting points for longer (4h and up) timeframes, but shorter timeframes (minutes to hours) require different combination of settings, some hints are provided in tooltips. Basically the slower the "leading" moving average (like HMA75 or HMA115) and quicker the "lagging" moving average (like SMA12 or SMA5) become, the better performance at the Lowest risk level on minute scales. This "reversed" approach at the minute scales is shown also as reversed colour for the "lagging" moving average trend band, which seems to make it work surprisingly well.
The Flying Dragon Trend does not necessarily work well on zig zag and range bounce scenarios without additional finetuning of the input settings to fit the current condition.
Strategy direction selector by DashTrader.

Cuban's Reversion Bands V2Cuban's Reversion Bands V2
Cubans Reversion Bands, are a great indication of price overextension by using specified standard deviations, extended from a moving average basis line, the Volume Weighted Average Trend.
Reversion Bands V2 builds off the original foundation in a big way but utilizes completely new band logic and a more stable basis line, the stability leads to a more consistent band reversion zones.
The basis line is calculated with volatility metrics and long term range determinants.
The band extension points are then weighted on this basis line with the asset's average extensions taken into consideration to fit each asset individually.
Users gain the ability to customize:
EQ Sensitivity
Band Sensitivity
EQ sensitivity will control the reaction time of the basis line e.g. a comparison of the default 1, and below an increase EQ to 100:
1 EQ Sensitivity (Default)
100 EQ Sensitivity
Band Sensitivity will control the distance of deviation from the basis point, this can be used to fine tune the reversion location which could be useful in higher beta environments.
1 Band Sensitivity
100 Band Sensitivity
As a result of overextension we can take this as a means for a potential market shift, for example, in range bound conditions we expect the market to revert at the given reversion zones in the Cuban Reversion Bands V2.
Failure to revert at a band level, and extension above could signify a change in market structure and lead to a trending environment thus giving us the ability to determine a trending environment.
To Do:
alerts
implement additional confluence via other proprietary tools to increase the signal ratio
Trop BandsTrop Bands is a tool that uses an exponential moving average (EMA) as its central trendline and upper and lower bands to identify potential buying and selling opportunities in the market. The bands are calculated based on recent moves away from the EMA, and they are plotted around the central trendline to provide a visual representation of market trends and conditions. When the price moves outside of these bands, it can be seen as a signal that the security is overbought or oversold and may be ready for a reversal, just like Bollinger Bands.
In addition to providing signals when the price moves outside of the bands, the indicator can also show triangles outside/inside the bands. These triangles are based on the Demand Index developed by James Sibbet and are intended to provide additional confirmation of potential trading opportunities. They can be used in conjunction with other technical analysis tools to help identifying potential trading opportunities in the market.

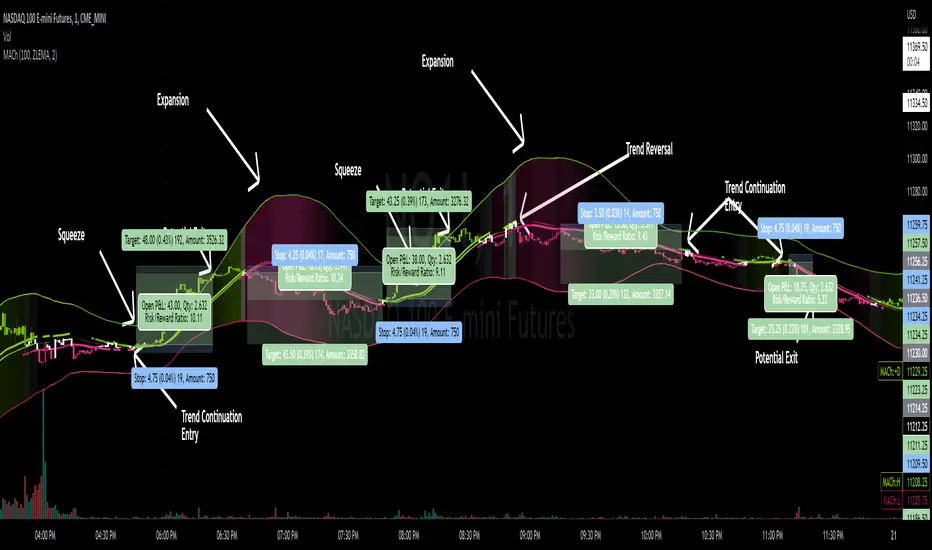
MA ChannelThis indicator creates a high and low channel of moving average type selected, it also can draw deviation bands based on the channel for a unique representation of squeezes.
Features
Moving average channel displays constant high and low price trend.
Center band displays color representative of trend direction constantly.
High price trend line disappears during downtrends, and low price trend line disappears during uptrends.
Deviation band display accurately reports squeezes between price and channel data.
Deviation band fill reports price range expansion as possible trend weakness.
Settings
Period adjusts historical price data to use for trend analysis.
Average Type adjusts the type of average calculation used in the trend plots.
Show Deviation Band toggles display of deviation bands and their fill.
Deviation Multiplier adjusts the deviation calculation, 2.0 is common.
Style adjustments include up/down trend strong/weak color customization (default theme supports color blindness).
Color Bar displays overall trend color on each bar.
Deviation Band Fill With Squeeze Measurement adjusts opacity to represent deviation band squeeze, when bands contract the colors disappear, when bands expand the colors reappear.
Usage
Trend Analysis
When price has broken above the channel then it's an uptrend, price below the channel is a downtrend.
Pay attention to when inverse trend line appears only momentarily, these could be excellent trend continuation entry areas.
Reversals
Reversal areas can be spotted where price breaks the channel central ribbon but doesn't close outside on the opposite end of previous trend.
Squeeze
Band fill squeeze mode aims to make it a simple task to see when a squeeze may be weakening, with the color trend brightening during periods of expansion, and disappearing during periods of contraction (squeezing).
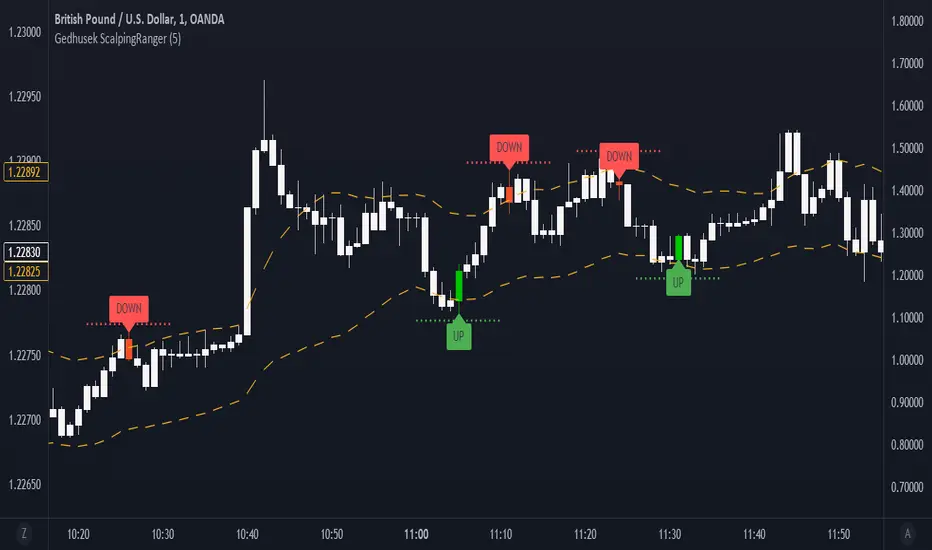
Gedhusek ScalpingRangerThis indicator was designed for finding good entries for scalping the market
How does it work:
- It works on a basis of price running out of its bands and its return
- Once the price is out of bands, the system starts scanning for two patterns --> sudden price reversion and losing of momentum.
- If any of these patterns occur, the indicator waits for a confirmation bar and after that it gives you a signal that the price could be moving upwards or downwards.
- These signals are represented by a label and sudden price change of the current bar
- Also you will see a dotted line above or below the bar that can be used as a potential Stop Loss level
Idea behind the trigger patterns:
Sudden price reversion
- Idea behind this pattern is that the price has a higher success of reversion if there is a fast change of its momentum. This pattern is recognized by measuring the divergence between prior and current price change
- The divergence is measured as correlation between shorter-term price action and longer-term price action. If the correlation is negative and statistically significant, it is counted as a reversion signal (= shorter-time price action goes in the opposite direction of longer-term price action)
Losing of momentum
- The idea behind this pattern is that once there is no strong momentum, there is lower probability of a breakout and start of strong trend
- It is calculated as a difference between current price and previous price. If the difference is minimal, it is taken as a signal that the price lost its momentum and therefore there is higher chance of reversion.
When to use:
- This indicator works well in ranging markets, but slightly less well in trending markets. Therefore look for sideways markets and use the indicator there
- Price action patterns work really well with this indicator, such as Support and Resistance levels, double Tops and Bottoms,...
Inputs:
- This indicator has only one input and that is "Analysis Period". This input declares how many bars and going to be used when finding the patterns of possible price reversion
Correlated ATR Bands | AdulariHow do I use it?
Never use this indicator as standalone trading signal, it should be used as confluence.
It is highly recommended to use this indicator on the 15m timeframe and above, try experimenting with the inverse feature and multipliers as well.
When the price is above the moving average this shows the bullish trend is strong.
When the price is below the moving average this shows the bearish trend is strong.
When the moving average is purple, the trend is bullish , when it is gray, the trend is bearish.
When price is above the upper band this may indicate a bearish reversal.
When price is below the lower band this may indicate a bullish reversal.
Features:
Purple line for bullish trend and gray line for bearish trend.
Custom formula combining an ATR and Hull MA to clearly indicate trend strength and direction.
Unique approach to moving averages and bands by taking the average of 2 types of MA's combined with custom ATR's, then multiplying these by correlation factors.
Bands to indicate possible trend reversals when price crosses them.
How does it work?
1 — ATR value is calculated, then the correlation between the source and ATR is calculated.
2 — Final value is calculated using the following formula:
correlation * atr + (1 - correlation) * nz(atr , atr)
3 — Moving average is calculated with the following formula:
ta.hma((1-(correlation/100*(1+weight/10)))*(ta.sma(source+value, smoothing)+ta.sma(source-value,smoothing))/2,flength)
4 — Bands calculation using multipliers.

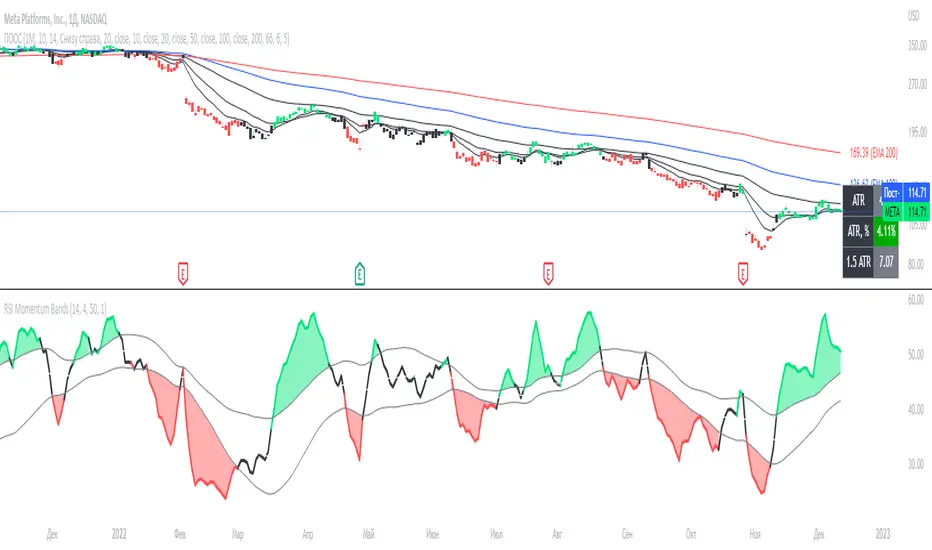
[EDU] RSI Momentum BandsRSI Momentum Bands serve a purpose to find best RSI momentum for entering a trade.
Indicator is built simply:
1st RSI MA is smoothed RSI by little period, 2nd RSI MA is smoothed RSI by a bigger period.
Then we calculate standard deviation from the 2nd MA and make upper and lower band.
The rules for trades are simple:
When RSI is above higher band - Buy ;
When RSI is below lower band - Sell .
The indicator is for educational purposes only to present trades a momentum bands concepts, widely used across professionals.
Hope you will find it helpful.
Take your profits!
- Tarasenko Fyodor