MACD Divergence Optimizer# MACD Divergence Optimizer - User Guide
## Overview
The **MACD Divergence Optimizer** is a professional-grade technical analysis indicator for TradingView that automatically detects hidden divergences on MACD with volume weighting. It identifies potential reversal points before price action confirms the move, giving traders an early edge.
---
## What is Divergence?
A **divergence** occurs when price and an oscillator (like MACD) move in opposite directions:
- **Bullish Divergence**: Price makes a lower low, but MACD makes a higher low → Potential uptrend reversal
- **Bearish Divergence**: Price makes a higher high, but MACD makes a lower high → Potential downtrend reversal
Divergences are among the most reliable reversal signals in technical analysis.
---
## Indicator Features
### Volume-Weighted MACD
- Standard MACD is calculated on closing price
- This indicator uses **volume-weighted closing prices** for greater accuracy
- Formula: MACD = (Volume-Weighted EMA₁₂ - Volume-Weighted EMA₂₆)
- Volume weighting gives more importance to high-conviction price moves
### Automatic Swing Detection
- Detects local highs and lows (5-bar lookback)
- Tracks the last 5 swings for divergence analysis
- Only meaningful swings are tracked (filtered for noise)
### Smart Signal Generation
- Green triangle (▲) = Bullish Divergence (BUY signal)
- Red triangle (▼) = Bearish Divergence (SELL signal)
- Triangles appear directly on the MACD line for precise entry timing
### Built-in Alerts
- Real-time notifications for divergence signals
- Alerts can trigger mobile push notifications or sound
- Never miss a trading opportunity
---
## How to Use
### Installation
1. Open TradingView and navigate to the Chart
2. Click "Indicator" → Search "MACD Divergence Optimizer"
3. Click "Add to Chart"
4. The indicator appears in a separate panel below the price chart
### Reading the Indicator
**MACD Panel displays:**
- **Blue Line** = MACD (fast momentum)
- **Orange Line** = Signal line (slow momentum)
- **Histogram** (colored bars) = Difference between MACD and Signal
- Green bars = MACD above signal (bullish)
- Red bars = MACD below signal (bearish)
**Divergence Signals:**
- **Green Triangle ▲** = Bullish divergence detected
- Price is lower, but MACD momentum is strengthening
- Look for uptrend reversal
- Confirm with higher closes or volume
- **Red Triangle ▼** = Bearish divergence detected
- Price is higher, but MACD momentum is weakening
- Look for downtrend reversal
- Confirm with lower closes or selling volume
---
## Parameters & Settings
### MACD Fast Length (Default: 12)
- Controls the faster moving average period
- **Lower values** → More responsive, more false signals
- **Higher values** → Smoother, fewer signals
- **Typical range**: 8-15
### MACD Slow Length (Default: 26)
- Controls the slower moving average period
- **Lower values** → Faster divergence detection
- **Higher values** → More reliable, fewer signals
- **Typical range**: 20-35
### Signal Smoothing (Default: 9)
- EMA period applied to MACD itself
- **Lower values** → Faster crossover signals
- **Higher values** → Fewer false crossovers
- **Typical range**: 5-15
### Min Divergence Strength (Default: 0.5%)
- Minimum % difference between current MACD and swing MACD
- **Lower values** → More divergence signals (noisier)
- **Higher values** → Only strong divergences (fewer signals)
- **Recommended**: 0.3% - 1.0%
### Lookback Bars (Default: 75)
- Historical window for analysis
- Larger lookback = more context but slower calculation
- **Typical range**: 50-100
---
## Trading Strategy
### Bullish Divergence (Entry Setup)
1. **Identify Signal**: Green triangle appears on MACD
2. **Confirm Price**: Look for price rejection of the low (bounce)
3. **Volume Check**: Buy on increase in volume at the bounce
4. **Entry**: Above the swing low level
5. **Stop Loss**: Below the most recent swing low
6. **Target**: Next swing high or resistance level
### Bearish Divergence (Entry Setup)
1. **Identify Signal**: Red triangle appears on MACD
2. **Confirm Price**: Look for price rejection of the high
3. **Volume Check**: Sell on increase in volume at rejection
4. **Entry**: Below the swing high level
5. **Stop Loss**: Above the most recent swing high
6. **Target**: Next swing low or support level
### Risk Management
- **Position Size**: Risk only 1-2% per trade
- **Stop Loss**: Place beyond recent swings
- **Take Profit**: Scale out at 1:1, 1:2, 1:3 risk-reward ratios
- **Filter**: Use on higher timeframes (4H, Daily) for reliability
---
## Timeframe Recommendations
| Timeframe | Best For | Signal Quality |
|-----------|----------|---|
| **1H** | Scalping, day trading | Moderate (some noise) |
| **4H** | Swing trading | Excellent |
| **Daily** | Position trading | Excellent |
| **Weekly** | Long-term trends | Excellent |
---
## Tips & Best Practices
### ✅ DO:
- **Use on trends**: Divergences work best when there's a clear trend
- **Combine signals**: Look for confirmation from price action, volume, or moving averages
- **Trade the bounce**: Wait for price to react to the swing, then enter
- **Adjust parameters**: Test different MACD lengths for your trading style
- **Use alerts**: Set up mobile alerts so you don't miss signals
### ❌ DON'T:
- **Trade every signal**: Some signals are stronger than others
- **Trade flat/choppy markets**: Divergences fail in ranging markets
- **Ignore support/resistance**: Trade divergences near key levels for best results
- **Over-leverage**: Divergences are probabilistic, not guaranteed
- **Disable volume analysis**: Always check volume when divergence fires
---
## Advanced Features
### Volume Weighting
The indicator uses **volume-weighted MACD** instead of standard MACD. This means:
- High-volume reversals get more emphasis
- Low-volume moves are smoothed out
- More accurate momentum readings
- Better at identifying true trend changes
### Array Tracking
The indicator tracks the last 5 swings in arrays:
- `swingLows ` = last 5 price lows
- `swingHighs ` = last 5 price highs
- `swingMacds ` = corresponding MACD values
This allows detection of **hidden divergences** not visible in traditional analysis.
---
## Common Questions
**Q: Why didn't the indicator trigger a signal when I see a divergence?**
A: The indicator may require:
- MACD histogram to cross the zero line (confirms momentum shift)
- Minimum strength threshold to be met (adjust Min Divergence Strength)
- At least 5 swings to be recorded in the lookback window
**Q: Can I use this on all timeframes?**
A: Yes, but divergences are more reliable on higher timeframes (4H+). Lower timeframes produce more signals but with more noise.
**Q: Should I trade every green/red triangle?**
A: No. Use them as a heads-up for potential reversals. Always confirm with:
- Price action (rejection of the swing)
- Volume (increasing volume at reversal)
- Key support/resistance levels
**Q: How do I set alerts?**
A:
1. Right-click the indicator → Edit Alerts
2. Check "Bullish Divergence" and/or "Bearish Divergence"
3. Choose notification type (browser, mobile, email)
4. Set frequency to "Once per bar close"
**Q: What's the difference between regular and hidden divergence?**
A: This indicator detects **hidden divergences** (also called continuation divergences):
- **Regular**: Price makes new extreme, but oscillator doesn't
- **Hidden**: Price makes new extreme, oscillator makes new extreme in different direction
- Hidden divergences are often more reliable for continuation plays
---
## Disclaimer
This indicator is provided for educational and informational purposes only. It is not financial advice. Past performance does not guarantee future results. Always use proper risk management and combine with other analysis methods. Trading and investing carry risk of loss. Do your own research before making trading decisions.
---
## Support & Updates
For issues, feature requests, or questions:
- Check the indicator settings and parameter values
- Test on historical data first before live trading
- Adjust parameters to match your trading style and timeframe
---
**Version**: 1.0
**Last Updated**: November 2025
**Compatible**: TradingView v6+
Jalur dan Saluran

Myanverse Scalper BurmeseThis is Public Indicators from many resources and translated into burmese to use at ease.
I have another option sale indicators to use together.
Position Size CalculatorSet TP SL and entry point, over any chart to follow the points without drawing lines

Color EMA (Green Above, Red Below)olor EMA (Green Above, Red Below) is a simple yet effective trend-visualization tool that colors the Exponential Moving Average (EMA) based on price position.
When the close is above the EMA, the line turns green, indicating bullish strength.
When the close is below the EMA, the line turns red, indicating bearish pressure.

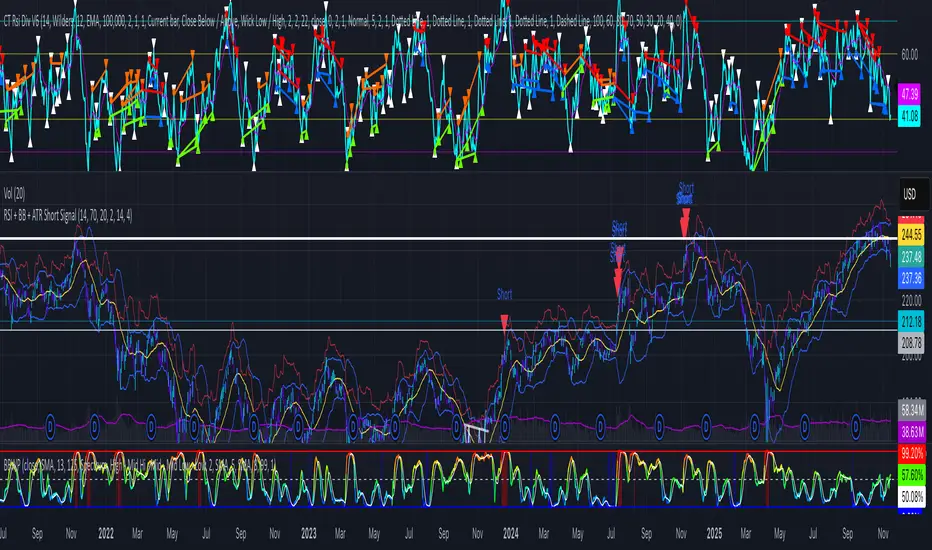
RSI + BB + ATR Short SignalThis indicator highlights potential short setups by combining three conditions:
RSI Overbought – RSI must be above the user-defined level.
Bollinger Band Break – Price must close above the upper Bollinger Band.
Extended Above the 5-Day Low – Price must sit at least X ATR above the recent 5-day low.
When all conditions line up on the same bar, the script plots a red triangle above the candle and triggers an alert so you can act immediately.
To help visualise the setup, the script also plots the full Bollinger Bands (upper, middle, lower) and a line showing the threshold of 5-day-low + ATR × multiplier. You can adjust RSI length and level, Bollinger settings, ATR length, and the ATR multiplier.
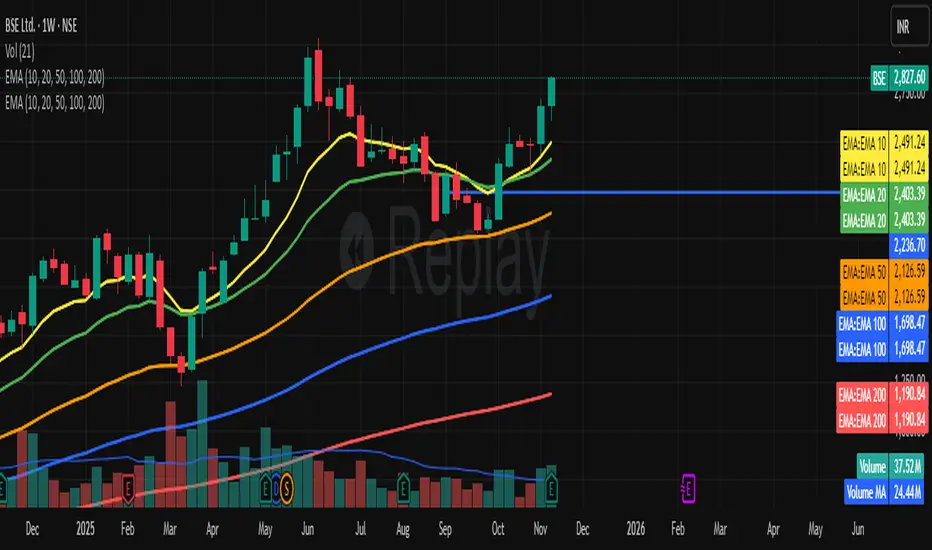
EMA Channel EMA Channel
All EMAs in single indicator
Customizable inputs
Clean color scheme
Works for any timeframe
Ideal for trend, pullback & momentum trading
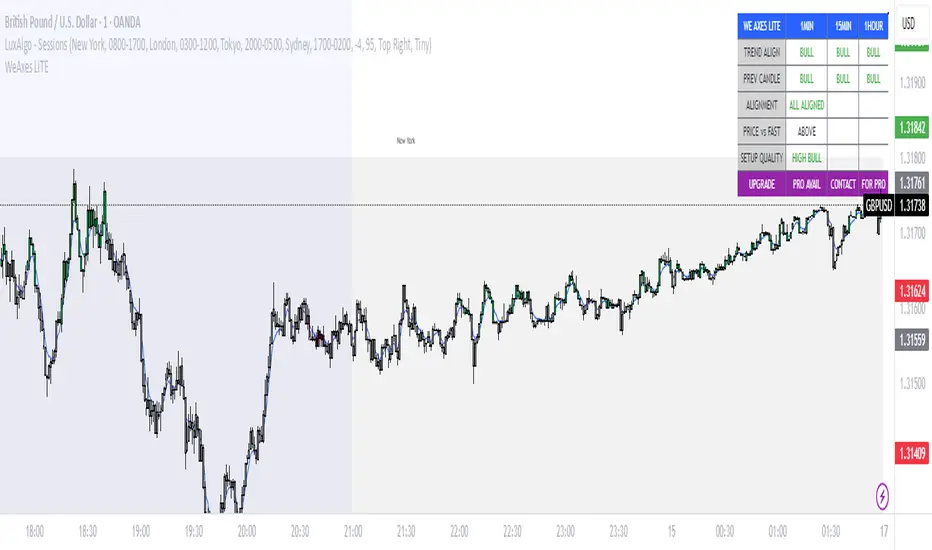
WeAxes MTF Scalper [LITE] WeAxes MTF Scalper
Professional Multi-Timeframe Alignment Tool - LITE Version
What This LITE Version Offers:
3-Timeframe Sync: Monitor 1min, 15min, and 1hr trends simultaneously
Visual Alignment System: Color-coded candles for perfect setups
Quick Setup Recognition: Instant HIGH/MEDIUM/LOW quality ratings
Clean Data Display: Essential alignment information at a glance
Perfect for Scalping:
Green Candles: Perfect bullish alignment across all timeframes
Red Candles: Perfect bearish alignment across all timeframes
Setup Quality: Know immediately if conditions are favorable
Multi-Timeframe Context: Never trade blind again
How to Use:
1. HIGH Quality Setups (Green/Red candles): Highest probability trades
2. MEDIUM Quality: All trends aligned, good for trend following
3. LOW Quality: Mixed signals, better to wait for alignment
PRO Version Includes:
- Advanced volume profiling across all timeframes
- Momentum strength calculations
- Detailed market structure analysis
- Smart Money Concepts integration
- Complete volume analysis
- And much more...
This LITE version gives you a taste of professional multi-timeframe analysis. Contact for PRO version access with full features.
Disclaimer: Use proper risk management. This tool assists analysis but doesn't guarantee profits.
Consolidation Tracker🧭 Consolidation Tracker — Visualize Market Reversals in Real Time
The Consolidation Tracker is a minimalist yet powerful tool designed to map the anatomy of market reversals and trend transitions. It highlights the structural evolution of price through four key phases, helping traders anticipate shifts with clarity and confidence.
🔄 The Four Stages of a Market Reversal:
Failure to Displace — Price fails to break beyond recent highs or lows, signaling potential exhaustion of the current trend.
Consolidation (CAMP) — A range-bound phase where price compresses between a dynamic high and low. These zones are shaded gray, representing indecision and balance.
Engulfing (ENGULF) — A decisive candle closes beyond the CAMP high or low, suggesting a directional shift. These are highlighted in orange.
Fair Value Gap (FVG) — A three-candle pattern forms a price imbalance. If this FVG also engulfs the CAMP range, it confirms the reversal and resets the CAMP. Bullish FVGs are shaded green, bearish FVGs in red.
🔁 From Reversal to Trend:
Once a reversal is confirmed via an FVG, the market often transitions into a trend cycle characterized by:
Displacement — Strong directional movement away from the prior range.
Fair Value Gaps — Continuation imbalances that offer high-probability entries on retracements.
🧠 How It Works:
The indicator dynamically tracks CAMP highs and lows, updating only when a candle engulfs the range or a valid FVG forms.
FVGs are detected when a three-candle sequence creates a gap between candle 2 and 0, and the middle candle (candle 1) breaks the CAMP boundary.
CAMP levels are plotted as horizontal lines, while background colors narrate the evolving structure in real time.
This tool is ideal for traders who value market structure, price efficiency, and narrative clarity. Whether you're anticipating reversals or riding trends, the Consolidation Tracker offers a clean, actionable lens into price behavior.

TNT TRADER MARKET ClOSEVertical Line of red showing the New York market close. Color and time can be changed

TNT TRADER EMA FANEMA fan of 8 20 50 200, very simple and straight forward with color change options.

Absorption — Bullish or BearishAbsorption — Bullish or Bearish Only is a lightweight and minimalistic tool designed to identify pure absorption events in the market.
It highlights only two conditions:
Bullish Absorption
• Volume spike
• Small candle body
• Positive delta behavior (close > open)
→ Indicates potential buy-side absorption at lows
Bearish Absorption
• Volume spike
• Small candle body
• Negative delta behavior (close < open)
→ Indicates potential sell-side absorption at highs
This script intentionally keeps the chart clean by marking only “Bullish” or “Bearish” labels, without any additional visuals, colors, or extra signals.
Ideal for traders who want a simple, non-disruptive absorption confirmation tool.

Absorption DetectorAbsorption Detector is a clean and effective tool designed to identify institutional absorption at key turning points of the market.
It highlights candles where volume surges but the real body remains small, indicating potential absorption of liquidity before a reversal move.
Key Features
Volume Spike Detection – identifies abnormal increases in traded volume
Small Body Recognition – pinpoints candles with low real-body percentage
Delta Simulation (Fake Delta) – uses close–open behavior to approximate bullish/bearish delta
Bullish Absorption – highlights potential low-side absorption (green dots + green candles)
Bearish Absorption – highlights potential high-side absorption (red dots + red candles)
Background Highlighting – visual emphasis on absorption zones
Clean, lightweight and non-repainter
How It Helps
Absorption often occurs before strong moves:
Large players fill opposite orders
Stops are triggered and absorbed
Liquidity on one side dries up
Reversal or continuation moves follow
This indicator makes it easy to spot these moments in real time.

Volume Spike HighlighterVolume Spike Highlighter is a simple and effective volume-based tool designed to highlight abnormal trading activity.
It detects when the current volume exceeds the average volume by a customizable multiplier and visually emphasizes those bars with bright colors, making unusual buying or selling pressure easy to spot.
Features:
Highlights volume spikes with enhanced green/orange color
Normal volume remains standard red/green
Adjustable lookback period and spike multiplier
Includes a smooth volume moving average for context
Clean and lightweight, ideal for intraday or swing traders
This indicator helps traders quickly identify strong participation, breakouts, absorption zones, trap candles, and areas where institutions may be active.


Bullish ATR Level indicatorThis indicator is used by OVTLYR Golden Ticket Trading strategy to determine the stop loss and option rollover levels. Super simple indicator that just shows the current price, -1/2 ATR for a stop loss and 1 and 2 ATR levels for possible take profit or option rollover points.

Engulfing Candlestick Pattern - BB FilterBeen working on doing a better version of this. This is like version 2.0. Usese this definition of an engulfing candle:
tradeciety.com/how-to-trade-the-engulfing-candlestick-pattern
As you change the parameters of the Bollinger band the signals will change.
You can also set the distance away from the band using ATR muliplier to catch moves near the BB.
Per Claude,
This setup should give you much higher quality signals since you're filtering for engulfing patterns that occur at the extremes of the Bollinger Bands - exactly like the Tradeciety article recommends. Those are the setups with the best context and highest probability.
A few tips for using it:
You can adjust the BB Touch Distance slider if you want to be stricter or more lenient about what counts as "touching" the bands
Try enabling Strict Mode if you want only the strongest engulfing patterns (where the full range including wicks is engulfed)
Works great on higher timeframes like Daily and Weekly for the most reliable signals on NQ and ES
I personally use this on the 1000 tick NQ chart.
It's not perfect but 2x better than my first attempt. Enjoy.
Open to suggestions as well.
For entertainment purposes only.

Engulfing Candlestick Pattern - BB FilterBeen working on doing a better version of this. This is like version 2.0. Usese this definition of an engulfing candle:
tradeciety.com
As you change the parameters of the Bollinger band the signals will change.
You can also set the distance away from the band using ATR muliplier to catch moves near the BB.
Per Claude,
This setup should give you much higher quality signals since you're filtering for engulfing patterns that occur at the extremes of the Bollinger Bands - exactly like the Tradeciety article recommends. Those are the setups with the best context and highest probability.
A few tips for using it:
You can adjust the BB Touch Distance slider if you want to be stricter or more lenient about what counts as "touching" the bands
Try enabling Strict Mode if you want only the strongest engulfing patterns (where the full range including wicks is engulfed)
Works great on higher timeframes like Daily and Weekly for the most reliable signals on NQ and ES
I personally use this on the 1000 tick NQ chart.
It's not perfect but 2x better than my first attempt. Enjoy.
Open to suggestions as well.
For entertainment purposes only.

Volume Climax Reversal (VCR) — Catch Exhaustion Tops & BottomsNew! VCR spots exhaustion spikes at highs/lows using volume extremes + price action + VWAP context.
If you trade parabolic runners, indices, or mean-reversion edges, VCR helps you time the backside (shorts) and fade capitulation (longs) with clean, rule-based signals.
What it does
Detects volume climax: current volume > SMA(len) × multiplier and a new volume high in the lookback.
Confirms price context: makes a higher high (for tops) or lower low (for bottoms).
Filters with VWAP (optional): bearish signals only below VWAP, bullish signals only above VWAP.
Optional wick filter: requires an exhaustion wick > body to reduce chop.
Why traders like it
Clear entries: “VCR↓” (bearish) at exhaustion tops, “VCR↑” (bullish) at washout lows.
Fewer false signals: VWAP gating + wick filter focus on true climaxes.
Built-in alerts: set once, get notified on your phone/desktop when a setup appears.
How I trade it (simple playbook)
Bearish reversal (short / puts)
Wait for VCR↓ (exhaustion at/near HH).
Look for a lower high that fails to reclaim the signal candle high.
Enter on the break of that lower-high candle low.
Stop above the signal wick high.
Covers/targets: VWAP first; then 20–30% fade from the local top / prior demand.
Bullish reversal (long / calls)
Wait for VCR↑ (capitulation at/near LL).
Look for a higher low that holds above the signal candle low.
Enter on the break of the HL candle high.
Stop below the signal wick low.
Targets: VWAP first; then prior supply/MA bands.
Tip for small-cap/“Dux” style: VCR pairs perfectly with a gap + high USD-rotation scan. Let them blow off, then use VCR for the timing.
Inputs (tune to your market)
Volume SMA Length (default 20)
Volume Spike Multiplier (default 2.0)
Lookback High / Low (default 10 / 10)
Require VWAP confirmation? (on)
Use wick filter? (on)
Works on stocks, indices, futures, crypto.
Timeframes: 1–15m for day trading; 1h–4h–D for swing.
Alerts
Set one (or both) alerts and forget it:
Bearish Volume Climax — VCR↓
Bullish Volume Climax — VCR↑
You’ll get instant notifications when a qualified top/bottom prints.
Best practices
Don’t countertrend the first front-side ramp—wait for the VCR and a lower-high/higher-low.
Respect VWAP: it’s your first profit-taking and a bias filter.
Size small into volatility; widen stops in fast markets.
Combine with your watchlist filters (gap %, float/O/S, USD rotation, session timing).
What’s included
Clean visual signals (triangles + subtle background shading)
Session-anchored VWAP
Alert conditions that appear in TradingView’s alert menu
Sensible defaults + clear docs (this post)
FAQ
Q: Does it repaint?
No. VCR uses completed-bar data; signals print end-of-bar.
Q: Which markets?
Anything with volume: US equities, futures, crypto, indices.
Q: Can I use it for scalps?
Yes—1–5m with wick filter on and VWAP required works well.
Get more / upgrades
I’m iterating fast (MTF filter, heatmap panel, combined “one-alert” mode).
Want the pro template with dashboard & combined alerts? Message me on TV or DM / email you@domain.com
.
Risk Notice
This is educational research, not financial advice. Markets carry risk—always manage position size and use stops.
If this helped you, smash the 👍 and ⭐ — it really helps!
#volume #vwap #reversal #exhaustion #trendreversal #smallcaps #scalping #daytrading #swingtrading #stocks #futures #crypto #indicator

VWAP + Volume Spikes See Where Smart Money ExhaustsVolume tells the truth. VWAP tells the bias. This script shows both — live.
If you trade intraday momentum, reversals, or liquidity sweeps, this indicator is built for you.
It shows where volume spikes hit extreme levels, anchored around VWAP and its dynamic bands, so you can instantly spot capitulation or hidden absorption.
🎯 What This Indicator Does
✅ Plots VWAP — session-anchored, updates automatically
✅ Adds dynamic VWAP bands — standard deviation envelopes showing volatility context
✅ Highlights volume spikes — colored candles + background for abnormal prints
✅ Includes alerts — “Volume Spike”, “VWAP Cross”, or a combined alert with direction
✅ Clean visual design — instantly readable in fast markets
It’s your visual orderflow radar — whether you’re trading gold, indices, or small caps.
🔍 Why It Works
Institutions build and unwind positions around VWAP.
Retail often chases volume… this script shows you when that volume becomes too extreme.
A spike above VWAP near resistance? → Likely distribution.
A spike below VWAP near support? → Likely capitulation.
Combine volume exhaustion + VWAP context, and you’ll see market turning points form before most indicators react.
⚙️ Inputs You Can Tune
Bands lookback: adjusts how reactive the VWAP bands are
Band width (σ): set how tight or wide your deviation envelope is
Volume baseline length: controls how “abnormal” a spike must be
Spike threshold: multiplier vs. average volume
Toggle color-coding, bands, and labels
Default settings work well across 1m–15m intraday charts and 1h–4h swing frames.
💡 How Traders Use It
1️⃣ Fade Parabolics:
When a green spike candle pierces upper VWAP band on high volume → smart money unloading.
Look for rejection and short into VWAP.
2️⃣ Catch Capitulations:
When a red spike candle dumps below lower VWAP band → panic selling.
Watch for stabilization and long back to VWAP.
3️⃣ VWAP Rotation Plays:
Alerts for price crossing VWAP help you spot shift in intraday control.
Above VWAP = buyers in charge.
Below VWAP = sellers in charge.
🧠 Best Practices
Pair it with Volume Profile or Delta/Flow tools to confirm exhaustion.
Don’t chase — wait for spike confirmation + reversal candle.
Use it on liquid tickers (NASDAQ, SPY, GOLD, BTC, etc.).
Great for Dux-style small-cap shorts or index pullbacks.
🔔 Alerts Ready
Choose from:
Volume Spike (single-bar explosion)
VWAP Cross Up/Down (trend shift confirmation)
One Combined Alert (any signal, includes ticker, price, and volume)
Set once — get real-time push notifications, Telegram, or webhook signals.
📊 My Favorite Setups
US100 / NASDAQ: fade rallies above VWAP + spike
Gold / Silver: trade reversals from VWAP bands
Small caps: short back-side after volume climax
ES, DAX, Oil: scalp VWAP rotation with confluence
❤️ Support This Work
I release free and premium scripts weekly — combining smart money concepts, VWAP tools, and volume analytics.
👉 Follow me on TradingView for more indicators and setups.
👉 Comment “🔥” if you want me to post the multi-timeframe VWAP + Volume Pressure version next.
👉 Share this with your team — it helps the community grow.


Asian Range [FE]This script will help you mark out the Asian session range as well as write down your trading rules at the top right corner,

Smart MA Crossover█ OVERVIEW
"Smart MA Crossover" is a technical analysis indicator designed to enhance the effectiveness of strategies based on MA crossovers, combining classic moving average crossovers with breakouts from boxes and dynamic trend visualizations. The indicator is fully customizable—you can freely adjust both parameters and graphical elements.
█ CONCEPTS
Trading approaches based solely on moving average crossover moments generate a large number of false signals. Smart MA Crossover was created to improve this statistic. That's why boxes are added, which are formed from the candle where the MA crossover occurred and generate signals only upon breakout from them. The boxes have bullish (green) and bearish (red) colors. By default, the show_only_matching filter is enabled, displaying entry signals only when the breakout direction matches the box color (e.g., only upward for a bullish box). Boxes are by default the size of the candle on which the crossover occurred, but their size can be adjusted to suit your strategy via an optional average candle size multiplier.
█ FEATURES
- Moving Averages: Two configurable MAs (fast_length, default 10; slow_length, default 30) with selectable type (SMA, EMA, WMA, HMA, VWMA). Optionally displayed with gradient fill between them (color depends on trend: green for uptrend, red for downtrend).
- MA Gradient and Candle Coloring: Enable gradient fill between MAs (transparency: gradient_opacity, default 85) and dynamic candle coloring based on trend (green/red).
- Fog Gradient Trend: Multi-layered gradient "fog" around hl2, consisting of 5 levels up and down, with offset based on average candle size (offset_mult, default 0.7) and increasing transparency (base_transp, default 80; transp_inc, default 4). Fog colors are dynamic (green/red).
- Breakout Boxes: Created at the moment of MA crossover, extending to the right. Box height optionally multiplied by average candle size (use_box_multiplier, box_multiplier, default 1.0). Boxes close and generate a signal when price breaks out beyond the top/bottom edge.
Signals:
- Triangles: Green downward triangles (buy breakout) below the bar, red upward triangles (sell breakout) above the bar—only on breakouts matching direction (if show_only_matching = true). When the matching filter is disabled, every box generates a signal based not on the MA crossover, but on the breakout direction.
- Labels: “BUY” (green, below bar) and “SELL” (red, iabove bar) with transparent background (transparency 40).
- Matching Filter: The show_only_matching option limits signals to breakouts consistent with box direction (bullish box → only buy, bearish → only sell).
- Visualization: Gradient MA lines, fill between MAs, multi-layered fog with increasing transparency, boxes with transparent background (85) and colored borders, dynamic trend colors.
- Alerts: Built-in alerts for BUY and SELL signals (with message including ticker and timeframe).
█ HOW TO USE
Add to Chart: Apply the indicator via Pine Editor or the Indicators menu on TradingView.
Configure Settings:
- MA Settings: Adjust fast (fast_length, default 10) and slow (slow_length, default 30) MA lengths and type (ma_type, default SMA).
- Visualization: Enable/disable MA lines (show_ma_lines), MA gradient (use_gradient_ma), fog trend (show_fog), candle coloring (color_candles).
- Boxes and Breakouts: Enable candle size multiplier (use_box_multiplier) and set value (box_multiplier, default 1.0). Enable signal filter (show_only_matching).
- Signals: Choose type (signal_type): Triangles or Labels (Buy/Sell).
- Fog Trend: Adjust offset (offset_mult), base transparency (base_transp), and increment (transp_inc). Select trend colors (col_up, col_dn).
Signal Interpretation:
- Buy Signals: Green triangles below the bar or “BUY” label—on upward breakout from a bullish box (after bull cross).
- Sell Signals: Red triangles above the bar or “SELL” label—on downward breakout from a bearish box (after bear cross).
- Fog and Gradient: green fog/fill = uptrend; red = downtrend.
- Boxes: Active boxes indicate potential breakout zones; their closure confirms the move.
Signal Confirmation: Use with other tools, such as support/resistance levels, volume, or additional MAs to filter false crossovers.
█ APPLICATIONS
- MA Cross Strategies: Replace classic crossovers—boxes and breakouts eliminate many false signals, thereby increasing effectiveness. Confirm with other indicators, e.g., RSI, Fibonacci, FVG, pivot levels.
- Trend Following: Can be used as a classic trend indicator, especially with larger MA values.
█ NOTES
- Test the indicator across different timeframes and assets, adjusting MA lengths and box multiplier to market volatility.
- In consolidating markets, the indicator generates more false signals.
