21-50-100 EMA Crossover indicatorSimple EMA crossover indicator visualizing 21-50-100 EMA crossovers.
Jalur dan Saluran
SPY EMA + VWAP Day Trading Strategy (Market Hours Only)//@version=5
indicator("SPY EMA + VWAP Day Trading Strategy (Market Hours Only)", overlay=true)
// === Market Hours Filter (EST / New York Time) ===
nySession = input.session("0930-1600", "Market Session (NY Time)")
inSession = time(timeframe.period, "America/New_York") >= time(nySession, "America/New_York")
// EMAs
ema9 = ta.ema(close, 9)
ema21 = ta.ema(close, 21)
// VWAP
vwap = ta.vwap(close)
// Plot EMAs & VWAP
plot(ema9, "EMA 9", color=color.green, linewidth=2)
plot(ema21, "EMA 21", color=color.orange, linewidth=2)
plot(vwap, "VWAP", color=color.blue, linewidth=2)
// ----------- Signals -----------
long_raw = close > ema9 and ema9 > ema21 and close > vwap and ta.crossover(ema9, ema21)
short_raw = close < ema9 and ema9 < ema21 and close < vwap and ta.crossunder(ema9, ema21)
// Apply Market Hours Filter
long_signal = long_raw and inSession
short_signal = short_raw and inSession
// Plot Signals
plotshape(long_signal,
title="BUY",
style=shape.labelup,
location=location.belowbar,
color=color.green,
size=size.small,
text="BUY")
plotshape(short_signal,
title="SELL",
style=shape.labeldown,
location=location.abovebar,
color=color.red,
size=size.small,
text="SELL")
// Alerts
alertcondition(long_signal, title="BUY Alert", message="BUY Signal (Market Hours Only)")
alertcondition(short_signal, title="SELL Alert", message="SELL Signal (Market Hours Only)")


NQ-VIX Expected Move LevelsNQ -VIX Daily Price Bands
This indicator plots dynamic intraday price bands for NQ futures based on real-time volatility levels measured by the VIX (CBOE Volatility Index). The bands evolve throughout the trading day, providing volatility-adjusted price targets.
Formulas:
Upper Band = Daily Open + (NQ Price × VIX ÷ √252 ÷ 100)
Lower Band = Daily Open - (NQ Price × VIX ÷ √252 ÷ 100)
The calculation uses the square root of 252 (trading days per year) to convert annualized VIX volatility into an expected daily move, then scales it as a percentage adjustment from the current day's open.
Features:
Real-time band calculation that updates throughout the trading session
Upper band (green) extends from the current day's open
Lower band (red) contracts from the current day's open
Inner upper band (green) at 50% of expected move
Inner lower band (red) at 50% of expected move
Middle Inner upper band (green) at 80% of expected move
Middle Inner lower band (red) at 80% of expected move
Information table displaying:
Current NQ price and VIX level
Daily Open
Expected move

NQ-VIX Expected Move LTF LevelsNQ -VIX LTF Price Bands
This indicator plots dynamic intraday price bands for NQ futures based on real-time volatility levels measured by the VIX (CBOE Volatility Index). The bands evolve throughout the trading day, providing volatility-adjusted price targets.
Formulas:
Upper Band = (Input TF Open) + (NQ Price × VIX x √(Input TF ÷ (23h in min) ) ÷ 100
Lower Band = Daily Open - (NQ Price × VIX x √(Input TF ÷ (23h in min) ) ÷ 100
The calculation uses the square root of Input TF ÷ (23h in min) to convert annualized VIX volatility into an expected TF move, then scales it as a percentage adjustment from the current TF input's open.
Features:
Real-time band calculation that updates throughout the trading session
Upper band (green) extends from the current TF's open
Lower band (red) contracts from the current TF's open
Inner upper band (green) at 50% of expected move
Inner lower band (red) at 50% of expected move
Middle Inner upper band (green) at 80% of expected move
Middle Inner lower band (red) at 80% of expected move
Information table displaying:
Current input TF
Current NQ price and VIX level
Current input TF Open
Expected move

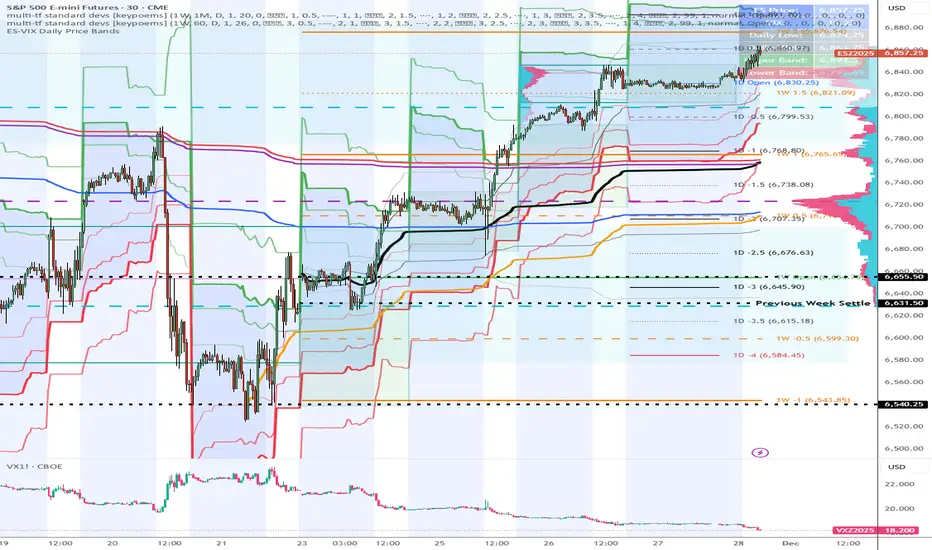
ES-VIX Expected Move LTF LevelsES-VIX LTF Price Bands
This indicator plots dynamic intraday price bands for ES futures based on real-time volatility levels measured by the VIX (CBOE Volatility Index). The bands evolve throughout the trading day, providing volatility-adjusted price targets.
Formulas:
Upper Band = (Input TF Open) + (ES Price × VIX x √(Input TF ÷ (23h in min) ) ÷ 100
Lower Band = Daily Open - (ES Price × VIX x √(Input TF ÷ (23h in min) ) ÷ 100
The calculation uses the square root of Input TF ÷ (23h in min) to convert annualized VIX volatility into an expected TF move, then scales it as a percentage adjustment from the current TF input's open.
Features:
Real-time band calculation that updates throughout the trading session
Upper band (green) extends from the current TF's open
Lower band (red) contracts from the current TF's open
Inner upper band (green) at 50% of expected move
Inner lower band (red) at 50% of expected move
Middle Inner upper band (green) at 80% of expected move
Middle Inner lower band (red) at 80% of expected move
Information table displaying:
Current input TF
Current ES price and VIX level
Current input TF Open
Expected move

Bitcoin Power Law Zones (Dunk)Introduction When viewed on a standard linear chart, Bitcoin’s long-term price action can appear chaotic and exponential. However, when analyzed through the lens of physics and network growth models, a distinct structure emerges.
This indicator implements the Bitcoin Power Law , a mathematical model that suggests Bitcoin’s price evolves in a straight line when plotted against time on a "log-log" scale. By calculating parallel bands around this regression line, we create a "Rainbow" of valuation zones that help investors visualize whether the asset is historically overheated, undervalued, or sitting at fair value.
The Math Behind the Model The Power Law dictates that price scales with time according to the formula: Price = A * (days since genesis)^b
This script uses the specific parameters popularized by recent physics-based analyses of the network: Slope (b): 5.78 (Representing the scaling law of the network adoption). Amplitude (A): 1.45 x 10^-17 (The intercept coefficient).
While simple moving averages react to price, this model is predictive based on time and network growth physics, providing a long-term "gravity" center for the asset.
Guide to the Valuation Zones
Upper Bands (Red/Orange): Extr. Overvalued, High Premium, Overvalued. Historically, these zones have marked cycle peaks where price moved too far, too fast ahead of the network's steady growth. The Baseline (Black Line): Fair Value. The mathematical mean of the Power Law. Price has historically oscillated around this line, treating it as a center of gravity. Lower Bands (Green/Blue): Undervalued, Discount, Deep Discount. These zones represent periods where the market price has historically lagged behind the network's intrinsic value, often marking accumulation phases.
Note: The lowest theoretical tiers ("Bitcoin Dead") have been trimmed from this chart to focus on relevant historical support levels.
How to Use Logarithmic Scale: You MUST set your chart to "Log" scale (bottom right of the TradingView window) for this indicator to function correctly. On a linear chart, the bands will appear to curve upwards aggressively; on a Log chart, they will appear as smooth, parallel channels. Timeframe: This is a macro-economic indicator. It is best viewed on Daily or Weekly timeframes. Overlay Labels: The indicator includes dynamic labels on the right-side axis, allowing you to instantly see the current price requirements for each valuation zone without manually tracing lines.
Credits This script is based on the Power Law theory popularized by Giovanni Santostasi and the original Corridor concepts by Harold Christopher Burger .
Disclaimer This tool is for educational and informational purposes only. It visualizes historical mathematical trends and does not constitute financial advice. Past performance of a model is not indicative of future results.
Further Reading
www.hcburger.com
giovannisantostasi.medium.com

Zig Zag & Trendlines with Dynamic Threshold ATRPercentage Zig Zag with Dynamic Threshold
This Pine Script indicator is an advanced Zig Zag tool that identifies and tracks price pivots based on a percentage move required for reversal, offering a clear visual representation of volatility-adjusted trends.
Core Functionality (The Reversal Threshold):
Unlike standard Zig Zag indicators that use a fixed price difference, this indicator calculates the required reversal size (%X) dynamically using the Average True Range (ATR).
It calculates the ATR as a percentage of the current price (ATR%).
The final threshold is this ATR% multiplied by a user-defined factor (default 3x).
This means the reversal threshold is wider during volatile periods and narrower during quiet periods, adapting automatically to market conditions. Users can optionally revert to a fixed percentage if desired.
Trend Extension Lines:
The indicator draws two unique, dynamic trend lines connecting the last two significant Highs and the last two significant Lows. Crucially, these lines do not wait for the entire Zig Zag leg to confirm:
If the price is actively forming a new up-leg, the High Extension Line connects the last confirmed High to the current extreme high of the active move.
The Low Extension Line functions similarly for the downtrend.
This feature allows the user to visualize dynamic support and resistance levels based on the current, active trend structure defined by the percentage threshold.

Forex Trend Master FollowerThis indicator is based on slow and fast EMA, like regular EMA cross, but updated. It works the best on trendy pairs like EU, and works the best on 4h time frame. It shows where to entry and where to close the position based on slow EMA. It can be used like additional confluence with FTB entry model, and whole strategy.

ES-VIX Expected Move - Open basedES-VIX Daily Price Bands
This indicator plots dynamic intraday price bands for ES futures based on real-time volatility levels measured by the VIX (CBOE Volatility Index). The bands evolve throughout the trading day, providing volatility-adjusted price targets.
Formulas:
Upper Band = Daily Open + (ES Price × VIX ÷ √252 ÷ 100)
Lower Band = Daily Open - (ES Price × VIX ÷ √252 ÷ 100)
The calculation uses the square root of 252 (trading days per year) to convert annualized VIX volatility into an expected daily move, then scales it as a percentage adjustment from the current day's open.
Features:
Real-time band calculation that updates throughout the trading session
Upper band (green) extends from the current day's open
Lower band (red) contracts from the current day's open
Inner upper band (green) at 50% of expected move
Inner lower band (red) at 50% of expected move
Middle Inner upper band (green) at 80% of expected move
Middle Inner lower band (red) at 80% of expected move
Information table displaying:
Current ES price and VIX level
Daily Open
Expected move

Ben D"s IndicatorIt Auto Draws and Detects, Channels draws buy and sell signals based on over bought, oversold and a few other indicators. It works on all time frames! Enjoy! Leave a comment if you like it.

EMA Crossover + Angle + Candle Pattern + Breakout (Clean) finalmayank raj 9 15 ema strategy which will give me 1 crore

FVG + Bollinger + Toggles + Swing H&L (Taken/Close modes)This indicator combines multiple advanced market-structure tools into one unified system.
It detects A–C Fair Value Gaps (FVG) and plots them as dynamic boxes projected a fixed number of bars forward.
Each bullish or bearish FVG updates in real time and “closes” once price breaks through the opposite boundary.
The indicator also includes Bollinger Bands based on EMA-50 with adjustable deviation settings for volatility context.
Swing Highs and Swing Lows are identified using pivot logic and are drawn as dynamic lines that change color once taken out.
You can choose whether swings end on a close break or on any touch/violation of the level.
All visual elements—FVGs, Bollinger Bands, and Swing Lines—can be individually toggled on or off from the settings panel.
A time-window session box is included, allowing you to highlight a custom intraday window based on your selected timezone.
The session box automatically tracks the high and low of the window and locks the final range once the window closes.
Overall, the tool is designed for traders who want a structured, multi-layered view of liquidity, volatility, and intraday timing.

RSI + EMA Dynamic Zones + Volume + Divergence (with RSI 50 line)RSI + EMA Dynamic Zones + Volume + Divergence (with RSI 50 line)


ES-VIX Daily Price Bands - Inner and OuterES-VIX Daily Price Bands
This indicator plots dynamic intraday price bands for ES futures based on real-time volatility levels measured by the VIX (CBOE Volatility Index). The bands evolve throughout the trading day, providing volatility-adjusted price targets.
Formulas:
Upper Band = Daily Low + (ES Price × VIX ÷ √252 ÷ 100)
Lower Band = Daily High - (ES Price × VIX ÷ √252 ÷ 100)
The calculation uses the square root of 252 (trading days per year) to convert annualized VIX volatility into an expected daily move, then scales it as a percentage adjustment from the current day's extremes.
Features:
Real-time band calculation that updates throughout the trading session
Upper band (green) extends from the current day's low
Lower band (red) contracts from the current day's high
Inner upper band (green) at 50% of expected move
Inner lower band (red) at 50% of expected move
Middle Inner upper band (green) at 80% of expected move
Middle Inner lower band (red) at 80% of expected move
Outer upper band (green) at 150% of expected move
Outer lower band (red) at 150% of expected move
Shaded zone between bands for visual clarity
Information table displaying:
Current ES price and VIX level
Running daily high and low
Current upper and lower band values
ADX Breakout Enhanced Signal🥋 Trading Dojo – ADX Breakout Enhanced Signal
This indicator combines the trend-strength power of the ADX with dynamic breakout-based signals, designed for traders who want more frequent and higher-probability entries on timeframes like 1 hour.
The core logic focuses on:
📌 1. Trend Strength Detection with ADX
The indicator evaluates whether the market is showing a strong directional trend using an optimized ADX.
When ADX rises above the configured threshold, the system interprets that price has enough momentum to validate an entry.
📌 2. Breakout Entry Logic
It identifies points where price breaks recent highs or lows, confirming the start or continuation of movement.
This breakout-based approach produces more entries than traditional ADX strategies alone.
📌 3. Clear and Simple Signals
🟩 Long when price breaks a recent high with strong trend confirmation.
🟥 Short when price breaks a recent low with strong trend confirmation.
📌 4. Built-In Automated Alerts
The indicator automatically generates JSON alerts ready for use with automation tools such as trading bots, webhooks, BingX, 3Commas, Discord bots, and more.
🎯 Purpose of the Indicator
To provide more frequent, well-distributed, and momentum-validated entries, while maintaining simplicity and speed — perfect for real-time decision-making.
Perfect For:
Intraday trading
1h, 30m, and 15m timeframes
Breakout-based strategies
Automated trading systems

XAUUSD 9/1 and 6/4 zone lane chart (BUY zone and SELL zone)XAUUSD 9/1 and 6/4 zone lane chart (BUY zone and SELL zone)

PersonsPivots-UpdatedThe script was written by another script writer and it worked fine with Futures, Forex and ETFs but had a Runtime error for stocks so I had a coder friend do a debug

ES-VIX Daily Price Bands - Inner bands (80% and 50%)ES-VIX Daily Price Bands
This indicator plots dynamic intraday price bands for ES futures based on real-time volatility levels measured by the VIX (CBOE Volatility Index). The bands evolve throughout the trading day, providing volatility-adjusted price targets.
Formulas:
Upper Band = Daily Low + (ES Price × VIX ÷ √252 ÷ 100)
Lower Band = Daily High - (ES Price × VIX ÷ √252 ÷ 100)
The calculation uses the square root of 252 (trading days per year) to convert annualized VIX volatility into an expected daily move, then scales it as a percentage adjustment from the current day's extremes.
Features:
Real-time band calculation that updates throughout the trading session
Upper band (green) extends from the current day's low
Lower band (red) contracts from the current day's high
Inner upper band (green) at 50% of expected move
Inner lower band (red) at 50% of expected move
Middle Inner upper band (green) at 80% of expected move
Middle Inner lower band (red) at 80% of expected move
Shaded zone between bands for visual clarity
Information table displaying:
Current ES price and VIX level
Running daily high and low
Current upper and lower band values

ES-VIX Daily Price Bands - Inner bandsES-VIX Daily Price Bands
This indicator plots dynamic intraday price bands for ES futures based on real-time volatility levels measured by the VIX (CBOE Volatility Index). The bands evolve throughout the trading day, providing volatility-adjusted price targets.
Formulas:
Upper Band = Daily Low + (ES Price × VIX ÷ √252 ÷ 100)
Lower Band = Daily High - (ES Price × VIX ÷ √252 ÷ 100)
The calculation uses the square root of 252 (trading days per year) to convert annualized VIX volatility into an expected daily move, then scales it as a percentage adjustment from the current day's extremes.
Features:
Real-time band calculation that updates throughout the trading session
Upper band (green) extends from the current day's low
Lower band (red) contracts from the current day's high
Inner upper band (green) at 50% of expected move
Inner lower band (red) at 50% of expected move
Shaded zone between bands for visual clarity
Information table displaying:
Current ES price and VIX level
Running daily high and low
Current upper and lower band values

ES-VIX Daily Price BandsES-VIX Daily Price Bands
This indicator plots dynamic intraday price bands for ES futures based on real-time volatility levels measured by the VIX (CBOE Volatility Index). The bands evolve throughout the trading day, providing volatility-adjusted price targets.
Formulas:
Upper Band = Daily Low + (ES Price × VIX ÷ √252 ÷ 100)
Lower Band = Daily High - (ES Price × VIX ÷ √252 ÷ 100)
The calculation uses the square root of 252 (trading days per year) to convert annualized VIX volatility into an expected daily move, then scales it as a percentage adjustment from the current day's extremes.
Features:
Real-time band calculation that updates throughout the trading session
Upper band (green) extends from the current day's low
Lower band (red) contracts from the current day's high
Shaded zone between bands for visual clarity
Information table displaying:
Current ES price and VIX level
Running daily high and low
Current upper and lower band values

@Complete Squeeze Cycle Detector v2.0 FINALDescription:
The Complete Squeeze Cycle Detector identifies and tracks the full lifecycle of squeeze formations, from pre-squeeze consolidation through active squeeze periods to squeeze completion. The indicator systematically detects the characteristic conditions that precede and accompany squeeze events.
The indicator monitors multiple factors associated with squeeze development including:
• Volatility compression relative to recent volume activity
• Elevated market stress conditions as measured by VIX levels
• Momentum compression through rate of change measurements across multiple time periods
• Alignment of multiple exponential moving averages indicating consolidation
The squeeze cycle is classified into three distinct phases: Pre-Squeeze Setup, Active Squeeze, and Squeeze Complete. Each phase is identified based on threshold levels of multiple compression metrics, with adjustable sensitivity settings to control the strictness of detection.
The indicator provides visual identification of each phase through labels, background coloring, and an optional dashboard, allowing users to distinguish between the preparation phase where volatility contracts, the active squeeze phase where compression reaches critical levels, and the completion phase where the squeeze releases and directional movement resumes.
This systematic approach enables users to identify squeeze formations throughout their complete development cycle rather than focusing only on the breakout phase.
