BANKNIFTY
IPB_CamBOTSThis is an intraday strategy.
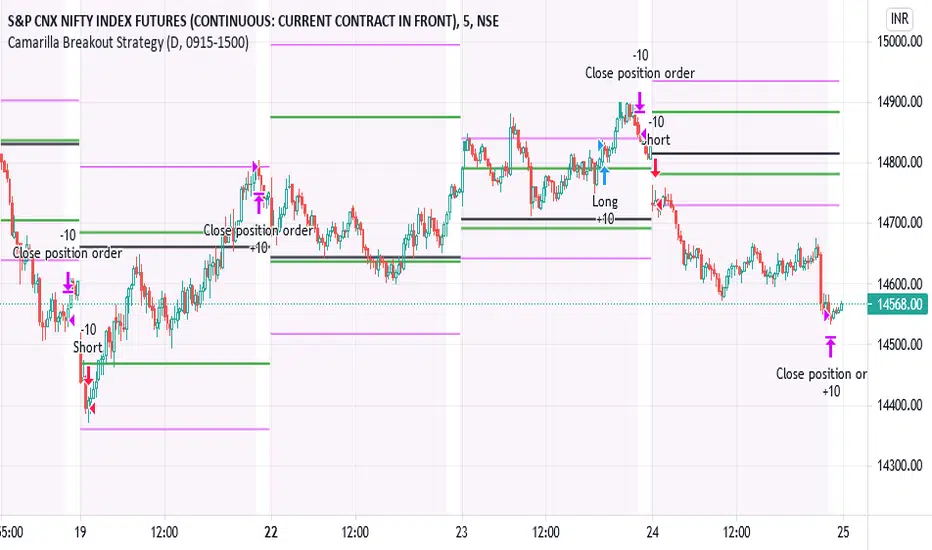
Camarilla Level 3 breakout strategy.
Conditions are long above Camarilla R3 only under certain circumstances related to the distance between Central Pivot and Level 3 pivots and also the location of the Opening price of the day.
Exit is assumed to be at the end of the day. It is suggested to exit the trade if price falls back below Camarilla R3 in case of longs.
Logic similar for shorts as well but on the other end.
Position Sizing :
10 lots of Nifty futures assumed for backtesting.
The margin required for 10 lots of Nifty futures is around 10-12 lacs. Hence 25,00,000 capital is assumed which is roughly double the margin required for taking positions in the real market. In other words not all capital is used if 10 lots of futures is traded. Brokerage assumed is 50 per order as against the 20 per order in real market with respect to retail brokers. Currency assumed is INR. However there is no option to choose INR and therefore you might see the currency as USD. Hence please assume the currency as INR.
Disclaimer:
Past performance does not reflect the future perfomance. Hence the author is not responsible for any trading loss arising out of this strategy. Please use at your own risk and responsibility.
Zeta Bank Nifty & Nifty50The Problems of Day Trading
Lot many indicators are made by thousands of traders all over the world, which give good or not so good signals.
Despite good signals, many times we end up in loss because we could not take entry or could not exit at appropriate time-point.
Sometimes even winning position also comes into loss if market takes back whatever you gained till a certain point.
Also, there are professional, office going people who can not take trades on their own during office-hours.
To solve all these problems, you need an automated strategy which could take trades, trail your stop loss up and exit when stop loss gets hit.
Strategy also lets you know how a certain formula performed over a period of time.
How this strategy works?
The strategy generates trades with 02 type of formulas:
1. It seeks price breaking away from support/resistance (up or down) which is calculated with the help of automatically detected pivot points.
2. It seeks reversal based upon RSI and Price Action.
If there are no open positions right now and a Buy/Sell signal comes, 1 lot is bought or sold.
This position is closed when either Stop Loss gets hit or when opposite signal comes.
What are other features of the strategy
1. You can set the session time when you want the strategy to take trades. For example, if you want to take trades only between 10:00 hrs and 14:00 hrs, that can be set in settings.
2. You can set up your own Stop Loss percentage, but the optimum value, as we found fit in backtesting, is set at 0.5%
3. There is a max. daily loss safeguard also which by default is set at 5%. It means if a series of losses happen during the day and your capital loss reaches this maximum loss value set by you, the strategy stops trading for that day.
4. There is an option to close all positions by End of Day. By default, this feature is disabled, but you can enable it if you don't want to carry forward your positions.
5. A label displayed at the last bar gives you cumulative profit or loss and daily profit/loss statistics.

IPB_AOPM_BOThis is an intraday trading strategy.
Concept :
Underlying concept is that Amateurs open the market and Professionals close the market. Hence this system tries to capture the breakout in the afternoon session. After One PM Breakout (AOPM breakout). This essentially means that one has to go long once the high of the market till 1 pm is broken out and similarly go short once the low of the market till 1 pm is broken down.
Position sizing:
This strategy assumes taking 10 lots of Indian Market Index which approximately requires a margin of around INR 25,00,000. Hence capital is chosen as INR 25,00,000. Currency is assumed to be INR , however the system shows USD as currency as there is no INR option available. Commissions assumed to be at INR 50 per order as against the INR 20 per charged by retail brokers in India in real world market.
Disclaimer:
Past performance is not representative of future performance. Hence the author is not responsible for any trading loss arising out of implementing this strategy. Hence please implement at your own risk. Trading can result in loss of entire capital.

RR 2
Software signal with Trend of the market/Central Pivot Range combined with RR1 for better results.

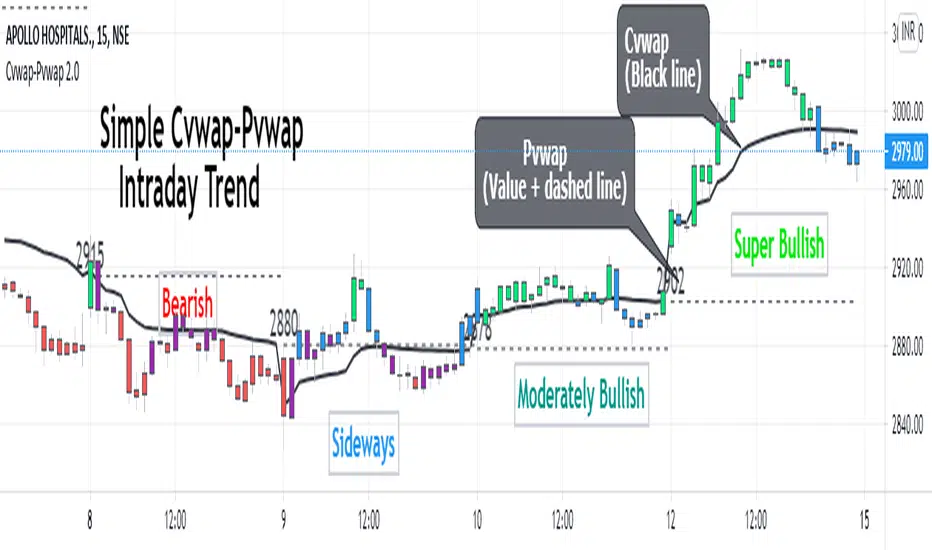
Cvwap-Pvwap 2.0A simple vwap based Intraday trend indicator.
Volume-Weighted Average Price (VWAP) - the average price weighted by volume, starts when trading opens and ends when it closes. This can help institutions buy or sell in large orders, without disturbing the market.
After buying or selling, institutions compare instrument price to closing VWAP values at end of the day.
For big financial institutions;
A buy order executed below the VWAP value, considered a good fill because the security was bought at a below average price.
A sell order executed above the VWAP would be deemed a good fill because it was sold at an above average price.
Simple price based moving average is not helpful for them; = as it doesn't incorporates volume traded. Hence - VWAP :)
So how it helps us in decoding the IntraDay-trend? - Through a 2 day vwap co-relation.
So, Closing value of previous day vwap = Pvwap
Today's running vwap = Cvwap
Defining the IntraDay Trend:
Moderately Bullish = candle closing price above Pvwap but below Cvwap
Super Bullish = Closing price is above both (Cvwap and Pvwap)
Moderately Bearish = Closing price is above Cvwap but below Pvwap
Super Bearish = Closing Price is below both (Cvwap and Pvwap)
A big gap between the Cvwap and the candle closing price defines the strong participation from institutions in that direction. (Strong Trend)
Moving with the smart money, in the overall trend is a wise decision for any intraday trader and this helps at its best.
IndianPivotBoss_TCAPConcept :
This strategy aims to capture the trend. It is deemed that a possible trend emerges when price goes past a pre-determined boundary. The predetermined boundary is a function of previous day close, average daily range and a standard normal distribution Z score.
Conditions :
Buy when price crosses the upper boundary.
Exit when price falls below the upper boundary or at close of the day.
Short when price crosses down the lower boundary.
Exit when price moves above the lower boundary or at close of the day.
Position Size :
A capital of 125,000 is selected. (Margin for 1 lot of Bank Nifty Futures is Indian Rupees 125,000). Please assume the currency as Indian Rupees instead of USD as there is no option to select Indian Rupees as Currency.
In real market, the margin required for 1 lot of Bank Nifty futures trading is around INR 125,000 which is why initial capital of INR 125,000 is chosen.
1 lot trade is considered. No compounding is assumed as evident from the results where all trades are of 1 lot only.
Commission of 0.05% (approx Rs 312.5, if the index is 25000) is used, which is very conservative compared to the usual commission of Rs 20 per order charged by leading retail brokers in India.
Disclaimer :
Past results are not reflective of future. The author is not responsible for any loss on account of anyone trading this strategy.

NIKI MSS BANKNIFTYThis is the strategy version of my old indicator NIKI BANKIFTY. It is more suitable for day trading with a 5 min chart. It is more profitable in BANKNIFTY future. It is based on multiple Supertrend, moving average, Donchain channel, and linear regression. The background color indicates the main trend and the color of the candle represents a short-term trend. The label with TA and SL represents more profitable entry positions. The label RE: LE and RE: SE stands for re-entry positions or signals with less accuracy. Consider the direction of the linear regression line to take trades on re-entry positions. The yellow candle indicates the entry and the blue candle represents the target or stop-loss.
The backtest results are based on BANKNIFTY last year's data. It has an initial capital of 100000 and the size of the lot is 1. The target is 0.3% and stop-loss is 1.5%. It exactly not following the stop loss, the trade will exit based on the Donchain channel breakout. It appears on the chart as a blue candle. The commission paid is 20 cash per trade and the slippage is 5 ticks per trade. Some of the Indian broker's commission is only 10 cash per trade. Adjust the commission as per your broker. Trades are conducted based on the intraday time in India set from 9.20 am to 2.25 pm. All positions will get square off at 3.00 pm. It will execute a maximum of 4 trades per day. All other parameters are suitable for Robo trading with Indian stock brokers.
Contact us using the link given below to obtain access to this indicator.

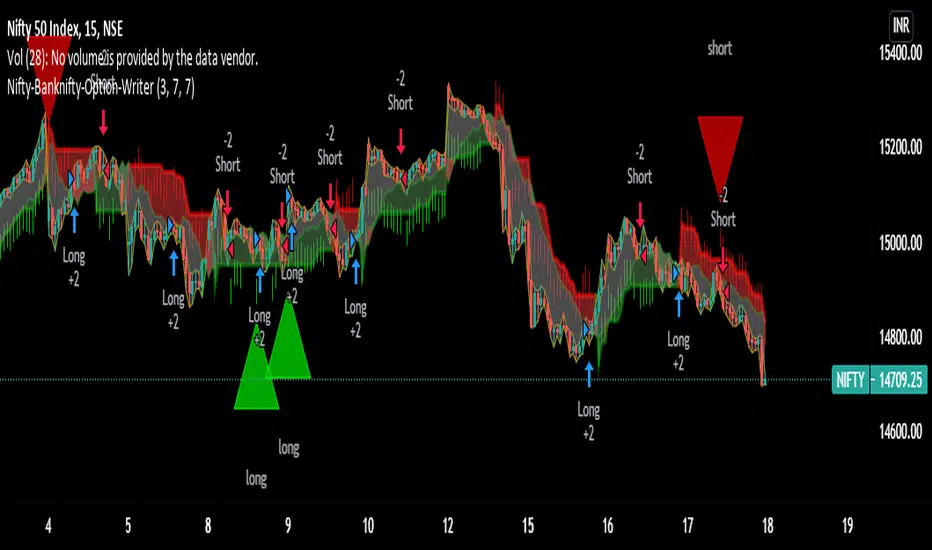
Nifty-Banknifty-Option-WriterNifty-Banknifty-Option-Writer tool is having signals like below
1) Bullish signal for taking long trade
2) Bearish signal for taking short trade
3) Triangle UP signal for trend change Long trade
4) Triangle Down signal for trend change Short trade
5) Big Arrow down signal for closing long trade if u have any short trades
6) Big Arrow UP signal for closing Short trade if i have any long trades
7) This tool is having three zone GREEN, RED and GRAY
8) small red arrow and small green arrow
===========================================================================================
How to use this tool:-
You should take long trade in index call option or sell put option when you will get Bullish signal or Big green Triangle and book the profit when you get any red signal either Its Big red triangle or Bearish signal or big downward red arrow close long trade or small red arrow.
Similarly you can take long trade for Index put option or sell call option for Short trade when you get Bearish signal or Big red triangle and book the profit when you will get close long big green arrow signal or small green arrow or Bullish signal or Big green triangle.
-If candle formation is having above GREEN and GRAY zone then it signifies strength is bullish and remain in Long trade till you are not getting close long trade signal or small red downward arrow signal.
-If candle formation is happening below RED and GRAY zone then it signifies strength is bearish and remain in short trade till you are not getting close short trade signal or small green upward arrow signal.
I have taken combination of ATR, Super trend and RSI to get the trend and trend change of underlying.
this tool i have created for any underlying not specific to Nifty or Banknifty though I have used this name so Indian can take benefit for Index trading.
Still didn't understand then ping me or give me call on my number given in signature i will make zoom call with you so will understand how to use this script.
=============================================================
I have taking consideration of Bullish and Bearish trade for strategy and its giving its optimal result in 1 hr time frame.
I have added commission/slippage for trade so actual result can be displayed in strategy tester.
Ping me or DM me to subscribe this indicator.
I have given all my indicator details below link (Signature URL). You can check indicators and call me on given number or email me on given email to access the scripts and indicators. Telegram link is also given you can ping me there.
--------------------------------------------------------------------------------------------------------------------------------------
Disclaimer : Past performance of the indicator is not giving guarantee for future performance as well, it may change as per market condition.
-------------------------------------------------------------------------------------------------------------------------------------
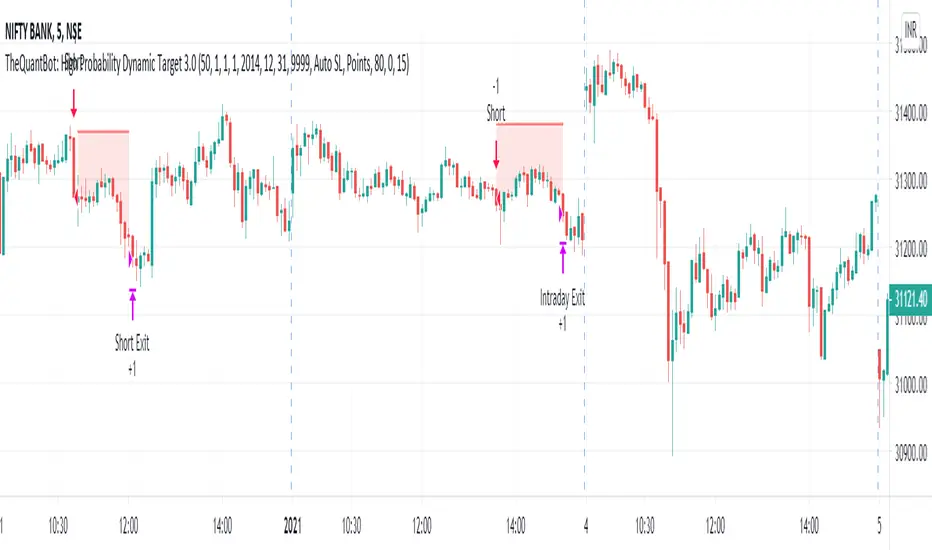
TheQuantBot: High Probability Dynamic Target 3.0This is the first indicator of TheQuantBot series. This is purely for educational purpose and this indicator might get modified in future as well. This is for intraday purpose and works on BANKNIFTY.
Trading Logic behind this indicator:
It it based on price action and considers support and resistance for entry and exit points.
If the support is broken then it enters long whereas if the resistance is broken it enters short.
The long and short entries are filtered by two other technical indicators like EMAs.
It will not take a trade if the market is highly volatile.
In input parameters you can set your risk taking ability based on which it sets the risk: reward ratio.
The default quantity entered in this indicator is 1 with initial capital set to 100000.
If you consider Indian discount brokers, you can buy 50 quantity at the same price, you can increase the quantity to check results with different scenarios.
In input parameters there are three options to set Stop Loss, you can set Auto SL , Manual SL with and without Trailing option, you can set Stop Loss both in points as well as percentage .
The profit target are dynamic in nature and it depends on the market volatility.
You can play around the back test start and end date to see its historical performance over different span of time.
This results are based on back tested data, in real scenario many other factors might differ the results.
*********************************************PM us to obtain access******************************************************************************************************************************************
PpSignal Impulse V1.20PpSignal impulse is based on the concept of relative strength index, Rsi its acronym in English.
Although the calculation is similar, it differs in how the force is calculated. To calculate the force we are based on the analysis of the trend through a WMA.
It is important to clarify that you must do a prior analysis of the asset that you are going to trade, such as resistance supports, channels, chart formations, etc.
Buy when the sign is white.
Sell when the signal is red.
You can also perform buy or sell boosts if you activate impulse 2 and 3.

MAST TrendHello Traders !!
This is a simple super trend based MAST trend.
By default the supertrend is 10 period with 3 ATR multiplier.
A moving average is used to benefit from the pullback entries.
Bullish Pullback : Price above Supertrend & below MA
Bullish: Price above Supertrend and above MA
Bearish pullback : Price below Supertrend & above MA
Bearish : Price below Supertrend & below MA
Refer to investopedia or any relevant articles for in detail about Supertrend.

Vwap Pvwap Intraday Trend - NiftyKishoreHello Traders !!
This is a simple trend identification script which is based on the current vwap (Cvwap) and previous vwap (Pvwap).
Pvwap in the sense; previous day vwap closing value.
Bullish: price is closing above the current day vwap and previous day vwap(pvwap).
Bearish : Price is closing below the current day vwap and previous day vwap (pvwap).
Made a change to the barcolors as well :)
Bullish
Green Bar: close is above Pvwap and Cvwap.
Blue bar: close is above Pvwap but below Cwap.
Bearish
Red bar: close is below Pvwap and Cvwap.
Purple bar: close is below Pvwap but above Cvwap.
Simple but effective
Cheers !!
PpSIgnal Algorithm Trade System BANKNFTY Only for trading BankNifty Fut.
Use in 15 minutes time frame.
Initial capital 1000 Use Indian Rupee , you buy the maximum of the capital since it represents little money at the beginning, you can risk less capital in percentage, for example, 10% of 1000 IR.
Commission 0.006% per contract, we use the commission of one of the best-known brokers.
You can adjust the slippage you consider.
Date of time strategy
strategy star from 05/2019, You can choose the start day and the end day of the backtesting test.
Money management
Take profit to buy 1%
Stop Lose sell 1%
Take Profit 1%
Stop Loss 1%
How it works?
The system works by looking for trends and volatility in a 15-minute time frame.
Once the system finds the trend and volatility, it opens an operation looking for a profit at the buy of 1% and loss control of 1%. For Sell operations, it will seek a 1% profit with a 1% loss control.
Enjoy it ....date expired 17 December 2020

PpSignal Momentum TraderThis is a combination of the PERCENTAGE of PRICE OSCILLATOR (PPO) and Momentum.
When both oscillators are up in the same direction it is buying (green bottom and green oscillators), when both oscillators are down it is sell (red bottom and red oscillators. When they do not agree (silver bottom) it is to keep doing nothing .
You can also see the change in trend with the candles as well. same colors as the background and the oscillators.

pSignal CFB and Slope Trend Folow This indicator shows the trend of an asset (nifty, crypto, forex, stock, etc., taking as a starting point the volatility and direction of the market.
When the moving average slope crosses up CFB (see CFB explanation below) it is BUY.
When the Moving Average Slope crosses CFB down it is sell.
The system also has a support and resistance (daily, weekly, or mouth) identifier.
The alarm of resistance or support signal: When price close and volume break daily support or resistance the general system is a visual signal.
Bull Wick= the high price broke the resistance.
Bear wick = the low price broke the support.
Break Out color blue color = the close price and the volume broke the resistance.
Break Out color maroon color = the close price and the volume broke the support.
The system also has the Bollinger bands that show us the volatility of the market and when it is up or down. Read more about the use of the Bollinger band
CFB
his indicator was designed to filter out lower price actions for a clearer view of trends. Inspired by QQE's volatility filter, this filter applies the process directly to price rather than a smoothed RSI . Range Filter and bands are now calculated in a singular function. There are now two different calculation methods for the filter. Select the type you want to use through the "Filter type" entry. Type 1 is the original formula. Multiple range size methods are now available.
You can choose between the following scales:
- Points
- Pips (Works best with currency pairs, obviously)
- Ticks -% of the price - ATR - Average change (default. This is the original sizing method). - Standard Deviation
- Absolute (absolute numerical value)
- Smoothing with the range elder is now optional, and you can specify its smoothing length.
Smoothing only affects dynamic scales (ATR, average change, and standard deviation).
- Filter movement can now be determined using highlights or closing price. This can be specified through the input.

PpSIgnal Quantile Band 4.0Quantile band: In statistics and the theory of probability, quantiles are cutpoints dividing the range of a probability distribution into contiguous intervals with equal probabilities, or dividing the observations in a sample in the same way.
Quantitative Qualitative Estimation is based on a rather complex calculation of the smoothed RSI indicators.
The QQE indicator consists of a smoothed Relative Strength Index ( RSI ) indicator and two volatility-based trailing levels (fast and slow). The Fast Trailing Level (TL) and Slow TL are constructed by calculating the ATR of the smoothed RSI over n-periods and then further smoothing the ATR using an additional n-periods Wilders smoothing function. This smoothed ATR of RSI is then multiplied by the Fast and Slow ATR Multipliers to calculate the final Fast and Slow Trailing Levels.
Buy when the Quantile band is green.
Sell when the Quantile band is red.
when the quantile band is gray hold

BANKNIFTY Auto-Trading Indicator based on Market InternalsNSE:BANKNIFTY
Dear Fellow Traders,
This indicator for BankNifty INTRADAY trading is based on Market Internals - Advance/Decline Volume and TICK
These Market Internals, also known as Breadth Tools helps in identifying the overall market sentiment.
Just doing some technical analysis on Price action doesn't provide good results.
Price action along with Volume gives a meaningful insight and helps in improving the accuracy.
But simple VOLUME information is not sufficient to take a directional view on the markets. A segmentation of POSITIVE and NEGATIVE volume gives a clear picture of the symbol movement.
We can get the volume information FOR ANY STOCKS anywhere. But, VOLUME INFORMATION FOR AN INDEX ALONG WITH POSITIVE AND NEGATIVE VOLUMES are not available in normal trading platforms. And this tool provides the exact feature.
In a nutshell,
1) THIS TOOL PROVIDES BUY/SELL INDICATIONS on the BANKNIFTY based on the underlying stocks' PRICE AND VOLUME
2) THE VOLUME INFORMATION IS BIFURCATED INTO POSITIVE AND NEGATIVE VOLUME , WHICH HELPS IN DECIDING THE MARKET DIRECTION.
P.S: This is an Invite-only indicator. Inbox me for getting access.

Bank Nifty VWAPBANK NIFTY INDICES IS WIEGHTAGE OF 12 STOCKS AS DECIDED BY EXCHANGE.
BANK NIFTY VWAP CALCULATES COMBINED VWAP OF THESE 12 STOCKS AND GENERATES VWAP FOR BANK NIFTY

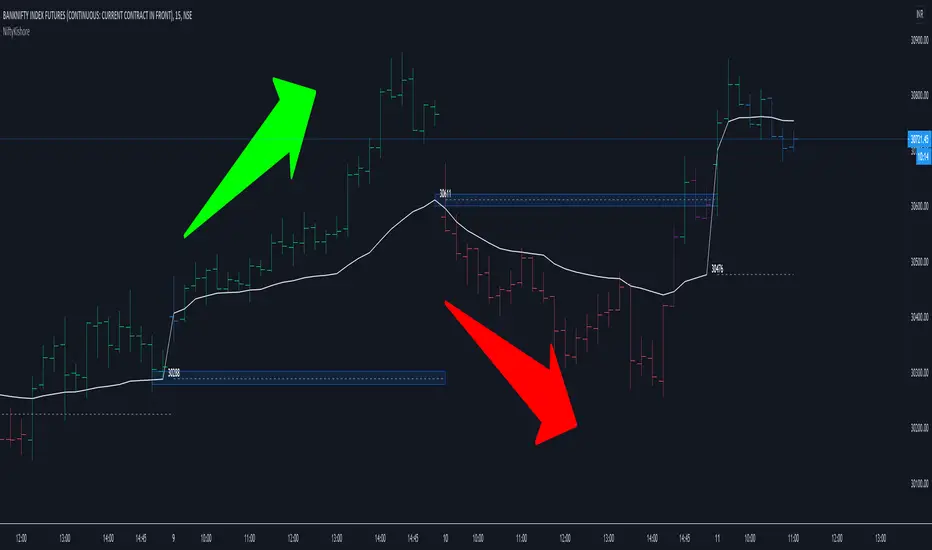
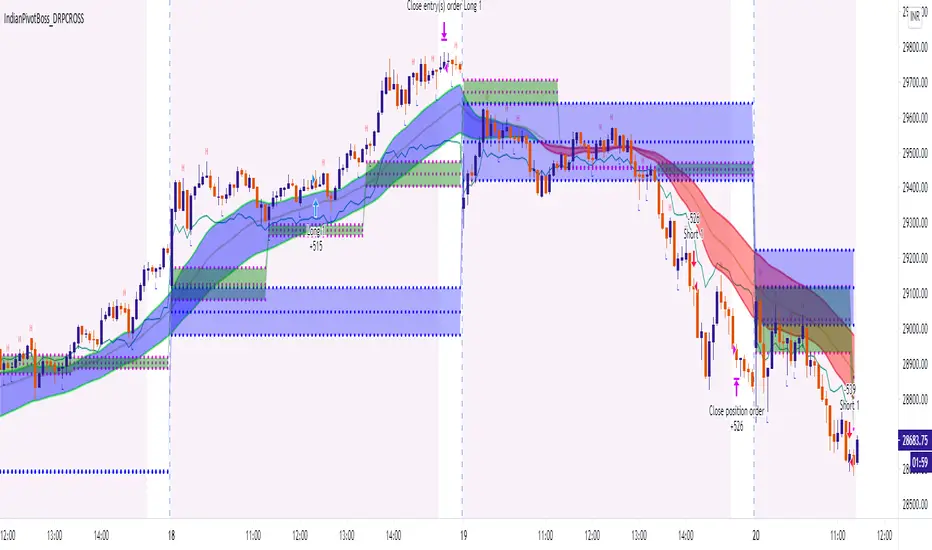
IndianPivotBoss_DRPCROSS_V2This strategy is an intraday strategy based on Developing pivot cross.
Long is generated when price crosses above developing pivot.
Short is generated when price crosses down developing pivot.
It also looks into developing pivot width for an expansion before taking into consideration of the above signals thereby providing signals only when a possibility of a trend emerges.
Pls note that past performance is not indicative of future performance.
Hence use it at your own risk. There is no guarantee for profits and there is always a possibility of losing entire capital in trading.
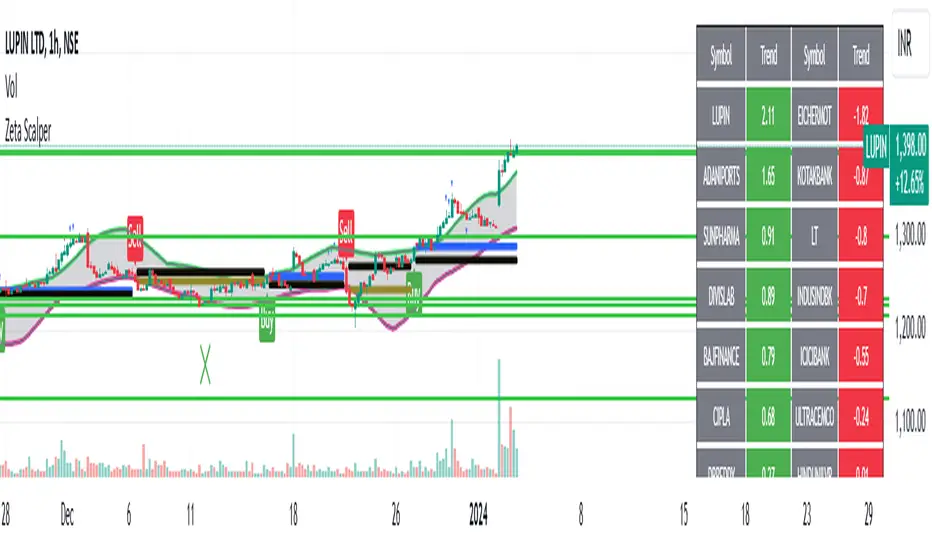
Zeta ScalperWhat is Scalping?
Scalping is a trading strategy aimed at profiting from quick momentum in a volatile index or stock.
Traders who use such strategies place anywhere from 10 to a few hundred trades in a single day.
The idea behind such type of trading is that small moves in an index or stock price are much easier to capture than the larger moves.
Traders who use such strategies are known as scalpers. When you take many small profits a number of times, say 10 points scalped 20 times per day, they can easily add up to large gains.
An Option Buyer's Biggest Enemy is Time Decay and when you scalp, you do not allow the time decay to eat your Option Premium as your Entry and Exit is often quick enough.
What is Zeta Scalper?
Zeta Scalper indicator is a momentum based indicator which tries to detect momentum based upon a number of Candle Stick Patterns.
When it thinks a move has the potential to turn into a big move, it generated its Buy/Sell Signals.
It is a well known fact that actual drivers of the market are Big Institutions, Mutual Funds & Big Guys with deep pockets.
They have large amounts of money to invest and they buy & sell in bulk.
When they buy, often their objective is to buy at lower levels (below average price of the day) & when they sell they sell at higher levels (above average price of the day).
Zeta Scalper seeks to detect this activity. When aggressive buying or selling starts where Buying & Selling Forces become unequal, the Price starts moving in one direction with candles making Higher Highs or Lower Lows.
Zeta Scalper detects these Higher Highs or Lower Lows and generates Buy or Sell signals when this happens.
In order to use this indicator, simply deploy this on your chart, and wait for Buy/Sell signals.
It works on all time frames including 1 min. 3min. 5min. & 10min. etc.
When a Buy Signal is followed by Sell signal (let it be after 3 - 4 candles or after many candles) or vice-versa, you have to switch your position to make most of the reverse move.
It is a general purpose indicator and may be used on stocks, commodities and currencies alike and is not meant for any specific market.
How to Take Buy/Sell Entry with Zeta Scalper?
Whenever you see a Buy Signal, mark its closing price with a horizontal line and as soon as a candle breaks this candle's High, it is time for you to take Entry.
Your STOP LOSS could be just 0.5% below your Entry Price, hence, no big loss even if things go wrong.
Keep moving your STOP LOSS up as the price moves in your favour and when market turns around and you see a SELL signal, it is time to book your BUY position profit and take Entry on SELL Side now and so on.
How to get this indicator?
This is invite-only indicator. Get in touch with us using information given below in Signature field to try this tool FREE.
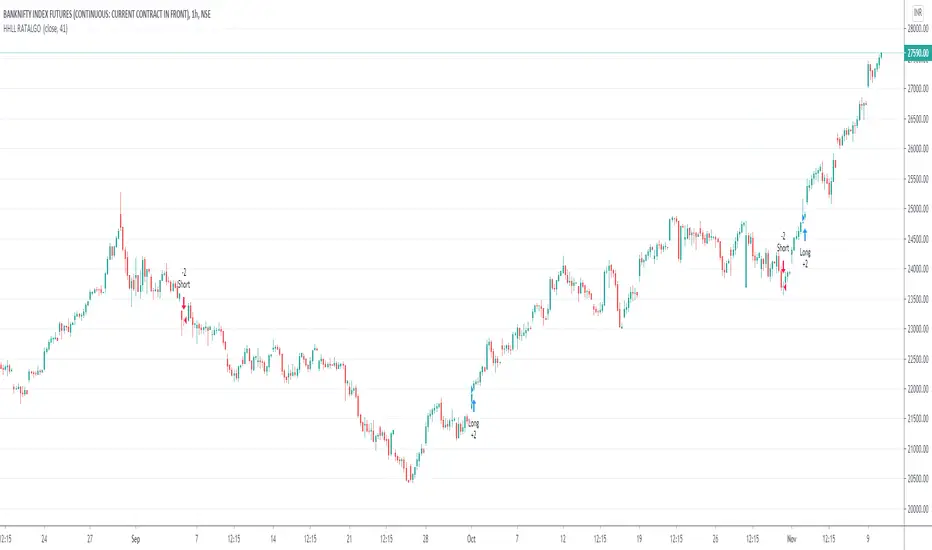
HigherHigh LowerLow RATALGOHi Traders,
This is Trend following strategy.
This strategy calculates the higher high or lower low of a look back period. If the previous high or low is breached, a signal to enter market is given.
This strategy works well with regular candles and line charts if you find the right settings and chart time frame.
Give it a try with your settings & post your feedback and suggestion if any for improvement.
I had automate this strategy with broker using Trading view Alert feature to get some live results on NSE:Banknifty1!
BANKNIFTY - Anchored VWAP
An attempt to make Anchored VWAP for NSE:BANKNIFTY from Volume of underlying securities.
Notes :
- To cross check one may verify by changing Symbol to any stock and use in-built VWAP indicator
- Works only with BANKNIFTY and stocks. Does not work with other NSE Indices
