Galactic Bollinger Bands Envelope (GBBE)The Galactic Bollinger Bands Envelope (GBBE) is a technical indicator that is used to identify potential areas of support and resistance in a trading instrument's price. The GBBE indicator is similar to the traditional Bollinger Bands (BB) indicator but offers certain advantages and improvements over the standard BB indicator.
The GBBE indicator is based on a similar concept to the BB indicator, where the bands are plotted around a moving average of the price. However, the GBBE indicator uses a more sophisticated calculation that accounts for the volatility of the instrument being analyzed. The GBBE indicator is designed to adjust to changing market conditions and provide more accurate signals.
One of the key strengths of the GBBE indicator is that it offers a clearer signal for traders to identify potential buy and sell opportunities. This is because the GBBE indicator has a tighter range compared to the standard BB indicator, which can sometimes generate false signals due to the wider range.
The GBBE indicator also has the advantage of being more responsive to sudden price movements, which makes it particularly useful for short-term traders who need to make quick decisions. The GBBE indicator is able to adjust to sudden market changes, which means that traders are less likely to miss out on trading opportunities.
Another advantage of the GBBE indicator is that it can be customized to suit individual trading styles and preferences. Traders can adjust the input parameters of the GBBE indicator, such as the length of the moving average and the multiplier, to optimize the indicator for different market conditions.
In conclusion, the Galactic Bollinger Bands Envelope (GBBE) is a powerful technical indicator that offers several advantages over the standard Bollinger Bands (BB) indicator. The GBBE indicator is designed to be more responsive and accurate, which makes it particularly useful for short-term traders. The GBBE indicator also offers traders more flexibility to customize the indicator to suit individual trading styles and preferences. Overall, the GBBE indicator is a valuable tool for traders looking to identify potential buy and sell opportunities in the markets.
BB

Bollinger Bands [Anan]Hello friends,,
This is my own enhanced version of Bollinger Bands based on some backtesting,,
It's the same logic behind standard BB but instead of using length(period), I created a formula and used a "factor" to scale it up/down.
The formula is just average of averages of averages... (But it's backtested with good results)
I also added two standard deviations so that the distance between them will be the (over-bought/over-sold zones)
And finally added a squeeze indicator to identify the predicted price action movements..
You have the options to control everything like:
-Timeframe
-Source
-Calculation Method
-Length Factor
-StdDev#1
-StdDev#2
-Squeeze Factor
-Squeeze Threshold

Strategy Myth-Busting #7 - MACDBB+SSL+VSF - [MYN]This is part of a new series we are calling "Strategy Myth-Busting" where we take open public manual trading strategies and automate them. The goal is to not only validate the authenticity of the claims but to provide an automated version for traders who wish to trade autonomously.
Our seventh one we are automating is the "Magic MACD Indicator: Crazy Accurate Scalping Trading Strategy ( 74% Win Rate )" strategy from "TradeIQ" who claims to have backtested this manually and achieved 427% profit with a 74% winrate over 100 trades in just a 4 months. I was unable to emulate these results consistently accommodating for slippage and commission but even so the results and especially the high win-rate and low markdown is pretty impressive and quite respectable.
This strategy uses a combination of 3 open-source public indicators:
AK MACD BB v 1.00 by Algokid
SSL Hybrid by Mihkel00
Volume Strength Finder by Saravanan_Ragavan
This is considered a trend following Strategy. AK MACD BB is being used as the primary short term trend direction indicator with an interesting approach of using Bollinger Bands to define an upper and lower range and upon the MACD going above the upper Bollinger Bands, it's indicative of an up trend, where as if the MACD is below the lower Bollinger Band, it's indicative of a down trend. To eliminate false signals, SSL Hyrbid is used as a trend confirmation filter, confirming and eliminating false signals from the MACD BB. It does this by validating the price action is above the the EMA and the SSL is positive that is a confirmation of an uptrend. When the price action is below the EMA and the SSL is negative, that is an confirmation of a downtrend. To avoid taking trades during ranged markets, VSF Buyer's Strength is used so the buyers/sellers strength and must be above 50% or the trade will not be inititiated.
Trading Rules
5 min candles but other lower time frames even below 5m work quite well too.
Best results can be found by tweaking these 2 input parameters:
Number Of bars to look back to ensure MACD isn't above/below Zero Line
Number Of bars back to look for SSL pullback
Long Entry when these conditions are true
AK MACD BB BB issues a new continuation long signal. A new green circle must appear on the indicator and these circles should not be touching across the zero level while they were previously red
SSL Hybrid price action closes above the EMA and the line is blue color and then creates a pullback . The pullback is confirmed when the color changes from blue to gray or from blue to red.
VSF Buyers strength above 50% at the time the MACD indicator issues a new long signal.
Short Entry when these conditions are true
AK MACD BB issues a new continuation short signal. A new red circle must appear on the indicator and these circles should not be touching across the zero level while they were previously green
SSL Hybrid price action closes below the EMA and the line is red color then it has to create a pullback . The pullback is confirmed when the color changes from red to gray or from red to blue.
VSF Sellers strength above 50% at the time the MACD indicator issues a new short signal.
Stop Loss at EMA Line with TP Target 1.5x the risk
If you know of or have a strategy you want to see myth-busted or just have an idea for one, please feel free to message me.

Didi's Needles setup screener Didi's Needles setup screener
I basically used the screener created by QuantNomad , made some modifications and used the indicators from the setup
Indicators used:
Didi Index, ADX, Bollinger Bands, Trix and Stochastic.
Signals from each column:
Column 'Symbol'
Blue Symbol: When the Didi, ADX and BB are with buy signals
Yellow Symbol: When Didi, ADX and BB are with sell signals
Red Symbol: When ADX, BB, Trix and Stoch are with signals to close the trade
ADX' Column
ADX Kick: When the ADX has given a Kick (Top or Bottom). ADX was rising and starts to fall
Uptrend: When the ADX is up and below the Level and the DI+ is above the DI-
Uptrend Strong: When the ADX is up and above the Level and the DI+ is above the DI-
Uptrend Falling: When the ADX is below and above the Level and the DI+ is above the DI-
Downtrend: When the ADX is below the level and the DI- is above the DI+
Downtrend Strong: When the ADX is above the level and the DI- is above the DI+
Downtrend Falling: When the ADX is below the level and the DI- is above the DI+
Didi' Column
Buy Alert: When the Fast Average crosses the Median to the upside (as long as it is not a False Point) = Needle Alert
Sell Alert: When Fast Average Crosses Median Down (as long as it is not a False Point) = Needle Alert
Needle Buy: When slow average crosses the median down = Needle confirmation
Needle Sell: When slow moving average crosses the median to high = Needle confirmation
Fake Buy: When the fast moving average crosses the median and the slow moving average is above the median and rising = False Point (Sell signal or if you are positioned on the buy side, hold the buy or raise the hand)
Fake Sell: When the fast moving average crosses the median and the slow moving average is below the median and falling = False Point (Buy signal or if you are positioned on the sell side, hold the sell or raise your hand)
BB' Column
Open Rising: When the Bollinger Bands are open and the Base Mean (BB) is rising
Open Falling: When the Bollinger Bands are open and the Base Mean (BB) is falling
Parallel Rising: When the Bollinger Bands are parallel and rising
Parallel Falling: When the Bollinger Bands are Parallel and falling
Close: When the Bollinger Bands are closed
Trix Column
Bought: When the Trix is above the MA (trix)
Sold: When the Trix is below the MA (trix)
Stoch Column
Bought: When %K is above %D
Sold: When %K is below %D
--------------------------
Rastreador para o setup de Agulhadas do Didi
Eu basicamente usei o screener criado por QuantNomad , fiz algumas modificações e usei os indicadores do setup
Indicadores usado:
Didi Index, ADX, Bandas de Bollinger, Trix e Estocástico.
Sinais de cada coluna:
Coluna 'Symbol'
Symbol Azul: Quando o Didi, ADX e BB estão com sinais de compra
Symbol Amarelo: Quando o Didi, ADX e BB estão com sinais de venda
Symbol Vermelho: Quando o ADX, BB, Trix e Stoch estão com sinais para fechar a operação
Coluna 'ADX'
Kick ADX: Quando o ADX deu um Kick (Topo ou Fundo). ADX vinha subinte e começa cair
Uptrend: Quando o ADX está subinte e abaixo do Nivel e o DI+ está acima do DI-
Uptrend Strong: Quando o ADX está subinte e acima do Nivel e o DI+ está acima do DI-
Uptrend Falling: Quando o ADX está cainte e acima do Nivel e o DI+ está acima do DI-
Downtrend: Quando o ADX está subinte e abaixo do Nivel e o DI- está acima do DI+
Downtrend Strong: Quando o ADX está subinte e acima do Nivel e o DI- está acima do DI+
Downtrend Falling: Quando o ADX está cainte e acima do Nivel e o DI- está acima do DI+
Coluna 'Didi'
Buy Alert: Quando a média rapida cruza a mediana para cima (contanto que não seja um Ponto Falso) = Alerta da Agulhada
Sell Alert: Quando a média rapida cruza a mediana para baixo (contanto que náo seja um Ponto Falso) = Alerta da Agulhada
Needle Buy: Quando a média lenta cruza a mediana para baixo = Confirmação da Agulhada
Needle Sell: Quando a média lenta cruza a mediana para cima = Confirmação da Agulhada
Fake Buy: Quando a média rapida cruza a mediana paa cima e a média lenta está acima da mediana e subindo = Ponto Falso (Sinal de venda ou caso esteja posicionado na compra, segurar a compra ou aumentar a mão)
Fake Sell: Quando a média rapida cruza a mediana para baixo e a média lenta está abaixo da mediana e caindo = Ponto Falso (Sinal de compra ou caso esteja posicionado na venda, segurar a venda ou aumentar a mão)
Coluna 'BB'
Open Rising: Quando as Bandas de Bollingers estão abertas e a média base (BB) está subindo
Open Falling: Quando as Bandas de Bollingers estão abertas e a média base (BB) está caindo
Parallel Rising: Quando as Bandas de Bollingers estão Paralelas e subindo
Parallel Falling: Quando as Bandas de Bollingers estão Paralelas e caindo
Close: Quando as Bandas de Bollingers estão fechadas
Coluna 'Trix'
Bought: Quando o Trix está acima da MA (trix)
Sold: Quando o Trix está abaixo da MA (trix)
Coluna 'Stoch'
Bought: Quando %K está acima do %D
Sold: Quando o %K está abaixo do %D

Bollinger Bands Filled - Didi's Needles setupFill Bollinger Bands - Based on Didi's Needles Setup
Fill Bands: True Fill Bollinger Bands
BB Open Upper: Open Bollinger Bands and MA Base rising
BB Open Lower: Open Bollinger bands and Base MA falling
BB Parallel Upper: Parallel and rising bollinger bands
BB Parallel Lower: Parallel and falling bollinger bands
BB Close: Closed Bollinger Bands
---------
Bandas de Bollinger com preenchimento - Baseada no Setup Agulhadas do Didi
Fill Bands: Verdadeiiro preenche as bandas de bollinger
BB Open Upper: Bandas de Bollinger abertas e MA Base subinte
BB Open Lower: Bandas de Bollinger abertas e MA Base cainte
BB Parallel Upper: Bandas de Bollinger paralelas e subinte
BB Parallel Lower: Bandas de Bollinger paralelas e cainte
BB Close: Bandas de Bollinger Fechada

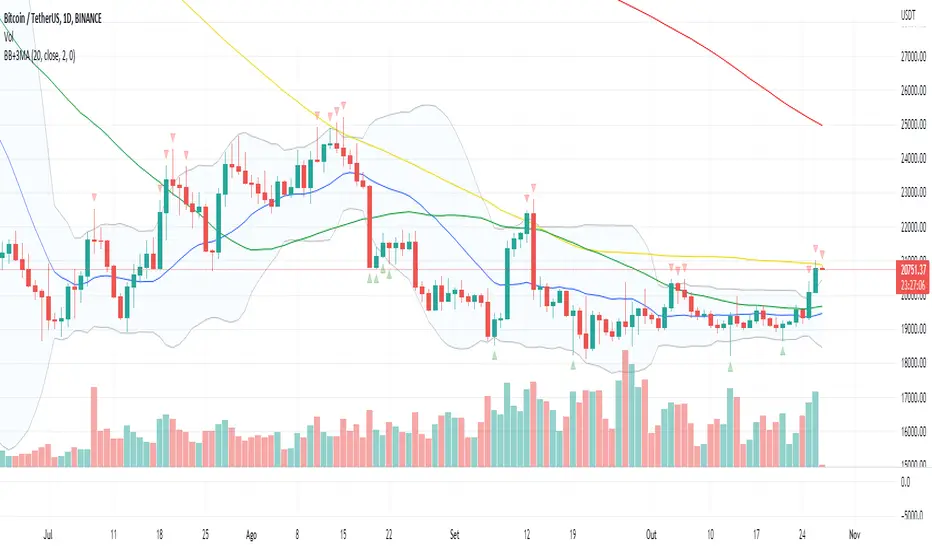
Bandas de Bollinger + 3 Medias Moviles SimplesDenota de una forma poco invasiva, cuando el precio alcanza las Bandas de Bollinger, y permite apreciar al mismo tiempo las medias móviles de 200,100 y 50 a fin de estar alerta a sus cruces, nos obstante, dicho indicador, debe ser apoyado junto con otros indicadores en los mercados financieros que estén al alza o a la baja.
Descargo de responsabilidad: Este contenido los datos, indicadores y valores reflejados, es solo para fines informativos y no debe interpretarse como asesoramiento legal, fiscal, de inversión, financiero o de otro tipo.
RSI & BB QQE Mod (highlight)This script is a combination of the RSI, QQE and BB
Here is an explanation on how I combined them, and how they are used:
- RSI (Relative Strength Index)
- Display a smoothed version of the RSI to identify "oversold" and "overbought" market phases
- Used to calculate a QQE
- QQE (Quantitative Qualitative Estimation)
- Used to identify trend direction and trend strength
- Used to set a basis for the BB
- BB (Bollinger Bands)
- Used with QQE as a basis to determine a relative definition of "high RSI" and "low RSI"
- Used with QQE as a basis to determine the volatility of the RSI at a given moment
- Used to predict pivot points
Here are the main signals:
- When "RSI Smoothed" line above the Upper BB then "RSI Smoothed" line turns green
- Also , display green background color highlight
- Also , and if "RSI Smoothed" is above the overbought line then display a second green background color highlight
- When "RSI Smoothed" line bellow the Lower BB then "RSI Smoothed" line turns red
- Also , display red background color highlight
- Also , and if "RSI Smoothed" is bellow the oversold line then display a second red background color highlight
A tool codded to be aesthetically pleasing and VERY customisable:
- Designed for both light theme and dark theme users
- Value can be easily modified in the settings
- Colors can be easily swapped in the settings
- Opacity of "fill" & "bgcolor" regrouped as a single input
A tool codded to be easy to read and to learn from:
- Sources and inspirations all listed within the script
- Structure easily identifiable (to understand with little to no effort how the script works)
Notes :
- This script is lagging, because of that I do recommend using it on relatively large timeframe
- This script is OpenSource, feel free to reuse it, but if so please remember to include a link to my script in your sources
- This script is not a magical tool, use at your own risk

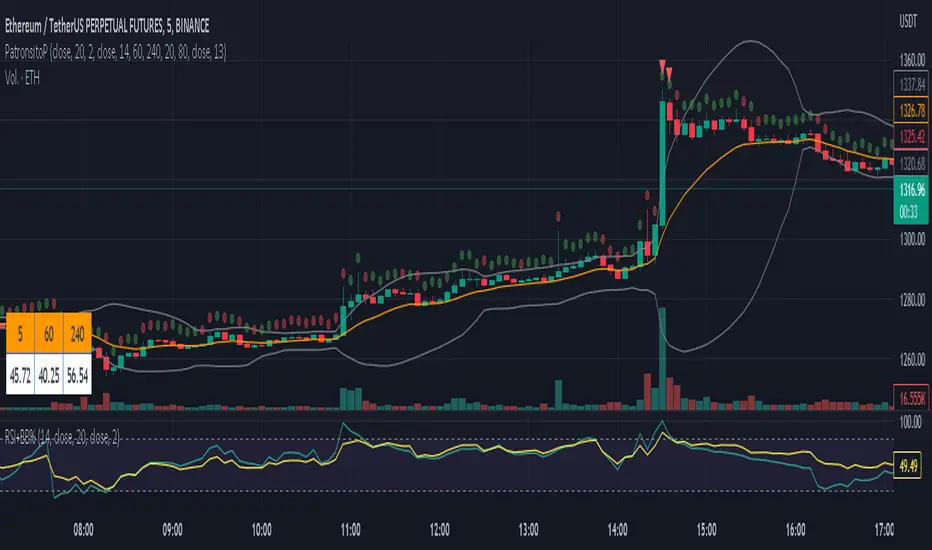
PatronsitoPIndicator for the "Patrón Poderoso" strategy.
This strategy is based on Bollinger Bands and RSI and try to determine overbought or oversold zones where you can trade. Both indicators are combined to provide a stronger signal.
By default, it is considered an overbought zone when price is over BB upper and RSI above 80. That would be a short signal. Price below BB lower and RSI below 20 means an oversold zone and therefore a long signal.
EMA 13 (by default) is included as a guide for exiting the operation.
Alarms for signals in any direction can be used.
Standard Deviation Histogram (SDH)This script tells you what standard deviation the price is from the mean. Due to the limitations of the calculations this study only works for stocks. Further limitations include and inability to calculate past 10 deviation. I have added a smoothing feature and the ability to change the colors. Dont be afraid to change the style to line instead of a histogram. Enjoy!

BB-EMA-MAWikipedia: Bollinger Bands are a type of statistical chart characterizing the prices and volatility over time of a financial instrument or commodity, using a formulaic method propounded by John Bollinger in the 1980s. Financial traders employ these charts as a methodical tool to inform trading decisions, control automated trading systems, or as a component of technical analysis. Bollinger Bands display a graphical band (the envelope maximum and minimum of moving averages, similar to Keltner or Donchian channels) and volatility (expressed by the width of the envelope) in one two-dimensional chart.
If you set Type = 2 then it will use EMA average for Bollinger bands .
If you set Type = 1 then it will use MA average for Bollinger bands .
Default settings is moving average with period 50
When price move to standard Deviation (std) +2 and std +3 is signal for sell ( selling zone)
When price move to standard Deviation (std) -2 and std -3 is signal for sell ( buying zone)

EMA Bollinger Bands with customized std dev and moving averageTo use EMA with band you need to set input parameter named as "TypeOfMa" to 1.
If you set TypeOfMa = 1 then it will use EMA average for Bollinger bands.
If you set TypeOfMa = 0 then it will use MA average for Bollinger bands.
DB MACD TTM SQZ HistogramDB MACD TTM SQZ Histogram
What does the indicator do?
The DB MACD TTM SQZ Histogram combines the MACD with the TTM Squeeze into a single histogram. Traders may use the "Multiplier" settings to weight MACD vs. TTM SQZ. The MACD will default have a multiplier value of 2 vs. 1 for TTM SQZ. The reasoning behind the default 2:1 multiplier is to allow the faster MACD to have a strong hand in the histogram. In addition to the histogram, the indicator will display a red dot when a BB/KC squeeze (TTM SQZ) is present. The TTM SQZ uses a length of 20, BB m-factor of 2, and KC m-factor of 1.5 to match the "Mastering the Trade" squeeze. The histogram is calculated by taking the MACD histogram and the TTM SQZ histogram and first standardizing them into reasonable decimal percentages. Once standardized, each decimal percentage is then multiplied by the individual multiplier. Finally, the two values are summed into the combined histogram value. The end result is a standardized weighted combination of the MACD (faster) with the TTM SQZ (slower) histogram.
How should this indicator be used?
The DB ETHUSD MMA Indicator should be combined with other indicators as a secondary visual indicator or market buy/sell periods. The indicator is not meant to replace the MACD or TTM SQZ. Analyzing the MACD and TTM SQZ wave patterns individually is extremely useful. The indicator allows the trader to quickly obtain a combined analysis of the two indicators with a predetermined preference (multiplier) towards one vs. the other.
In other words, the indicator is very helpful when the MACD and TTM SQZ are conflicting in providing market direction. Those familiar with MACD or TTM SQZ histograms recognize there are four periods in the full cycle; growing below zero line, growing above zero line, falling above zero line, and falling below zero line. Typically a trader would look for buying opportunities when the cycle is showing "growing below zero line." and sell when the price reaches the "falling above zero line." The qualification of the wave pattern of the four periods must be reviewed before trades. If the wave is choppy, then alternative timeframes should be reviewed. Think of wake on a lake or ocean waves. Choppy is unpredictable but smooth waves are more predictable.
The red dot on the zero line would indicate that a squeeze is present in the current timeframe, building pressure. The red dot does not indicate a pressure release of up or down. Instead, it simply means the spring is being compressed. When a squeeze is present, pressure builds and may release in either direction. You can combine this indicator with BB and KC on the plot with BB (20 len, 2 m-factor) and KC (20 len, 1.5 m-factor). You can review the BB/KC outer bands to see possible breakout resistance or support when a squeeze is on. If the price is outside the BB/KC outer banks, move to a higher timeframe.
Does the indicator include any alerts?
Not Yet. Perhaps in the Future (If Desired)
Enjoy!

(Subak)Multi timeframe datagridEn)
A table that displays the current data value by time frame.
Indicators show when rsi is oversold (default 27) or overbought (default 73).
The background color indicates that the current price is high or low based on 20mA. When the current price and profit are different from the set value (default 100), the text color is highlighted.
Displays the values of the upper and lower lines of the Bollinger Bands. It is displayed in the background color when it is out of the Bollinger band.
It is designed for monitoring purposes so that you can see the chart when the desired value is found at the time.
-Subak-
Kor)
현재 데이터 값을 시간대별로 표시하는 테이블입니다.
Rsi 가 과매도(기본값 27) 또는 과매수(기본값 73)일 때 배경색을 통해 표시됩니다.
20mA를 기준으로 현재 가격이 높거나 낮음을 배경색으로 표시됩니다. 현재 가격과 설정 값(기본값 100)이 다를 경우 텍스트 색상이 강조 표시됩니다.
볼린저 밴드의 상단 및 하단 라인 값을 표시합니다. 볼린저 밴드를 벗어나면 배경색으로 표시됩니다.
해당 시간에 해당 보조지표의 값을 기준으로 챠트를 볼 수 있도록 모니터링용으로 개발되었습니다.
-Subak-

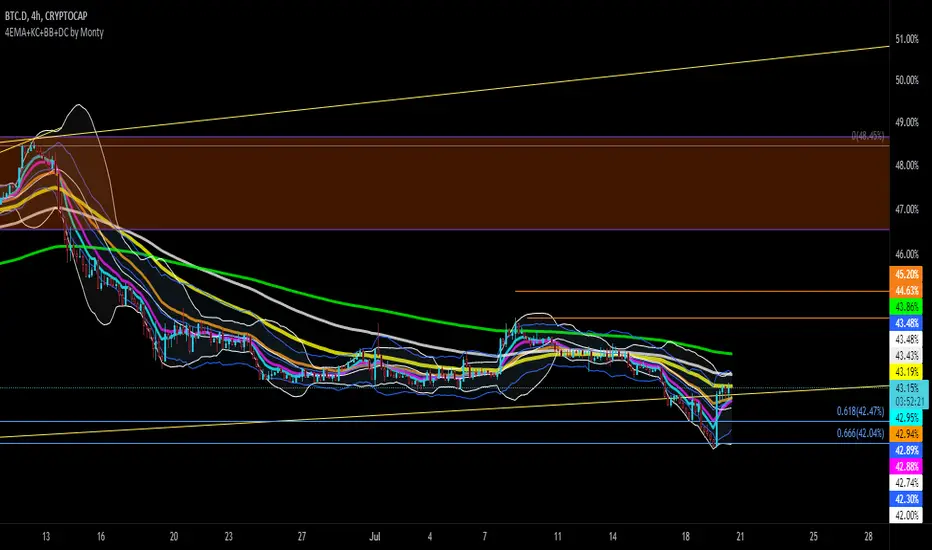
4EMA+KC+BB+DC by MontyI combined these scripts for my friend.
This script contains some imported work from @PatekCharts and I added the KC channels.
It's not that difficult.
.srb suite pin-upThe essential suite Indicator
that are well integrated to ensure visibility of essential items for trading.
it is very cumbersome to put symbol in the Tradingview chart and combine essential individual indicators one by one.
Moreover even with such a combination, the chart is messy and visibility is not good.
This is because each indicator is not designed with the others in mind.
This suite was developed as a composite-solution to that situation, and will make you happy.
--> This is steamlined pin-up version of .srb suite.
--> A minimal set of indicators for comparing different symbols.
--> This is well-balanced alternative next version of previous .b pin-up symbol
BTC-agg. Volume
4 BTC-spot & 4 BTC-PERP volume aggregated.
It might helps you don't miss out on important volume flows.
Weighted to spot trading volume when using PERP+spot volume .
If enabled, BTC-agg.Vol automatically applied when selecting BTC-pair.
--> This is used in calculations involving volumes, such as VWAP .
Moving Average
1 x JMA trend ribbon ; Accurately follow short-term trend changes.
2 x EMA ribbon ; zone , not the line.
MA extension line ; It provide high visibility to recognize the direction of the MA.
SPECIAL TOOLS
BB regular (Dev. 2.0, 2.5)
BB Extented (Dev. 2.5, 3.0, 3.5)
SPECIAL TOOLS - Ultra Volume Marking
x2 x4 greater than regular average volume, it will help you can take the reversal
It does not directly indicate volume, but ultra-volume marking is enough for compare.
---------------------------------------------------------------------------------------------------------------------------------------
if you have any questions freely contact to me by message on tradingview
but please understand that responses may be quite late.
Special thanks to all of contributors of community.
The script may be freely distributed under the MIT license.

Actieve Inversiones EMABBOL by EDOHEN
EMABBOL includes these indicators:
- triple emas (9,21,50)
- Bollinger Bands
- Also includes buying or selling signals
The following strategy is based on ema crosses and bollinger ma crosses, the Bollinger band gives us the target we could expect from our trades, using the upper and lower bands.
Trading criteria
Buy : Price crosses over the triple emas and also crosses under the Bollinger band ema. Looking for 3:1 PnL
Sell : Price crosses under the triple emas and also crosses under the Bollinger band ema. Looking for 3:1 PnL
Stop Loss Tips : set the SL above the crosses if Selling, below the crosses if buying
Take Profit Tips : set the TP below the Bollinger's lower Band band if Selling, or above the Bollinger's upper Band band if Buying

two BollingersThe Double Bollinger Band consists of an average and two Bollingers and two backgrounds, each of which has separate settings and can be approved more strongly for trades. Moves and vice versa. With the price chart coming out of the second band, the price is much more likely to move in the same direction.
To use this feature, we had to use two Bollinger indicators with different settings at the same time, but we no longer need to do this with the Double Bollinger .
Its main use is crypto, but it can be used in all markets

double Bollinger BandsThe Double Bollinger Band consists of an average and two Bollingers and two backgrounds, each of which has separate settings and can be approved more strongly for trades. Moves and vice versa. With the price chart coming out of the second band, the price is much more likely to move in the same direction.
To use this feature, we had to use two Bollinger indicators with different settings at the same time, but we no longer need to do this with the Double Bollinger.
Its main use is crypto, but it can be used in all markets

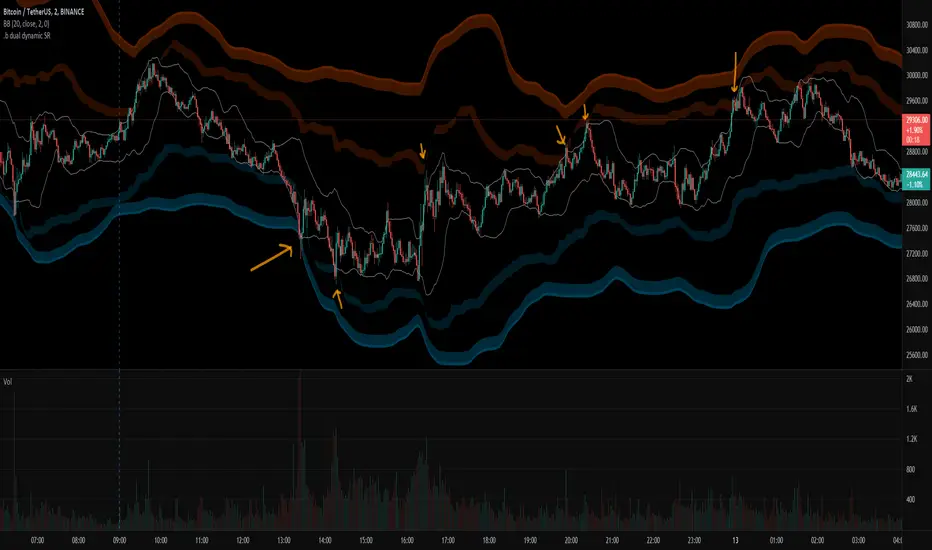
.b dual dynamic SRThis is dual band dynamic S/R indicator
It works on longger swing than BB 20,2 band rage, and I think It works well.
even on the rapid price change, it quite woks well.
If price goes out of 1st S/R band range, 2nd S/R band shows up on the chart.
Because of large bandwidth, An area in which an actual candle is drawn may be displayed as small.
So, with some codework, I made the S/R band occupy only the area near the actual candle drawing area.
The S/R band value is calculated as a combination of donchian band, high/low, atr, etc.
and regular default setting value is fixed on the code level. you can change the color set.
For more information, please refer to the source code.
if you have any questions freely contact to me by message on tradingview, or telegram @sr_bt
but please understand that responses may be quite late.
-------------------------------------------------------------------------------------------------------------------------------------------
Special thanks to all of contributors of community.
The script (originaly .b) may be freely distributed under the MIT license.
without a clear understanding of the house rules,
Several indicators on the charts, it should be clean chart on publishing.
So I am re-publishing as a new one, sorry about that.
BB-RSI-ADX Entry PointsThis is a combination of indicators used to find oversold and overbought entry points for possible reversion.
A Green arrow will appear when all condition are met for an ENTER LONG position.
A Red arow will appear when all condition are met for an ENTER SHORT position.
You can modify all of these condition parameters from the indicator's settings.
How does the indicator work
The signals are using Bollinger Bands , BB %B , RSI and ADX indicators to try and find points of reversal
Enter LONG Conditions
Current candle low is below BB lower band.
The BB %B is more than 0.
RSI > 30
ADX > 25
Enter SHORT Conditions
Current candle high is above BB upper band.
The BB %B is less than 1.
RSI < 70
ADX > 25
Those are the default settings that seem to work for me but you can customize all of these from the indicator settings.
I find this strategy to best work on a 3 minute timeframe
Note: The bb %B is calculated for stDev - 1. This will help you see a change happening faster.

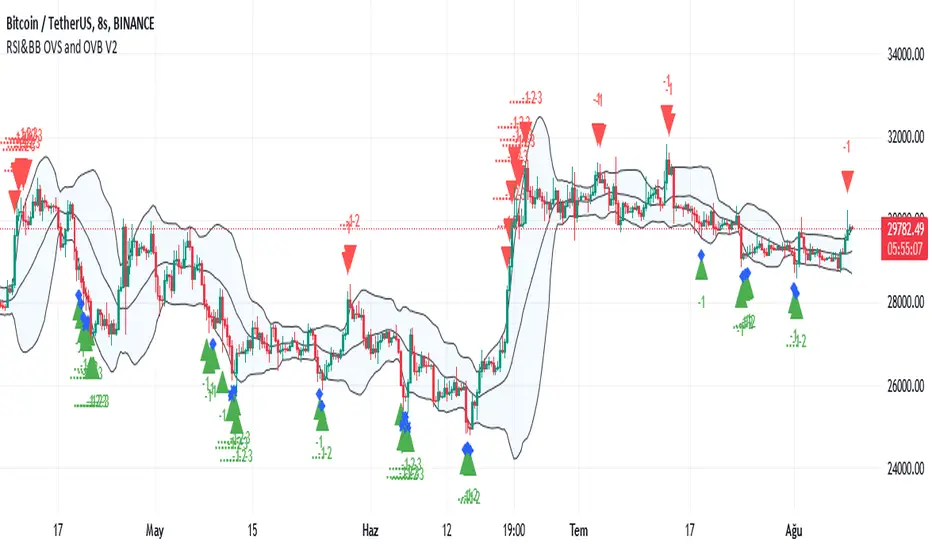
RSI and BBand simultaneously OverSoldENG : This indicator is created by combining the standard period RSI indicator with an Oversold limit of 32, an Overbought limit of 70 and a period of 14 (these values can be changed optionally from the entries and still tabs of the indicator settings) and the Bollinger Band. indicator with a standard deviation of 2 and a period of 20. Also, the RSI Oversold is an upward green triangle where the price simultaneously falls below the BB and the lower limit (Low) (i.e. below 32), where the RSI Overbought (i.e. above 70) at the same time the price rises above the BB and the upper limit (Upper) is a downward red triangle. is indicated by a triangle. An alarm condition is established on these conditions. Source codes are posted visually and written in clear language and with explanations for beginners to learn to pine.
TR : Bu gösterge OverSold sınırı 32, OverBought sınırı 70 ve periodu 14 olan (bu değerler tercihe göre indikatör ayarlarının girdiler ve still sekmelerinden değiştirilebilir) standart periodluk RSI göstergesi ile standart sapma değeri 2, periodu 20 olan Bollinger Bandı göstergesinin birleştirilmesiyle oluşturulmuş olup ilaveten RSI'nin OverSold iken (yani 32 altına düştüğü) aynı anda fiyatın BBand alt sınırı (Lower) altına düştüğü yerleri yukarı yönlü yeşil üçgenle, RSI'nin OverBought iken (yani 70 üstüne çıktığı) aynı anda fiyatın BBand üst sınırı (Upper) üstüne çıktığı yerleri aşağı yönlü kırmızı üçgenle belirtmektedir. Bu şartlar üzerine de alarm kondüsyonu oluşturulmuştur. Kaynak kodları görünür olarak yayınlanmış olup, pine öğrenmeye yeni başlayanlar için anlaşılır dilde ve açıklamalar eklenerek yazılmıştır.
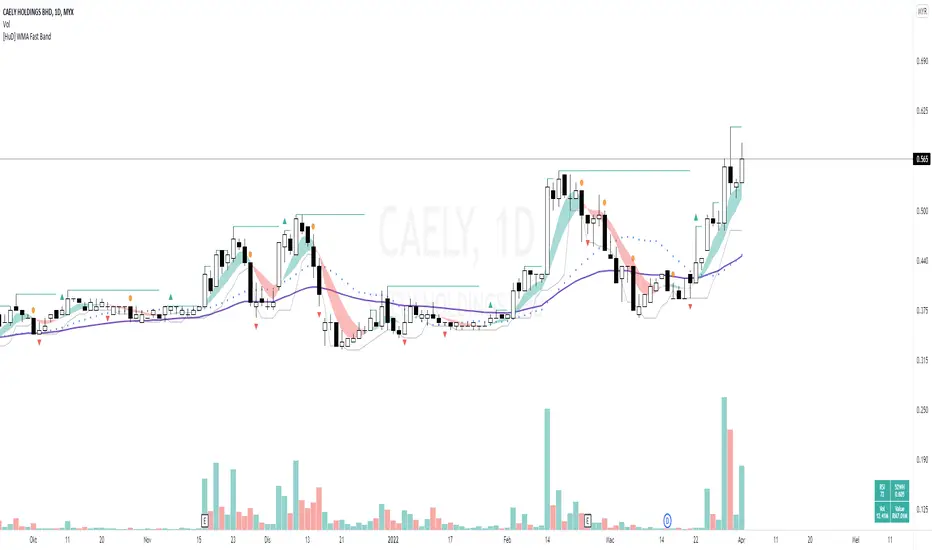
[HuD] WMA Fast BandThis personal Indicator was designed for the uncertain market of Bursa Malaysia where traders can only open positions for Buy.
The objective is to trade in fast mode, Fast In Fast Out ( FIFO ) especially when during bearish market.
It is based on Weighted Moving Average and the formula are as followed :
Short WMA = ( wma5 High + wma5 Low ) / 2
Long WMA = ( wma10 High + wma10 Low ) / 2
These Short WMA and Long WMA create a band ( green or red )
Green band appears when Short WMA > Long WMA and vice versa.
1. Green triangle
- appear when it meets all these three criteria
i. Short WMA crossover Long WMA
ii. Price is above ema50
iii. Price is below Top BB ( Bollinger Band )
- when a green triangle appears, traders can choose either to make a "BUY" entry at this point or wait for the next candle
- this green triangle is an early entry signal
2. Red triangle
- appear when Long WMA crossover Short WMA
- this is considered a final exit point for traders.
3. Orange dot
- appear when the price close below grey line. This means it break the previous lowest 3 candles
- when orange dot appears, traders can either exit or wait for red triangle for exit confirmation.
4. Grey Line
- is the lowest low price of the previous 3 candles ( default value is 3. Value can be adjusted )
5. Green Line / Level
- is the highest price level of the previous 5 candles.
- Trader can use this line as take profit (TP ) level depending on "taste" or "appetite"
6. Table Info
- consist of RSI value ( default 14 ), 52Week High Value, Volume , and Transaction Value in RM ( volume * current price )
7. Small Blue dot = Mid BB = SMA 20
8. Purple Line = EMA 50
Happy Trading 😎
Bubbles BB futuresQuick and simple BB bubble indicator for Futures
Draw an arrow if candle corpse is out of Bollinger Band (Upper / Lower)
It's not a signal.
I use it to off-load my charts
