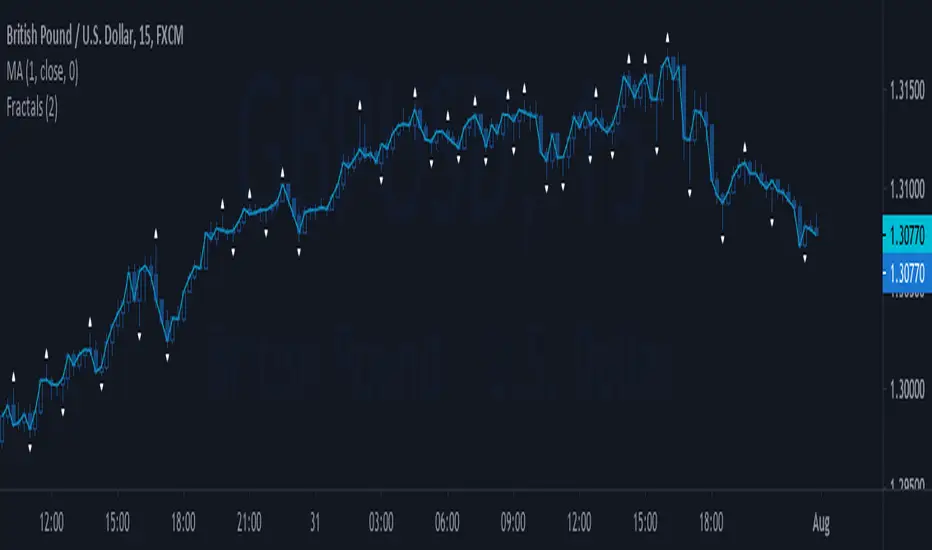
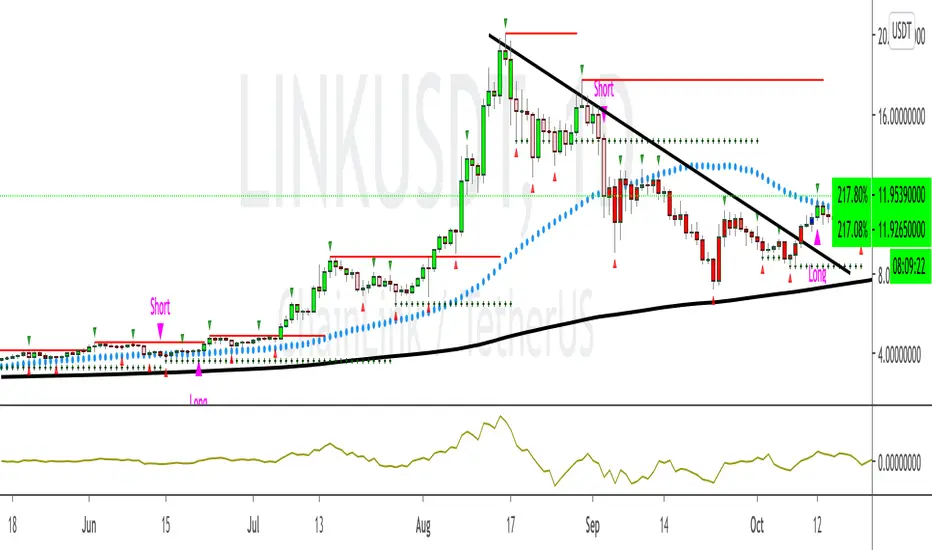
Deep_Fractal_Signals_and_Rubber_Band_TradesThis indicator is based on Williams Fractals and the TopDog Trading "Rubber Band Trade"
The Deep Fractal Signals are triangles that indicate the price is forming a pattern of decreasing lows in a down trend (orange) or, increasing highs in an up trend (green).
The triangles are placed above or below the last bar of the pattern, unlike Fractals which are drawn 2 candles prior to the current candle, and are re-painted on the chart.
When the triangle is indicated above the moving average in a down trend (blue), or below the moving average in an up trend (yellow), this is a Rubber Band Trade.
When the slope of the moving average is less than the Gain set by the user, or are counter-trend, the triangles are plotted in silver.
When used in conjunction with the Power Analyzer indicator, a signal to the long side should be taken when the Power Analyzer momentum indicator is at a cycle low. Similarly, a signal to the short side should be taken when the indicator is at a cycle high.
The first, second or third signal in a new trend have the highest probability of a follow through.
The indicator sometimes gives a false signal at the very end of the trend, just before the market reverses. This is an attempt by the Market Makers to persuade traders that the trend will continue.
Please leave a comment and "Like" this indicator if you find it useful.
FX Engineering
Penunjuk Bill Williams

Heikin Ashi Buy Sell by JPTrades Description
I use this script a lot to know the trend of a stock, cryptocurrency, forex.
This script is based on an EMA study. Which tells us the trend of a stock.
How to use
You can see the trend of a stock if it goes up it says buy and if it goes down it says sell. It is recommended that you put it with the heinki ashi table. It can help you much more.
How to access the script
Send me a message to the private
Observations
This advice is NOT financial advice.
We do not provide personal investment advice and we are not a licensed and qualified investment advisor.
All information found here, including ideas, opinions, views, predictions, forecasts, comments, suggestions, or action selections, expressed or implied in this document, are for informational, entertainment, or educational purposes only and should not be be construed as personal investment advice.
We will not and will not be responsible for any action you take as a result of what you read here.
We only provide this information to help you make a better decision.
While the information provided is believed to be accurate, it may include errors or inaccuracies.

Buy and sell signal by JPTradesDescripcion:
The 10/20 MA Strategy is the best I know. It's easy, it's elegant, it's effective.
It's particularly effective in markets that trend on the daily. You may lose some money when markets are choppy, but your loss will be more than compensated when you're aboard during the big moves at the beginning of a trend or after retraces. There's that, and you nearly eliminate the risk of losing your profit in the long run.
The results are good throughout most assets, and at their best when an asset is making new all-time highs.
Caracteristicas:
It uses two simple moving averages: the 10 MA (Buy), and the 20 MA (Sell). Now here's the great thing. This script does not change your regular candles into heikin-ashi ones, which would have been annoying; instead, it subtly prints either a Buy or a Sell around your normal candles, indicating a heikin-ashi change from red to green, or from green to red, respectively. This way, you get both regular and heikin ashi "candles" on your chart.
How to Use:
Go LONG in case of ALL of the below:
A tab appeared with buy under the last daily candle (meaning the heikin-ashi is now "green").
The blue MA-line is above the red MA-line.
Price has recently breached the blue MA-line upwards, and is now above.
Cover when one or more of the above is no longer the case. This is very important. You want to keep your profit.
Go SHORT in case of ALL of the below:
A red tab with Sell above the last daily candle (meaning the heikin-ashi is now "red").
The red MA-line is above the blue MA-line.
Price has recently breached the blue MA-line downwards, and is now below.
Again, cover when one or more of the above is no longer the case. This is what gives you your edge.
How to get access to the script:
Send us a message if you would like to try!!

Awesome Oscillator_VTX
Abbreviations:
AO - Awesome Oscillator
AC - Accelerator Oscillator
TP - TimePeriod (1m,2m,5m,1h....)
TP Steps - 1m,3m,12m,1h,5h,D (This steps i use)
Use-case:
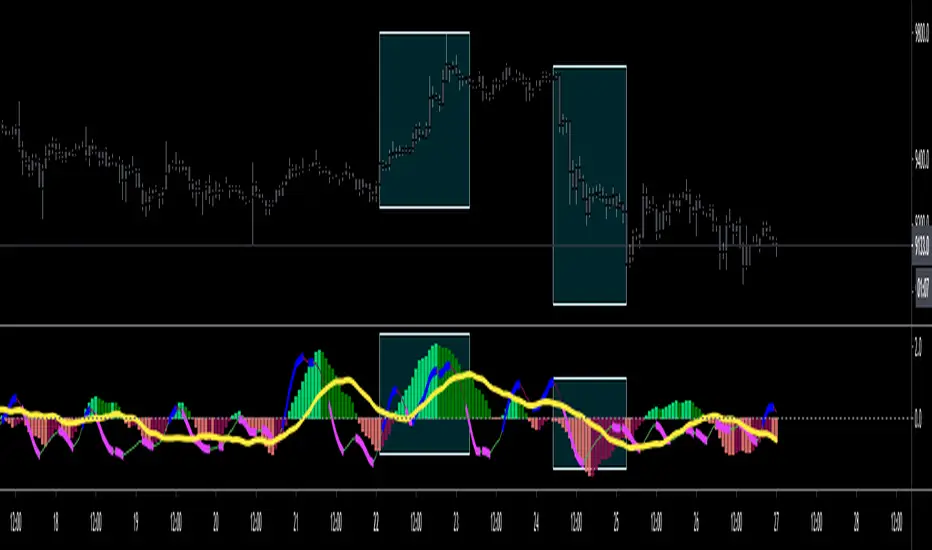
Awesome Oscillator best used to find Divergence/Convergence what results in Weakening of Momentum and Price reversals.
This script calculates and plots AO/AC with minute precision, removing GAPS when projecting Higher Period AO/AC.
So you can accommodate all important information on one chart with best precision.
Made for Intraday Perioads.
Best used for DayTrading, when you need to make quick and efficient decisions.
Calculation = Preferred resolution * Length / Present resolution.
As Additional Function, this Awesome Oscillator has AC built in.
Settings:
Resolution - Most used TP included, plus some exclusive paid plans (1m, 2m, 3m, 5m, 12m, 15m, 1h, 4h, 5h, Daily). Default set to 1h
Use AO - You can switch between EMA and SMA for FastMA/SlowMA calculation. Default set to EMA
FastMA - standard function. Default set to 5
SlowMA - standard function. Default set to 34
Signal Line - Plots MA to show Momentum. Uses EMA/SMA based on "Use AO" selection. Default set to 5
Use AC - You can switch between EMA and SMA for AC calculation. Default set to SMA
Offset - standard function. Default set to 0
Accelerator - AC length. Default set to 5
Source - standard function. Default set to hlc3
Why to use it ?
Yes, i know that variable TP is standard now in TradingView. But there are some limitations, especially for DayTraders.
Problem:
Imagine you are trading/scalping on 1m.. 5m.. 15.. charts and you want to see where are your on Higher TP.
-- You can change to 1h and check it, but you will loose the picture from smaller TP.
-- You can use Standard TP function, but your data will update every 15m, 1h (depends on TP). And in result you have Gaps between bars.
Solution:
This script help to solve this problem, by breaking information down to 1m and building from there.
So whatever Intraday TP you choose to trade, your AO/AC will be updated with minute precision.
Limitations:
Sadly nothing without limitations.
1. For Best performance use only Higher TP dividable By Yours (ex. You use 3m chart, then you can plot 12m, 15m, 1h / You use 5m chart, then you can plot 15m, 1h. 12m will already have 3m of information lost using 5m Chart )

MarketStructureBreakThe Script is called a MSB/MarketStructureBreak
This script is meant to teach you on how the 2 candles are responsible for the breakout and shows you patience
The best way to use this indicator is by putting the "SMA 50 SMA 200" settings helps filter out the false calls
As well, if you use this in a bigger time frame like 1 HOUR, 4 HOUR, Daily, and Weekly it will call the best buy and sell Signals

Liquidity and SFPThis tool prints fractal high & lows (triangles) illustrating probably points of liquidity & Williams method.
If the liquidity points have been run, there will be a line print, when they have not been run there will still be a single triangle print without a line.
If the liquidity is run and then the candle closes above we print a checkmark to demo that it is likely that this was a stop run to generate liquidity for bigger market participants. This can help with entry identification if this is a method you deploy.
This indicator is available as part of membership at at decentrader.com

Two Fractals TrendlinesThis study draws a trend line for the last two Bill Williams up-fractals and down-fractals.
Trend line break signals and alerts can optionally be added.

Normal FractalsNormal size fractal
For those who like Charts as clean as possible, I modified build in fractals in smaller size clean chart pollution
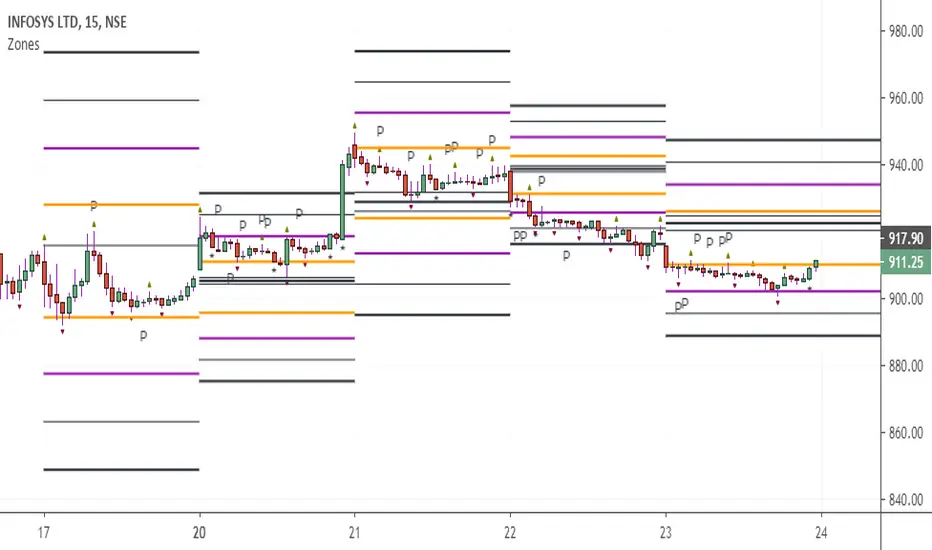
CAMZONEAdded Fractals which establishes high and low based on Bill Williams definition. Added one type of Pinbar (where the open and close is near extreme of the range and with long shadow that is at least 80% of the range). It is a powerful reversal pattern especially on the daily charts. These bars are identified with the character P. Also included dots below momentum candles.
FRACTAL-TREND-MTF-GRIDFractal Trend - Multi Time Frame
Toggle time frame 3 on/off (When on, time frame 3 is set to the chart time frame)
Toggle ticker selection on/off
Toggle time frame header on/off
To configure grid see grid instructions below (the indicator in the gif is the SMT but same concept applies)
***** Make sure all instances of the indicator are pinned to the same scale *****
gifyu.com

Jackrabbit.modulus.Williams%RThis is the Williams %R for the Jackrabbit suite and modulus framework.
This indicator supports differential timeframe analysis and confirmational bias. Dynamic timeframes are supported.
This is an updated view of %R and supports traditional overbought/sold boundaries and cross over regions.
The main indicatior and the confirmational indicator can both be individually tuned for the length and smoothing, with 30 different moving average types:
SMA, Double SMA, Triple SMA,
EMA, Double EMA, Triple EMA,
RMA, Double RMA, Triple RMA
WMA, Double WMA, Triple WMA,
VWMA, Double VWMA, Triple VWMA,
Hull, Double Hull, Triple Hull,
ZLEMA, Double ZLEMA, Triple ZLEMA,
SWMA, Double SWMA, Triple SWMA,
SSMA, Double SSMA, Triple SSMA,
SMMA,Double SMMA, Triple SMMA
The Jackrabbit modulus framework is a plug in play paradigm built to operate through TradingView's indicator on indicatior (IoI) functionality. As such, this script receives a signal line from the previous script in the IoI chain, and evaluates the buy/sell signals appropriate to the current analysis. The results are either combined with the signal line, or used as confirmation to the signal line. A new signal line is generated for the next script in the link.
This script is not designed or meant to function outside my framework.
By default, the signal line is visible and the charts are turned off. Signal line visibility is controlled by the Style tab, and the charts display is controlled by the indicator settings tab.
This script is by invitation only. To learn more about accessing this script, please see my signature or send me a PM. Thank you.

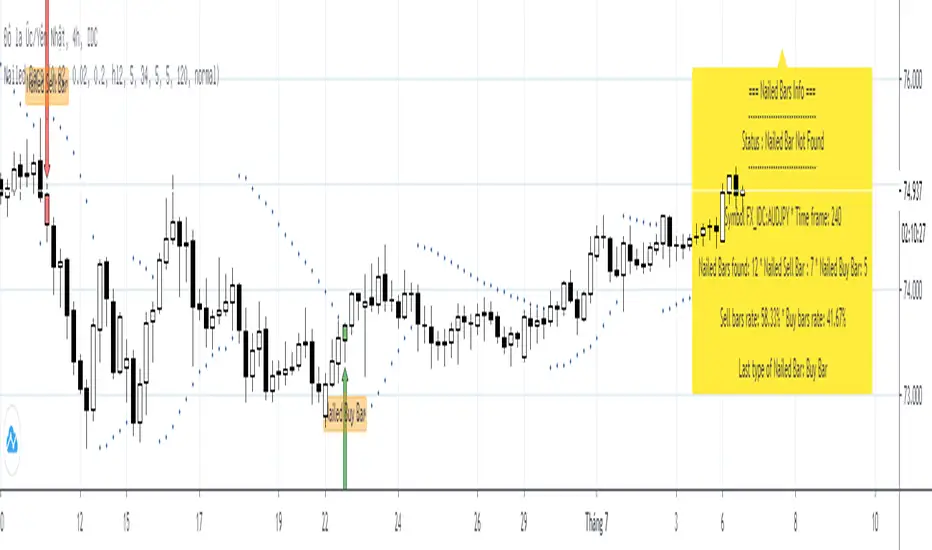
Nailed BarsNailed bars was introduced by Joy22 in an article "Pip Nailer Trading System" submit on forexstrategiesresources on 06/01/2012
Rule of Nailed Bars is below:
1. Nailed Sell Bar:
* PSAR appears above the bar
* The Awesome Oscillator (AO) turns red
* The Accelerator Oscillator (AC) turns red
2. Nailed Buy Bar:
* PSAR appears below the bar
* The Awesome Oscillator (AO) turns green
* The Accelerator Oscillator (AC) turns green
=== About this indicator: Nailed Bars ===
This indicator is detecting all nailed bars was appeared on chart and display infomations in a panel. So traders who are using "Pip Nailer Trading System" can easily control the trade.
Milan OscillatorBill Williams Breakout Setup
I have referred to the man multiple times whether tweeting about him or writing a blog post. Now I want to relearn how breakout trading works, again. A while ago, my friend invited a bunch of us into a Zoom conference sharing us how his setup works for him. He reintroduced me to Bill Williams' indicators which looked like below.
The rules are simple:
Prices are moving away from Alligator, open and closed above the first time.
AC is twice consecutively at par with the direction.
AO is twice consecutively at par with the direction.
Entry on the third candle to be sure, or the second if you're willing to risk it.
The chart above is an example from the 4 hourly time-frame. Before going into any entry, to get a macro perspective, should check on these time-frames first:
Weekly
3 Days
Daily
Bonus points if monthly time-frame is also at par with the bias. Here are the charts for the larger time-frame.
It's been profitable trading with the above setup but then I have an itch to scratch. I wanted to have just a single oscillator instead of two to look at. It will enable me to make decisions faster and can use my brain juice to think about something else.
So I combined the two to create a new oscillator. I call it the `Milan Oscillator` in honor of my friend Patris who reintroduced me to Bill Williams yet again. Patris' favorite team is AC Milan, here's to you bro 🍺
Here are the same charts above with Milan Oscillator.
The rules are a bit different than the rules above:
No entry when the oscillator is gray, this means AC and AO are disagreeing.
Prices are moving away from Alligator, open and closed above the first time.
Oscillator is twice consecutively at par with the direction.
Entry on the third candle to be sure, or the second if you're willing to risk it.
On lower volume moves, prices will retest alligator, can be an entry if the retest fails.
Feedbacks are appreciated.

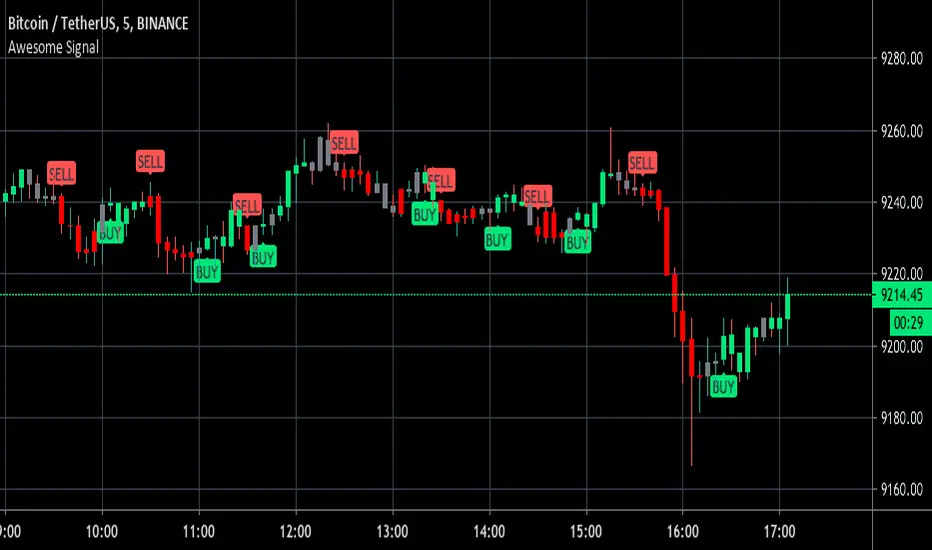
Awesome Buy/Sell SignalBuy and Sell signals using Bill William oscillators. Works for anything with high volume both crypto and stocks.
Optimal at Lower time frames and larger time frames can give you trend.
Green painted bars bullish momentum
Grey painted bars undecided momentum
Red painted bars bearish momentum.
DarvasBox Breakout [@TradersVenue]I have decided that, its time to give back something to trading community so that channel/group members benefit from it. As usual, its without any commercial interests and hence published it publicly for free (without source code because its my own effort and don't want to share the source code to all).
This is complete non-repaint version of my #DarvasBox trading strategy. For best results keep the default settings. Dont keep the Will not be able to share the code. I have done back testing till 1990 and results are fantastic. Strategy works well with 25/75/125+ time frame. I have majorly tested it in #Nifty and #BankNifty. You may test it with other scripts and trade if you want.

Buy/Sell_Trend_IndicatorThis is an improved version of my earlier script, the objective of the script is to provide simple trading entry and exist based on Moving average crossover as a foundation with some dependent conditions.
This trend following system allows a trader to capture the maximum benefit in a trade from entry to exit while it doesn't guaranteed a top or a bottom exit / entry, the trader will be able to setup an entry signal, and follow up on the trade with stop loss adjustment during the entire trade.
this is mainly targeted at new traders looking to trade profitably without blowing up their account.
I am open to feedback.
regards
Carl's BOTTOM DETECTOR: Williams %R + normalized ATRThis script is based on Williams %r and normalized ATR.
When William%R indicates extreme oversold conditions
and the ATR indicates extreme volatility at the same time,
then it prints an arrow below the candle.
It is based on the concept that swing lows and market bottoms
are characterized by extreme oversold momentum and
extreme volatility.
The highest tf's like the daily, show you perfect market bottoms for btc.
If you zoom in it's still good to find swing highs and lows, if necessary
you can tweak the settings.
Next to that I added grey, red, and green vertical bands to the chart.
This is based on the VIX, the SPX volatility index.
Whenever the volatility of the S&P500 crosses above a specific level
it prints a colored background band behind the candle.
Grey means high volatility, red extreme volatility (like in the covid
crisis and 2008 crisis), and green means the same as grey, but indicates
it came after a red zone and could mean strong bullish bounce momentum.
You can tweak the thresholds for the grey/green and read areas.

Gator RibbonThere's nothing fancy here--I just like the look of this one. And it works pretty well. This started out as the standard Alligator indicator. There I reset all the offsets to 0 and added an Ichimoku Cloudish fill.
Astute observers will notice a fourth line has been added at 34 SMA. It's a bit of a cheat. 34 SMA is the zero line of another classic B. Williams indicator, the Awesome Oscillator. When the green line crosses over 34 SMA, it's quite likely the Awesome Oscillator will have changed sentiment as well. It also makes a nice loose trailing stop loss reference if you're hoping to get into some long trends.

Overbought & OversoldUsing volatility extreme in conjuntion with the Laguerre tops and bottoms signal from Chris Moody, it allows the user to know if the asset is highly overbought or highly oversold.
Red means oversold, Green means overbought.
I use it as an additional confirmation before taking a trade, short or long.

Overbought & OversoldUsing both volatility (VIXFIX) as well as the Laguerre overbought and oversold signal, this indicator allows the user to be more confident when taking a long and a short trade.
Green is overbought, Red is oversold

MAPS - Momentum ConsensusA re-imagining of Bill William's well known Awesome Oscillator. This indicator works similarly to Bill's but from my experience, it's able to detect divergences more frequently and with better accuracy.
Use the link below to obtain access to this indicator
Fractal_Trend_MTFFractal_Trend_MTF - 3 fractal trend time frames in 1
Ability to view the fractal trend of 3 times frames in one indicator
Time frames are user configurable
Turn on/off agreement highlights
Specify if a candles needs to close above/below a fractal level to consider it broken - or just break it with its high/low
Alerts enabled for each time-frame and for when all time frames are all in agreement
Usage Note: To accurately display the fractal trends the chart must be opened on a time-frame that is equal to or less than the lowest time-frame specified in the indicator. Tradingview can accurately display higher time frame information on a lower time frame chart but not vice-versa. e.g If the lowest time frame selected is the H1 then view the indicator on the H1 chart or below.

Bill Williams SystemBill Williams System combine all indicators of Mr. Bill Williams into one window with detail below:
1. Top of window:
Display Fractals with shape triangle down is bottom fractal and shape triangle up is top fractal
2. Bottom of window:
Display Alligator Trend Flat with trend defined as below:
* Up trend: Lips value shift 3 bars greater than Teeth value shift 5 bars. And Teeth value shift 5 bars greater than Jaws value shift 8 bars. By default up trend is green square.
* Down trend: Lips value shift 3 bars less than Teeth value shift 5 bars. And Teeth value shift 5 bars less than Jaws value shift 8 bars. By default down trend is red square.
* Choppy: not up trend and not down trend. By default choppy is gray square.
3. Moving around zero line
* Awesome Oscillator is circles.
* Accelerator Oscillator is columns.
* Gator Oscillator is area.
