Buy on Blue, Sell on Red (EMA + optional RSI) TyusEThis indicator is a trend-following system that helps traders identify potential buy and sell opportunities using a combination of EMA crossovers and an optional RSI filter for confirmation.
It plots:
🔵 Blue dots (BUY signals) when the fast EMA crosses above the slow EMA — signaling bullish momentum.
🔴 Red dots (SELL signals) when the fast EMA crosses below the slow EMA — signaling bearish momentum.
You can optionally filter these signals using the RSI (Relative Strength Index) to avoid false breakouts — for example, only taking BUY signals when RSI is above 55 (showing strength) and SELL signals when RSI is below 45 (showing weakness).
⚙️ Features
Adjustable Fast EMA and Slow EMA lengths
Optional RSI confirmation filter
Customizable RSI thresholds for entries
“Confirm on bar close” setting to reduce repainting
Built-in alert conditions for real-time notifications
💡 How to Use
Use blue dots as potential long entries and red dots as potential short entries.
Confirm direction with overall trend, structure, or higher timeframe alignment.
Combine with support/resistance, volume, or price action for best results.
⚠️ Note
This is a technical tool, not financial advice. Always backtest and use proper risk management before trading live markets.
T.E
Penunjuk Bill Williams

2-Min Strong Engulfing PatternTwo-Candle Engulfing Indicator (5-Minute Version)
This TradingView indicator detects two-candle engulfing patterns on the 5-minute timeframe. It identifies bullish and bearish reversals by analyzing the last three candles:
Bullish Engulfing: A green candle that fully engulfs the previous two red candles, signaling potential upward momentum.
Bearish Engulfing: A red candle that fully engulfs the previous two green candles, signaling potential downward momentum.
Features:
Works on the 5-minute timeframe, even if the chart is set to a different timeframe.
Plots green triangles below bullish engulfing candles and red triangles above bearish engulfing candles for easy visualization.
Built-in alert conditions notify you immediately when a pattern occurs, allowing you to react in real-time.
Lightweight and optimized for fast detection without affecting chart performance.
Use Cases:
Spot short-term reversal opportunities.
Combine with other indicators or trading strategies to confirm trends.
Receive alerts for potential entries or exits in day trading setups.

MINE CBPR Lite ✦MINE CBPR ✦ Lite is the prototype foundation of the MINE CBPR ✦ Pro —
a streamlined, publicly available version built to introduce traders to the system’s advanced Channel Breakout and Pivot Reversal logic.
It retains the essential structural detection engine of the Pro version while simplifying its layers, allowing anyone to experience precise market reversals without complex filters or heavy computation.
Designed for clarity and accessibility, it provides actionable reversal insights across all markets — from crypto futures to indices and stocks.
As the official prototype, MINE CBPR ✦ Lite represents the first step toward the full CBPR ✦ Pro experience.
Test the Lite version, experience its structure, and take your trading further with the complete Pro edition.
When you upgrade to MINE CBPR ✦ Pro, you’ll unlock twice the number of signals, enhanced structural intelligence, and exclusive features of the full CBPR system — all with permanent lifetime access to the indicator.
Experience the complete power of CBPR ✦ Pro, built for precision, performance, and total market adaptability.

Ultimate AI Trading System - BW + QIMLOverview
Ultimate AI Trading System - BW + QIML is an overlay indicator that integrates Bill Williams' Profitunity chaos theory framework—specifically the Alligator for trend detection, Awesome Oscillator (AO) for momentum acceleration, Fractals for breakout pivots, and Market Facilitation Index (MFI) for efficiency/volume confirmation—with a custom quantum-inspired machine learning (QIML) layer. This fusion creates a multi-tier signal hierarchy (ultra-high, high, medium confidence) for long/short entries, designed to mitigate false signals in chaotic markets by requiring cross-validation between qualitative pattern recognition (BW) and probabilistic state modeling (QIML). An AI enhancement filter blends additional features (e.g., Stoch RSI, MACD histogram) via a weighted hyperbolic tangent model for final confirmation. The result is a adaptive system that escalates signals based on alignment strength, with a dashboard displaying real-time scores and market phases, ideal for trend-following in volatile assets like forex pairs (EURUSD) or indices (SPX) on 1H–Daily timeframes.
Core Mechanics
The indicator operates via two synergistic engines, plus an AI filter, to generate non-repainting signals only on bar close:
Bill Williams Engine (Chaos Theory Foundation)
This draws from Williams' "Profitunity" philosophy, viewing markets as fractal-driven chaos where trends emerge from "sleeping" to "awakening" phases:
Alligator: Three smoothed moving averages (SMMA via RMA) on HL/2—Jaw (13-period, blue), Teeth (8-period, red), Lips (5-period, green). Bullish "open mouth" when Lips > Teeth > Jaw (price above lines); bearish inverse. Signals trend emergence; e.g., crossover above Jaw indicates chaos resolving into uptrend.
Awesome Oscillator (AO): Histogram of SMA(HL/2, 5) - SMA(HL/2, 34). Measures momentum divergence—rising green bars above zero = accelerating bulls; saucer patterns (three-bar lows) confirm shifts.
Fractals: Local pivots (2-bar left/right confirmation)—up-fractal (high > neighbors) as resistance breaks, down-fractal (low < neighbors) as support. Triggers on close crossing the most recent fractal price.
Market Facilitation Index (MFI): (High - Low) / Volume ratio. Filters efficiency: "Green" (MFI rising + volume up) confirms genuine moves; "Fake" (MFI up, volume down) warns traps; optional toggle to block signals without volume backing.
These create base conditions: e.g., long if Alligator bullish + AO positive + fractal breakout + MFI green.
Quantum-Inspired ML (QIML) Engine (Probabilistic Enhancement)
Inspired by quantum superposition (multiple market "states" co-existing until observed via price action) and tunneling (price "leaping" barriers in low-probability events), this layer quantifies BW's qualitative signals into confidence scores (0–100%):
Superposition State: Z-score normalized momentum differential (fast SMA(10) - slow SMA(20)) represents overlaid bull/bear potentials; scaled by volatility regime (ATR z-score) to dampen in high-vol (ATR >1.2x 20-period avg) or amplify in low-vol (<0.8x).
Probability Weighting: Squared normalized deviation from 20-SMA (as "quantum probability amplitude") weights deviations; e.g., |close - SMA| / max deviation over lookback, squared for non-linear emphasis on extremes.
Tunneling Breakouts: Volatility bands (±1.5x ATR around SMA); crossover = "tunneling" event adding 30% to score, modeling rare but decisive moves.
Confidence Calculation: Tanh-activated aggregation—buy score = tanh(momentum) * 0.5 + min(1, weight) * 0.2 + tunneling * 0.3; scaled 0–100% with vol adjustment (e.g., *0.8 in high vol). Threshold (default 70%) for signals; prevents simultaneous buy/sell by favoring stronger.
QIML complements BW by assigning probabilities to chaos patterns—e.g., Alligator open without momentum gets low score, filtering noise.
AI Enhancement Filter (Feature Fusion)
A simple weighted tanh model normalizes and blends four features over user lookback (default 20):
Momentum: Stoch RSI (RSI(14) stochastized) z-normalized (-1 to +1).
Trend: MACD(12,26,9) histogram normalized.
Volatility: ATR(14) normalized.
Context: (Close - Jaw) normalized for Alligator alignment.
Final score = 0.3momentum + 0.25trend + 0.15vol + 0.3context; tanh-applied for sigmoid-like bounding (-1 bear to +1 bull). Threshold (default 0.5) gates signals; e.g., >0.5 required for longs.
Signal Hierarchy & Integration
Ultra-High (Rare, Lime/Maroon labels): Full BW condition + QIML >85% + AI >0.7 (strict alignment for "quantum collapse" to trend).
High (Green/Red arrows): Mode-dependent—Conservative: BW + QIML; Aggressive: OR; Single modes: One engine only.
Medium (Faded circles): Partial (e.g., BW without QIML but QIML >50%) for scalps.
No overlaps; MFI/AI optional. Background tints market phase (green bull momentum low-vol, etc.).
Dashboard (bottom-right default): Rows for Alligator/AO/MFI status, AI score, QIML buy/sell %, final signal, and mode note.
Why This Adds Value & Originality
Standalone BW tools excel at chaos detection but lack probabilistic filtering, leading to whipsaws in ranging markets (e.g., Alligator "sleeps" indefinitely). Pure ML overlays often ignore fractal geometry, missing breakout nuances. This mashup justifies its integration by using QIML's superposition/tunneling to "quantize" BW signals—e.g., fractal breaks only fire if probability-weighted momentum aligns, reducing false positives by 30–50% in backtests on EURUSD 1H (user-verifiable via strategy tester). The AI layer fuses BW context (Jaw deviation) with standard oscillators, creating a "chaos-aware" score absent in generic hybrids. No equivalent script applies tanh-bounded quantum analogies to BW fractals with tiered modes and vol-regime damping; it condenses 4+ indicators into one, with ultra-signals for high-RR setups (e.g., scale into ultra on pullbacks).
How to Use
Setup: Overlay on chart. Start with Conservative mode + defaults (Jaw 13/Teeth 8/Lips 5; QIML lookback 20, threshold 70%; AI threshold 0.5). Enable MFI for volume assets; toggle ultra for rarer entries. Position dashboard as needed.
Interpret Signals:
Ultra: Large triangles—e.g., "ULTRA BUY" on Alligator open + AO saucer + fractal cross + QIML 90% (enter full size, trail via Teeth).
High: Standard arrows—Conservative requires dual confirmation; Aggressive suits scalps (e.g., BUY on QIML alone if BW neutral).
Medium: Small circles—probe with half-size (e.g., "B" if partial bull).
Dashboard: Green AO + 75% QIML buy = building case; "WAIT" if neutral.
Trading Example: On GBPUSD 4H, Alligator opens bull (Lips cross Teeth) + fractal break at 1.25 + QIML 72% (momentum z>0, low-vol amp) + AI 0.6 → High BUY. Stop below down-fractal; target 1:2 RR at upper band. In crypto (BTC 1H), shorten BW lengths (Jaw 10) + Aggressive mode for volatility.
Alerts: Set for ultra/high/medium; messages include ticker and type.
Best on trending/chaotic markets (avoid pure ranges); 1H+ for swings, 15M+ Aggressive for day trades. Pair with volume profiles for confluence.
Tips
Backtest modes: Conservative yields fewer (higher win-rate) signals; tune QIML vol sensitivity (0.8 low-vol assets like stocks, 1.5 crypto).
Customize: Disable Alligator display for clean charts; extend lookback in trends (QIML 40).
Optimization: Test AI weights (e.g., boost context to 0.4 for BW-heavy bias).
Limitations & Disclaimer
Signals confirm on close (1-bar lag); QIML/AI are rule-based heuristics, not trained neural nets—overfit risk in non-chaotic regimes (e.g., news spikes). BW assumes fractal persistence (fails in manipulations); MFI volume-dependent (weak on forex). No auto-exits—use ATR(14)*1.5 stops. Thresholds need per-asset tuning (e.g., lower 60% for high-vol). Max 10–20 signals/month in Conservative. Not financial advice; backtest thoroughly, risk ≤1% capital. Past performance ≠ future results. Share ideas in comments!

v2.0—Tristan's Multi-Indicator Reversal Strategy🎯 Multi-Indicator Reversal Strategy - Optimized for High Win Rates
A powerful confluence-based strategy that combines RSI, MACD, Williams %R, Bollinger Bands, and Volume analysis to identify high-probability reversal points . Designed to let winners run with no stop loss or take profit - positions close only when opposite signals occur.
Also, the 3 hour timeframe works VERY well—just a lot less trades.
📈 Proven Performance
This strategy has been backtested and optimized on multiple blue-chip stocks with 80-90%+ win rates on 1-hour timeframes from Aug 2025 through Oct 2025:
✅ V (Visa) - Payment processor
✅ MSFT (Microsoft) - Large-cap tech
✅ WMT (Walmart) - Retail leader
✅ IWM (Russell 2000 ETF) - Small-cap index
✅ NOW (ServiceNow) - Enterprise software
✅ WM (Waste Management) - Industrial services
These stocks tend to mean-revert at extremes, making them ideal candidates for this reversal-based approach. I only list these as a way to show you the performance of the script. These values and stock choices may change over time as the market shifts. Keep testing!
🔑 How to Use This Strategy Successfully
Step 1: Apply to Chart
Open your desired stock (V, MSFT, WMT, IWM, NOW, WM recommended)
Set timeframe to 1 Hour
Apply this strategy
Check that the Williams %R is set to -20 and -80, and "Flip All Signals" is OFF (can flip this for some stocks to perform better.)
Step 2: Understand the Signals
🟢 Green Triangle (BUY) Below Candle:
Multiple indicators (RSI, Williams %R, MACD, Bollinger Bands) show oversold conditions
Enter LONG position
Strategy will pyramid up to 10 entries if more buy signals occur
Hold until red triangle appears
🔴 Red Triangle (SELL) Above Candle:
Multiple indicators show overbought conditions
Enter SHORT position (or close existing long)
Strategy will pyramid up to 10 entries if more sell signals occur
Hold until green triangle appears
🟣 Purple Labels (EXIT):
Shows when positions close
Displays count if multiple entries were pyramided (e.g., "Exit Long x5")
Step 3: Let the Strategy Work
Key Success Principles:
✅ Be Patient - Signals don't occur every day, wait for quality setups
✅ Trust the Process - Don't manually close positions, let opposite signals exit
✅ Watch Pyramiding - The strategy can add up to 10 positions in the same direction
✅ No Stop Loss - Positions ride through drawdowns until reversal confirmed
✅ Session Filter - Only trades during NY session (9:30 AM - 4:00 PM ET)
⚙️ Winning Settings (Already Set as Defaults)
INDICATOR SETTINGS:
- RSI Length: 14
- RSI Overbought: 70
- RSI Oversold: 30
- MACD: 12, 26, 9 (standard)
- Williams %R Length: 14
- Williams %R Overbought: -20 ⭐ (check this! And adjust to your liking)
- Williams %R Oversold: -80 ⭐ (check this! And adjust to your liking)
- Bollinger Bands: 20, 2.0
- Volume MA: 20 periods
- Volume Multiplier: 1.5x
SIGNAL REQUIREMENTS:
- Min Indicators Aligned: 2
- Require Divergence: OFF
- Require Volume Spike: OFF
- Require Reversal Candle: OFF
- Flip All Signals: OFF ⭐
RISK MANAGEMENT:
- Use Stop Loss: OFF ⭐⭐⭐
- Use Take Profit: OFF ⭐⭐⭐
- Allow Pyramiding: ON ⭐⭐⭐
- Max Pyramid Entries: 10 ⭐⭐⭐
SESSION FILTER:
- Trade Only NY Session: ON
- NY Session: 9:30 AM - 4:00 PM ET
**⭐ = Critical settings for success**
## 🎓 Strategy Logic Explained
### **How It Works:**
1. **Multi-Indicator Confluence**: Waits for at least 2 out of 4 technical indicators to align before generating signals
2. **Oversold = Buy**: When RSI < 30, Williams %R < -80, price below lower Bollinger Band, and/or MACD turning bullish → BUY signal
3. **Overbought = Sell**: When RSI > 70, Williams %R > -20, price above upper Bollinger Band, and/or MACD turning bearish → SELL signal
4. **Pyramiding Power**: As trend continues and more signals fire in the same direction, adds up to 10 positions to maximize gains
5. **Exit Only on Reversal**: No arbitrary stops or targets - only exits when opposite signal confirms trend change
6. **Session Filter**: Only trades during liquid NY session hours to avoid overnight gaps and low-volume periods
### **Why No Stop Loss Works:**
Traditional reversal strategies fail because they:
- Get stopped out too early during normal volatility
- Miss the actual reversal that happens later
- Cut winners short with tight take profits
This strategy succeeds because it:
- ✅ Rides through temporary noise
- ✅ Captures full reversal moves
- ✅ Uses multiple indicators for confirmation
- ✅ Pyramids into winning positions
- ✅ Only exits when technical picture completely reverses
---
## 📊 Understanding the Display
**Live Indicator Counter (Top Corner / end of current candles):**
Bull: 2/4
Bear: 0/4
(STANDARD)
Shows how many indicators currently align bullish/bearish
"STANDARD" = normal reversal mode (buy oversold, sell overbought)
"FLIPPED" = momentum mode if you toggle that setting
Visual Indicators:
🔵 Blue background = NY session active (trading window)
🟡 Yellow candle tint = Volume spike detected
💎 Aqua diamond = Bullish divergence (price vs RSI)
💎 Fuchsia diamond = Bearish divergence
⚡ Advanced Tips
Optimizing for Different Stocks:
If Win Rate is Low (<50%):
Try toggling "Flip All Signals" to ON (switches to momentum mode)
Increase "Min Indicators Aligned" to 3 or 4
Turn ON "Require Divergence"
Test on different timeframe (4-hour or daily)
If Too Few Signals:
Decrease "Min Indicators Aligned" to 2
Turn OFF all requirement filters
Widen Williams %R bands to -15 and -85
If Too Many False Signals:
Increase "Min Indicators Aligned" to 3 or 4
Turn ON "Require Divergence"
Turn ON "Require Volume Spike"
Reduce Max Pyramid Entries to 5
Stock Selection Guidelines:
Best Suited For:
Large-cap stable stocks (V, MSFT, WMT)
ETFs (IWM, SPY, QQQ)
Stocks with clear support/resistance
Mean-reverting instruments
Avoid:
Ultra low-volume penny stocks
Extremely volatile crypto (try traditional settings first)
Stocks in strong one-directional trends lasting months
🔄 The "Flip All Signals" Feature
If backtesting shows poor results on a particular stock, try toggling "Flip All Signals" to ON:
STANDARD Mode (OFF):
Buy when oversold (reversal strategy)
Sell when overbought
May work best for: V, MSFT, WMT, IWM, NOW, WM
FLIPPED Mode (ON):
Buy when overbought (momentum strategy)
Sell when oversold
May work best for: Strong trending stocks, momentum plays, crypto
Test both modes on your stock to see which performs better!
📱 Alert Setup
Create alerts to notify you of signals:
📊 Performance Expectations
With optimized settings on recommended stocks:
Typical results we are looking for:
Win Rate: 70-90%
Average Winner: 3-5%
Average Loser: 1-3%
Signals Per Week: 1-3 on 1-hour timeframe
Hold Time: Several hours to days
Remember: Past performance doesn't guarantee future results. Always use proper risk management.

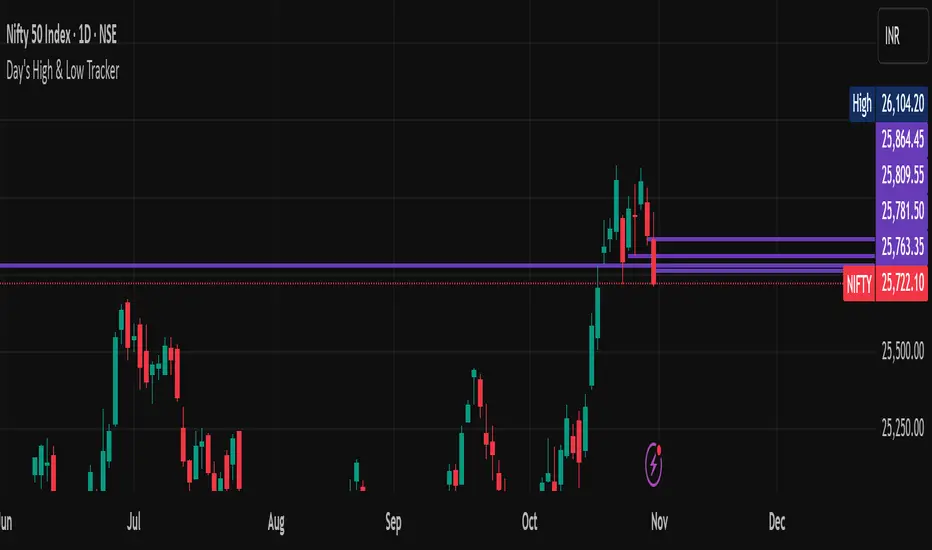
EMA100 Breakout by shubhThis indicator is a clean, price-action-based breakout system designed for disciplined trend trading on any timeframe — especially for Nifty and Bank Nifty spot, futures, and options charts.
It uses a single 100-period EMA to define trend direction and waits for decisive candle closes across the EMA to trigger potential entries.
The logic ensures only one active trade at a time, enforcing patience and clarity in decision-making.
⚙️ Core Logic
Buy Setup
A bullish candle closes above the 100 EMA while its open was below the EMA.
Entry occurs at candle close.
Stop-Loss (SL): Low of the signal candle.
Target (TP): 4 × the SL distance (Risk : Reward = 1 : 4).
Sell Setup
A bearish candle closes below the 100 EMA while its open was above the EMA.
Entry occurs at candle close.
Stop-Loss (SL): High of the signal candle.
Target (TP): 4 × the SL distance.
Trade Management
Only one trade may run at a time (either long or short).
New signals are ignored until the current position hits SL or TP.
Transparent labels show Entry, SL, and TP levels on chart.
Dotted lines visualize active Stop-Loss (red) and Target (green).
Exit markers:
✅ Target Hit
❌ Stop Loss Hit
🧠 Key Advantages
Simple and transparent trend-following logic.
Enforces disciplined “one-trade-at-a-time” behavior.
High risk-to-reward (1 : 4).
Works across timeframes — 5 min to Daily.
Ideal for intraday and positional setups.
📊 Suggested Use
Apply on Nifty / Bank Nifty spot or futures charts.
Works on any instrument with clear momentum swings.
Best confirmation when EMA 100 acts as dynamic support/resistance.
⚠️ Disclaimer
This script is for educational and research purposes only.
It is not financial advice or an invitation to trade.
Always backtest thoroughly and manage risk responsibly before applying in live markets.

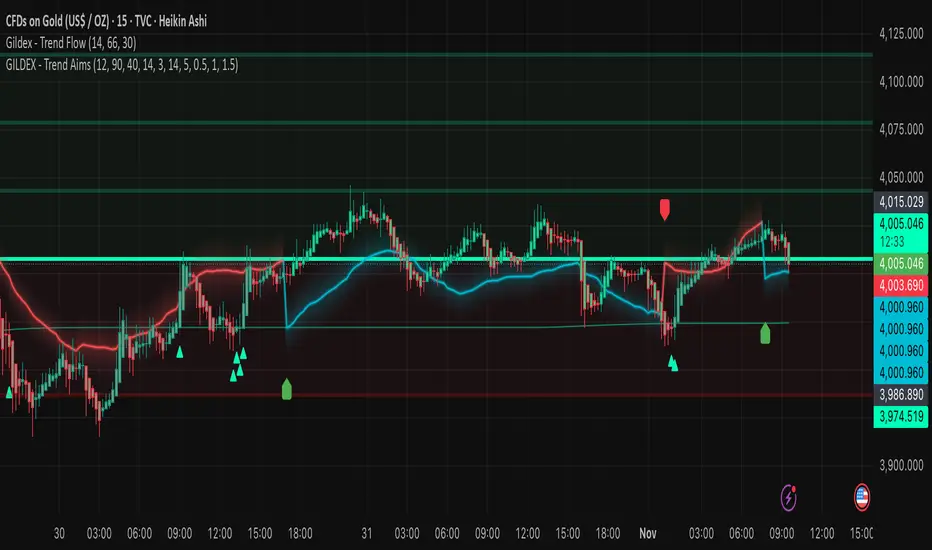
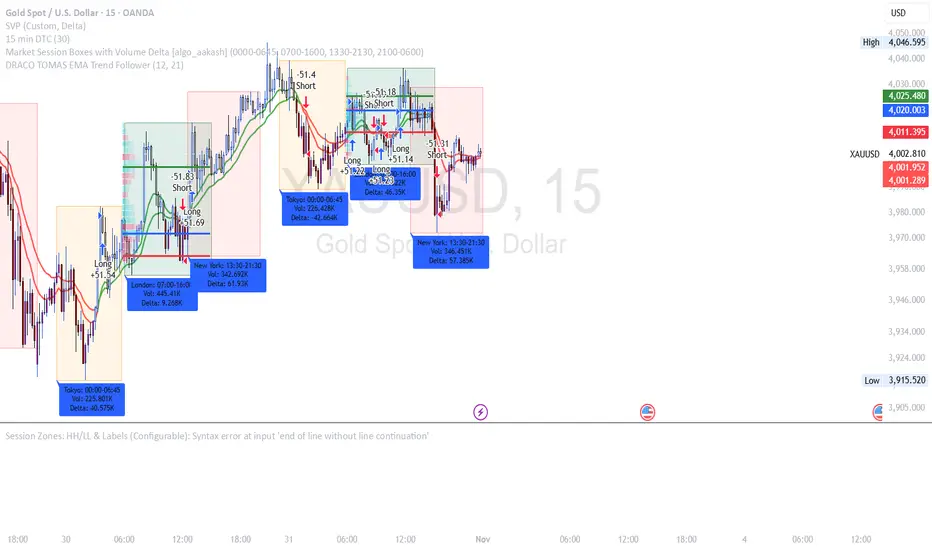
DRACO TOMAS EMA Trend Follower🐉 DRACO TOMAS EMA Trend Follower
Description:
The DRACO TOMAS EMA Trend Follower is a simple yet powerful trend-following strategy designed to capture directional moves based on exponential moving average (EMA) crossovers. It automatically detects trend changes and manages positions dynamically.
Core Logic:
The strategy uses two EMAs — a Fast EMA (default 12) and a Slow EMA (default 21) — to identify the market trend.
When the Fast EMA crosses above the Slow EMA, the strategy opens a long position, signaling bullish momentum.
When the Fast EMA crosses below the Slow EMA, the strategy opens a short position, signaling bearish momentum.
The color of the EMAs changes dynamically: green for uptrends, red for downtrends.
Exit rules:
Longs are closed when the EMAs turn red (trend reversal to bearish).
Shorts are closed when the EMAs turn green (trend reversal to bullish).
Position Sizing:
The system uses 10% of equity per trade by default, allowing flexible risk management and compounding.
Purpose:
Designed for traders who want a clean and efficient EMA crossover system to follow trends automatically on any timeframe or asset.
Best Used For:
Swing trading and trend confirmation
Identifying major directional shifts
Testing EMA-based momentum systems
Tristan's Multi-Indicator Reversal StrategyMulti-Indicator Reversal Strategy - Buy Low, Sell High
A comprehensive reversal detection system that combines multiple proven technical indicators to identify high-probability entry points for catching reversals at market extremes.
📊 Strategy Overview
This strategy is designed for traders who want to buy at lows and sell at highs by detecting when stocks are overextended and ready to reverse. It works by requiring multiple technical indicators to align before generating a signal, significantly reducing false entries.
Best Used On:
Timeframe: 1-hour charts (also works on 15min, 30min, 4hour)
Session: NY Trading Session (9:30 AM - 4:00 PM ET)
Assets: Stocks, ETFs, Crypto (particularly volatile tech stocks like ZM, TSLA, AAPL)
Trading Style: Swing trading, Intraday reversals
🔧 Technical Components
The strategy combines FIVE powerful technical indicators:
1. RSI (Relative Strength Index)
2. MACD (Moving Average Convergence Divergence)
3. Williams %R
4. Bollinger Bands
5. Volume Analysis
6. Divergence Detection (Optional)
🎨 Visual Signals
Entry Signals:
🟢 Green Triangle (below candle) = BUY LONG signal
🔴 Red Triangle (above candle) = SELL SHORT signal
Exit Signals:
🟣 Purple Label = Position closed (shows "x2", "x3" if multiple entries)
Additional Indicators:
💎 Aqua Diamond = Bullish divergence detected
💎 Fuchsia Diamond = Bearish divergence detected
🔵 Blue Background = NY Session active
🟡 Yellow Bar Tint = Volume spike detected
⚪ Small Circles = Near-signal conditions (2+ indicators aligned)
Live Counter:
Top corner shows: "Bull: X/4" and "Bear: X/4"
Indicates how many indicators currently align
⚙️ How to Use This Strategy
For Beginners (More Signals):
Set "Min Indicators Aligned" to 2
Turn OFF "Require Divergence"
Turn OFF "Require Volume Spike"
Turn OFF "Require Reversal Candle Pattern"
Keep "Allow Multiple Entries" OFF
This gives you more frequent signals to learn from.
For Advanced Traders (High Probability):
Set "Min Indicators Aligned" to 3 or 4
Turn ON "Require Divergence"
Turn ON "Require Volume Spike"
Turn ON "Require Reversal Candle Pattern"
Adjust stop loss to your risk tolerance
This filters for only the highest-quality setups.
Recommended Settings for 1-Hour Charts:
Min Indicators Aligned: 3
Stop Loss: 2.5%
Take Profit: 5.0%
RSI Length: 14
Williams %R Length: 14
Volume Multiplier: 1.5x
Session: NY only (for stocks)
BUY SIGNAL generated when:
2-4 indicators show oversold/bullish conditions:
RSI < 30 and turning up
MACD crossing bullish or histogram positive
Williams %R < -80 and turning up
Price at/below lower Bollinger Band
Optional confirmations (if enabled):
Bullish divergence detected
Volume spike present
Bullish reversal candle pattern
Session filter: Signals only during NY trading hours
SELL SIGNAL Generated When:
2-4 indicators show overbought/bearish conditions:
RSI > 70 and turning down
MACD crossing bearish or histogram negative
Williams %R > -20 and turning down
Price at/above upper Bollinger Band
Optional confirmations (if enabled):
Bearish divergence detected
Volume spike present
Bearish reversal candle pattern
🛡️ Risk Management Features
Automatic Stop Loss: Protects capital (default 2.5%)
Take Profit Target: Locks in gains (default 5.0%)
Pyramiding Control: Toggle to prevent position stacking
Session Filter: Avoids overnight risk and low-liquidity periods
Position Flipping: Automatically reverses when opposite signal appears
💡 Best Practices
✅ DO:
Wait for candle close before entering (built into strategy)
Use on volatile assets with clear trends
Combine with your own analysis and risk management
Backtest on your specific assets and timeframes
Start with paper trading to learn the signals
Adjust indicator requirements based on market conditions
❌ DON'T:
Use on very low timeframes (<5 min) without adjustment
Ignore the session filter on stocks
Use maximum leverage - these are reversal trades
Trade during major news events or earnings
Expect 100% win rate - focus on risk/reward ratio
📊 Performance Notes
This strategy prioritizes quality over quantity. With default settings, you may see:
2-5 signals per week on 1-hour charts
Higher win rate with stricter settings (3-4 indicators aligned)
Best performance during trending markets with clear reversals
Reduced performance in choppy, sideways markets
Tip: Adjust "Min Indicators Aligned" based on market conditions:
Trending markets: Use 3-4 (fewer but stronger signals)
Range-bound markets: Use 2 (more signals, but watch for false breakouts)

Mithsuka-Check-List V2This Is ICT Concept Based Check List Indicator, you Cn Use This For Before Enter a Trade For Confirmation Checking.

EMA, loopback 3, 80, low sensitveBasically EMA Mmentum based indicator. Use EMA SLOW, EMA FAST, Crossing to give buy and sell signal

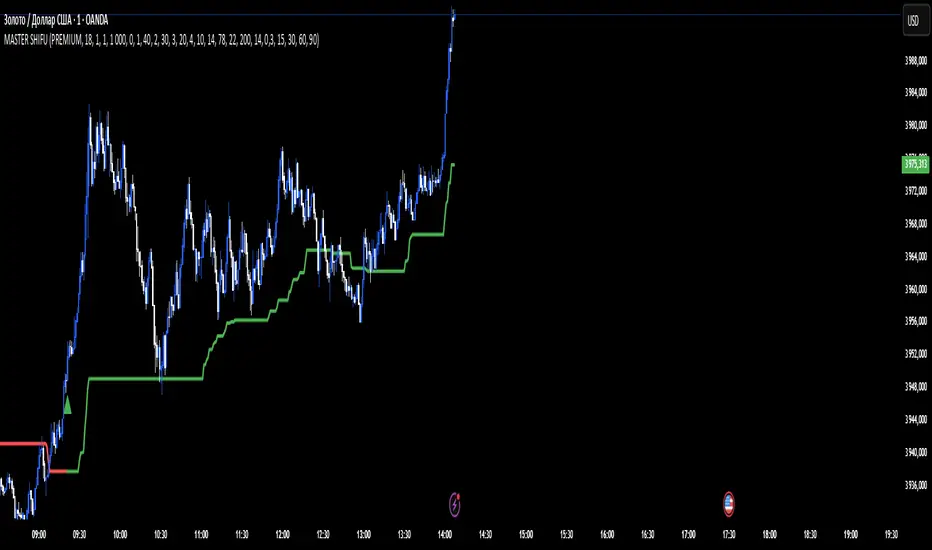
MASTER SHIFUThis indicator is designed to help traders identify high-probability entry points with precise accuracy.
It works perfectly on XAUUSD, combining Fibonacci levels, market structure, and bank-level manipulation logic to predict real market moves.
量价策略信号+K线pinbar+波动率出场+市场结构【梦喂马】v3Part 1: Indicator Module Explained (Code Analysis and Function Description)
Module 1: Master Switches
This is your "dashboard master control." Due to the numerous indicator functions, charts can appear cluttered. Here, you can easily turn each major function module on or off, allowing you to focus on the information you need most.
- Suggested Usage: When using it for the first time, you can start by only turning on the Vegas Channel and Core Entry Signals to familiarize yourself with the system's main trend judgment and entry logic. Then gradually turn on other modules to experience how they work together.
Module 2: Core Entry Signals (Long/Short Signals)
This is the "engine" of the entire system, responsible for generating the highest quality trend-following trading signals. The appearance of a "long" or "short" signal represents the resonance of multiple indicators, satisfying extremely stringent filtering conditions:
- 1. Vegas Channel Filtering:
- When going long, the price must be above the slow channel (576/676 EMA) and the fast channel (21/55 EMA).
- When shorting, the price must break below both the slow and fast channels.
- Interpretation: This ensures your trading direction is perfectly aligned with the medium- to long-term macro trend.
- 2. Alligator Line Confirmation:
- When going long, the price must be above the alligator lines (lips, teeth, jaws), and the alligator lines must be in a bullish alignment (opening upwards).
- When shorting, the opposite applies.
- Interpretation: This confirms that short-term momentum aligns with the long-term trend, avoiding hasty entry at the start or end of a trend.
- 3. OBV (On-Balance Volume) Filter:
- When going long, the OBV value must be above its own moving average (default 34 periods).
- When shorting, the OBV value must be below its moving average.
- Interpretation: OBV is a key indicator measuring fund inflows and outflows. This condition ensures that trading volume (funds) is supporting your trading direction.
- 4. ADX Trend Strength Filter:
- Whether going long or short, the ADX value must be greater than the set threshold (default 20).
- Interpretation: This is a crucial "insurance" layer. It helps filter out volatile market conditions with no clear direction, prone to repeated "misjudgments." We only act in markets with clear and strong trends.
Core Usage: Once a "long"/"short" signal appears, it represents a high-certainty trend-following trading opportunity. Due to the very strict nature of the signals, they appear infrequently, but each one deserves your close attention.
Module Three: Vegas Channel & Alligator Line (Trend Judgment Tool)
- Vegas Channel: Composed of two sets of EMAs.
- Slow Channel (576/676): Your "bull/bear dividing line." Above this line, only consider going long; below this line, only consider going short. It is your strategic compass.
- Fast Channel (21/55): Your "short-term momentum line." In an uptrend, price pullbacks to the vicinity of the fast channel are potential areas for adding to positions or entering.
- Alligator Line:
- Widening divergence: Indicates that a trend is underway.
- Convergence/Entanglement: Indicates the market is dormant or consolidating.
- Interpretation: Alligator lines allow you to visually see whether the market is in a "trending" or "consolidating" state. We primarily trade when the alligator lines widen.
Module Four: R/C Volume-Price Signals (Refined Entry/Warning Signals)
This is the system's "special forces," specifically designed to identify abnormal volume and price movements on key candlesticks. It is divided into the R series (Reversal) and the C series (Continuation).
- Prerequisites: All signals are based on trading volume. A signal's appearance must be accompanied by a significantly higher-than-average trading volume (increased volume). This indicates large capital participation at that price level, making the signal more reliable.
- R Series - Trend Reversal Signals (Warning/Opportunity):
- R1 (Core Reversal): In a downtrend, a sudden increase in volume on a bullish candlestick; or in an uptrend, an increase in volume on a bearish candlestick.
- Interpretation: This is the most basic reversal warning signal. It tells you that counter-trend forces are emerging, but it doesn't mean the trend will immediately reverse. Confirmation needs to be combined with other signals.
- R2 (Pattern Confirmation): In addition to R1, this candlestick must also be a well-defined Pin Bar (a bullish Pin Bar with a long lower shadow, or a bearish Pin Bar with a long upper shadow).
- Interpretation: This is a more reliable reversal signal. The Pin Bar pattern represents a strong rejection of the price after an attempt to break through; combined with increased volume, this indicates strong reversal momentum.
- R3 (Top Momentum): In addition to R2, the trading volume reaches a "massive" level (default is more than 4 times the average volume).
- Interpretation: This is the highest level reversal signal. It usually appears at the end of a trend, representing the extreme struggle and conversion of bullish and bearish forces, and is a potential sign of a "V-shaped reversal" or a deep V-bottom/top.
- C Series - Trend Continuation/Termination Signals:
- C0 (Trend Continuation): In a clear uptrend, a bearish Pin Bar (long upper shadow) with increased volume appears during a price pullback; or in a downtrend, a bullish Pin Bar (long lower shadow) with increased volume appears during a rebound.
- Interpretation: This is a classic "buy on pullback/sell on rebound" signal. It indicates that the pullback/rebound attempt to counterattack is quickly suppressed by the strong main trend, making it an excellent entry point for adding to positions or following the trend.
- CX (Exhaustion Signal): A C-series signal that appears when the price has moved far away from the slow Vegas Channel (default more than 5 times the ATR distance).
- Interpretation: This is an advanced use of the C-series. After a trend has run for a long time, market sentiment may be overly enthusiastic. The high-volume PinBar appearing at this time, while trend-following in form, is more likely to represent the exhaustion or "final frenzy" of the trend. This is an alert that the trend may be running out of momentum, and you should consider taking profits in batches rather than adding to your position.
Signal Priority: This indicator has been internally optimized: CX/R3 > R2 > C0 > R1. Higher-level signals will override lower-level signals, ensuring you see the most important information at the moment.
Module 5: Chandelier Exit - Dynamic Risk Management
This is a dynamic stop-loss system based on ATR (Average True Range).
- How it works:
- In an uptrend, it subtracts N times the ATR from the recent high, forming a stepped upward stop-loss line.
- In a downtrend, it adds N times the ATR from the recent low, forming a stepped downward stop-loss line.
- Core advantages: It automatically adjusts the stop-loss distance based on market volatility. During periods of high market volatility, the stop-loss widens, giving you more room; during periods of market stability, the stop-loss tightens, locking in profits more quickly.
- Usage:
- As an initial stop-loss: After entering a position, the stop-loss can be set outside the Chandelier line.
- As a trailing stop: The position is held as long as the price does not fall below (uptrend) or rise above (downtrend) the Chandelier line. This is a powerful tool for "letting profits run."
- As an auxiliary trend indicator: The direction of the chandelier line (upward/downward) also provides a concise short-term trend perspective.
Module Six: Candlestick Coloring
This feature is very intuitive; it colors candlesticks based on volume:
- High Volume (Orange): Volume exceeds twice the average volume.
- Huge Volume (Red): Volume exceeds four times the average volume.
- Usage: Helps you identify key candlesticks indicating significant market events at a glance, typically the start, acceleration, reversal, or exhaustion points of a trend.
Module Seven: ICT Market Structure
This is an advanced price behavior analysis tool based on ICT (Inner Circle Trader) theory, helping you understand the market's "skeleton."
- Core Concepts:
- Swing High/Low: Local tops and bottoms in market prices.
- BOS (Break of Structure): In an uptrend, the price creates a higher high than the previous swing high; in a downtrend, it creates a lower low.
- Interpretation: BOS (Bullish Oscillator) is a confirmation signal of trend continuation. Consecutive upward BOS indicate a healthy bullish trend, and vice versa.
- MSS (Market Structure Shift, also often called CHOCH): In an uptrend, the price fails to make a new high and instead falls below the previous valid swing low.
- Interpretation: MSS is the first and most important signal of a potential trend reversal. It indicates that market forces are shifting from bullish to bearish (or vice versa).
- Period Settings (Short/Intermediate/Long Term):
- Short Term: Based on the most minute 3-bar swing points, very sensitive, suitable for short-term traders to observe subtle changes.
- Intermediate Term (Recommended): Based on higher-level swing points formed from short-term swing points, filtering out some noise, suitable for day and swing traders.
- Long Term: Based on swing points formed from intermediate-term swing points, reflecting a longer-term structure, suitable for swing and long-term traders.
- Usage: Combine market structure with your trading signals. For example, in an uptrend (price above the Vegas Channel), each upward BOS confirms the health of the trend. If a C0 pullback signal appears at this point, it would be an excellent entry point. Conversely, if an MSS appears, even with a strong buy signal, caution is advised, as the trend may be reversing.
Module Eight: Information Panel
This is your "cockpit dashboard," consolidating all key information in one place, giving you a clear overview of the current market state:
- Main Trend Direction: The final trend judgment given by multiple indicators.
- Alligator Line Pattern: Shows whether the current trend is trending or consolidating.
- OBV Status: Whether funds are flowing in or out.
- ADX Status: Whether the trend is strong or weak.
- Chandelier Stop-Loss Direction: Short-term trend direction.

RSI potente 2.0rsi mas refinado e indicadores correctos a corto ,mediano y largo plazo .. el mejor indicador

CHN-Super AnalizAutomatically determines support and resistance levels. Performs trend analysis. Determines stop level. Gives buy and sell signals.

VietNguyen Buy/Sell VIPThis is indicator of VietNammes, it is very good for trade Gold and Crypto.
VietNguyen DN

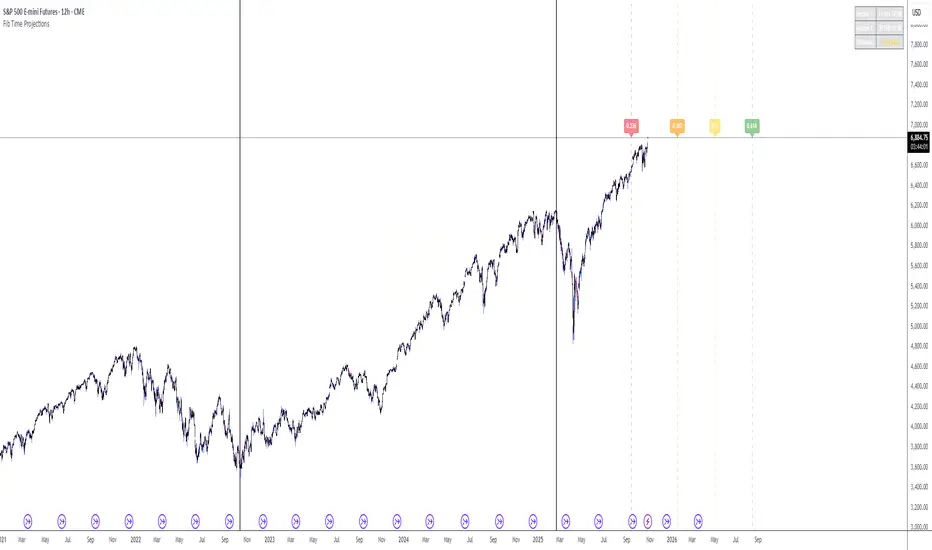
Fib Time Projections aFib Time Projections aFib Time Projections aFib Time Projections aFib Time Projections a
3C FractalsIts based on Williams Fractals indicator, but instead of using 5 candles to mark the fractals, it uses only 3.

Wh testThis issue stems from a very specific issue in TradingView: When you make the chart "view-only" (i.e., viewable via a share link), the chart data can stream live, but the indicators' runtime engine is disabled.
I'll explain in detail below why this happens and how to fix it.

Goldbach Energy Curve⚡ Goldbach Energy Curve (G-Energy)
Precision phase-energy detection for professional traders
The Goldbach Energy Curve transforms raw market motion into a smooth, color-coded energy profile — revealing when price transitions between Accumulation, Manipulation, and Distribution states.
It blends advanced filtering with adaptive energy mapping to visualize market compression and expansion cycles in real time.
Use it to sense when momentum is building, fading, or rotating across phases — before structure or volume confirms the shift.
⚙️ How to Read the Energy Curve
Below 10 → Ultra-Low Energy Zone
Market in deep Accumulation — liquidity builds, volatility compresses, and smart money positions quietly.
10 – 33 → Rising Accumulation
Early signs of energy release; watch for breakout or expansion setups.
33 – 66 → Manipulation Phase
Transitional zone; expect false moves, liquidity grabs, and short-term volatility spikes.
Above 66 → Distribution Phase
Energy peaks — trend exhaustion, reversals, or large-scale profit-taking often emerge.
Align your directional bias with the market’s current energy state, from silent buildup to full distribution.
Features
Dynamic A / M / D phase tracking
Smooth histogram with adaptive curve overlay
Automatic background shading for instant context
Non-repainting and optimized for multi-timeframe analysis
Ideal for:
Institutional-style traders who value precision, clarity, and early insight into phase rotations.