Ehlers Combo Strategy🚀 Presenting the Enhanced Ehlers Combo Strategy 🚀
Hello Traders! 👋 I'm thrilled to share the latest version of the Ehlers Combo Strategy v2.0. This powerful algorithm combines Ehlers Elegant Oscillator, Decycler, Instantaneous Trendline, Spearman Rank, and introduces the Signal to Noise Ratio for even more precise trading signals.
📊 Strategy Highlights:
Ehlers Elegant Oscillator: Captures market momentum and turning points.
Ehlers Decycler: Filters out market noise for clearer trend signals.
Instantaneous Trendline: Offers a dynamic view of the market trend.
Spearman Rank: Analyzes market rank correlations for enhanced insights.
Signal to Noise Ratio (SNR): Filters out noise for more accurate signals.
💡 Key Features & Customizations:
Adaptive Length: Enable adaptive length based on the market's current conditions.
SNR Threshold: Set your desired SNR threshold for filtering signals.
Exit Length: Define the length for exit signals.
📈 Trading Signals:
Long Entry: Elegant Oscillator and Decycler cross above 0, source crosses above Decycler, source is greater than an increasing Instantaneous Trendline, Spearman Rank is positive, and SNR exceeds the threshold.
Long Exit: Source crosses below the Instantaneous Trendline after entering a long position.
Short Entry: Elegant Oscillator and Decycler cross below 0, source crosses below Decycler, source is less than a decreasing Instantaneous Trendline, Spearman Rank is negative, and SNR exceeds the threshold.
Short Exit: Source crosses above the Instantaneous Trendline after entering a short position.
📊 Insights & Enhancements:
Dynamic Length: The strategy adapts its length dynamically based on market conditions.
Improved SNR: Signal to Noise Ratio ensures better filtering of signals.
Enhanced Visualization: The Elegant Oscillator now features improved color coding for a clearer interpretation.
🚨 Disclaimer:
Trading involves risk, and this script should be used judiciously. It's not a guaranteed profit machine, but with careful use, it can be a valuable addition to your toolkit.
Feel free to backtest, tweak, and make it your own! Let's conquer the markets together! 💪📈
🚀✨ Happy Trading! ✨🚀
---
🙌 Credits:
A big shoutout to the original contributors:
@blackcat1402
@cheatcountry
@DasanC
Buysell

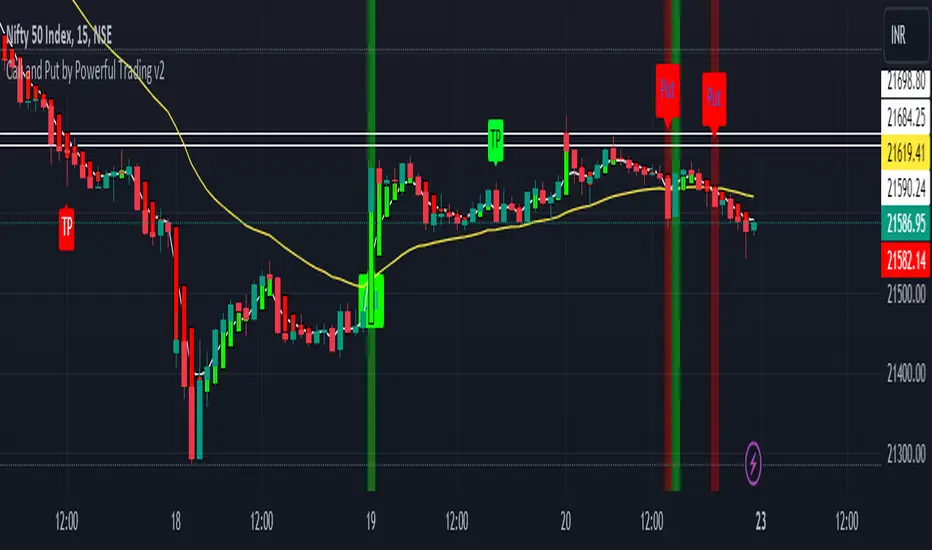
Call and Put by Powerful TradingThis script attempts to use Exponential Moving averages (short-term and long-term convergence) of different lengths in order to identify trade entries and exits for bullish & bearish trades. I would strongly recommend using it on Bank nifty , Nifty 50 . You use this script by entering a trade when it signals a green CALL signal with a UP label and exiting when it signals red put signal. The general idea is that one is fast and one is slow-moving EMA and these indicate when to buy/sell when they crossover the overbought/sold lines.
It also provides a vertical line with green and red color , when short ema is over it shows green vertical line and when short ema is below it provides red vertical line.
Best for bank nifty on 15 mins chart
BUY/SELL RSI FLIUX v1.0The "BUY/SELL RSI FLUX v1.0" indicator is designed to provide buy and sell signals based on the RSI (Relative Strength Index) and price action in relation to support and resistance levels. It overlays directly on the price chart and includes the following components:
- Support and Resistance Levels: Determined over a specified number of bars (lengthSR), these levels represent potential barriers where price action may stall or reverse.
- ATR (Average True Range): Used to measure market volatility. While it's calculated in the script, it's not visualized on the chart as per the latest modification.
- RSI: The RSI is calculated over a defined period (lengthRSI) and is used to identify overbought or oversold conditions. Buy signals are generated when the RSI is below the oversold threshold (rsiOversold) and the price is above the support level. Conversely, sell signals occur when the RSI is above the overbought threshold (rsiOverbought), the price is below the resistance level, and additionally, the price is below a long-term moving average, which acts as a trend filter.
- Long-Term Moving Average: This moving average is plotted to help identify the prevailing market trend. Sell signals are filtered based on the price's position in relation to this moving average.
- Buy/Sell Signals: Visual representations in the form of shapes are plotted below (for buy) or above (for sell) the price bars to indicate potential entry points.
By combining these elements, the indicator aims to provide high-probability trading signals that align with both the market's momentum and trend.

Ranges With Targets [ChartPrime]The Ranges With Targets indicator is a tool designed to assist traders in identifying potential trading opportunities on a chart derived from breakout trading. It dynamically outlines ranges with boxes in real-time, providing a visual representation of price movements. When a breakout occurs from a range, the indicator will begin coloring the candles. A green candle signals a long breakout, suggesting a potential upward movement, while a red candle indicates a short breakout, suggesting a potential downward movement. Grey candles indicate periods with no active trade. Ranges are derived from daily changes in price action.
This indicator builds upon the common breakout theory in trading whereby when price breaks out of a range; it may indicate continuation in a trend.
Additionally, users have the ability to customize their risk-reward settings through a multiplier referred to as the Target input. This allows traders to set their Take Profit (TP) and Stop Loss (SL) levels according to their specific risk tolerance and trading strategy.
Furthermore, the indicator offers an optional stop loss setting that can automatically exit losing trades, providing an additional layer of risk management for users who choose to utilize this feature.
A dashboard is provided in the top right showing the statistics and performance of the indicator; winning trades; losing trades, gross profit and loss and PNL. This can be useful when analyzing the success of breakout trading on a particular asset or timeframe.

DNS Relax Buy/SellDNS Relax Buy/Sell Indicator
It is a very simple indicator to use for long-term investors.
It uses ema 3 in Buy and Sell alerts. If ema 3 crosses the baseline line (ema200 Daily) up, it means Buy, and if it breaks down, it means Sell.
There is also a 'take profit line' to determine and see the profit rate.
It can be changed from the settings.
Additionally, the blue line on the indicator (appears as full blue) is the closing price line of the bar where the buy signal is located. It can be turned off from the style settings.
You can also turn buy and sell signals on and off from the settings.
My advice to you is to use this indicator in small time periods. for example, in 1-minute, 3-minutes or 5-minutes time periods.
It can be used in all financial instruments.
Wishing you to always win.

Extreme Entry with Mean Reversion and Trend FilterThis non-repainting indicator is an improved version of my previous work, a more versatile tool designed to provide traders with dynamic and adaptive entry signals while incorporating a mean reversion and trend filtering mechanism. By combining RSI overbought/oversold, regular divergence and confirmatory momentum oscillator such as CCI or MOM, this indicator generates more precise and timely signals for entering trades.
The indicator offers a comprehensive set of entry conditions for both Buy and Sell entries:
• For Buy entries, it checks for oversold conditions based on RSI levels, and detects bullish divergence patterns while oversold and it identifies upward crossovers in the selected entry signal source (CCI or Momentum).
• Similarly, for Sell entries, it identifies downward crossovers of the CCI or Mom, after the recent overbought conditions, and bearish divergence patterns inside the overbought RSI.
To refine the entry signals even further, the indicator utilizes a mean reversion filter. Traders can choose to display signals that occur inside or outside the upper and lower mean reversion bands:
• Range Entries are indicating potential buying opportunities near the lower band and selling opportunities near the upper band. This is based on the concept of mean reversion, which suggests that prices tend to return to the average when they reach the upper or lower bands. By focusing on these signals, traders can take advantage of price movements that have a higher probability of reversing towards the mean.
• Extreme Entries, on the other hand, represent signals that occur outside of the bands, signaling potential pullbacks during strong trends. By entering positions only at extreme highs or lows, traders can avoid getting caught in the middle of the trend. This approach helps traders capitalize more favorable trading opportunities which have a high reward-risk ratio.
Trend Filter acts as a directional bias for the entry signals. When enabled, long and short entry conditions are filtered based on the relationship between the closing price and the EMA.
Traders have the flexibility to customize, tweak the indicator filter and values in the settings according to their preferences strategies and traded assets, tailoring the signals to their specific needs. The script sets alert conditions to trigger alerts for buy, sell, or both entry signals. This indicator can be used in conjunction with price action or other technical analysis tools for confirmation and better trading decisions.
I created this indicator for my own use, and I share this for informational purposes only. It does not constitute financial advice so use at your own risk and consider your financial situation before making any trading decisions. The indicator's accuracy is not guaranteed, and past performance is not indicative of future results.
I appreciate your feedback on this indicator. As I am new to script development, I am open to comments and suggestions to improve it. If you encounter any issues while using this indicator, please let me know in the comments section. If you find it helpful, I kindly ask for your support in boosting it. Thank you for your cooperation.

RSI Momentum Trend ScreenerIntroducing The RSI Momentum Trend Screener, to have the ability to scan 40 symbols at once
The screener is based on RSI Momentum Trend Indicator
It will show Positive Or Negative based on the symbol condition.
You can change the values on the screener, symbols, activate/disable symbols and change table position and color

Buy&Sell Bullish Engulfing - The Quant Science🇺🇸
GENERAL OVERVIEW
Buy&Sell Bullish Engulfing - The Quant Science It is a Buy&Sell strategy based on the 'Bullish Engulfing' candlestick pattern. The main goal of the strategy is to achieve a consistent and sustainable return over time, with a manageable level of risk.
Bullish Engulfing
The template was developed at the top of the Indicator provided by TradingView called 'Engulfing - Bullish'.
ENTRY AND EXIT CRITERIA
Entry: A single long order is opened when the candlestick pattern is formed, and the percentage size of the order (%) is fixed by the trader through the user interface.
Exit: The long trade is closed on a percentage equity take profit-stop loss.
----------------------------------------------------------------------------------------------------------------------------------------------------------------------------------------------
🇮🇹
PANORAMICA GENERALE
Buy&Sell Bullish Engulfing - The Quant Science è una strategia Buy&Sell basata sul candlestick pattern 'Bullish Engulfing'. L'obiettivo principale della strategia è ottenere un ritorno costante e sostenibile nel tempo, con un livello gestibile di rischio.
Bullish Engulfing
Il template è stato sviluppato al top dell' Indicatore fornito da Trading View chiamato 'Engulfing - Bullish'.
CRITERI DI ENTRATA E USCITA
Entrata: viene aperto un singolo ordine long quando si forma il candlestick pattern, la size percentuale dell'ordine (%) viene selezionato tramite l'interfaccia utente dal trader.
Uscita: la chiusura della posizione avviene unicamente tramite un take profit-stop loss percentuale calcolato sul capitale.

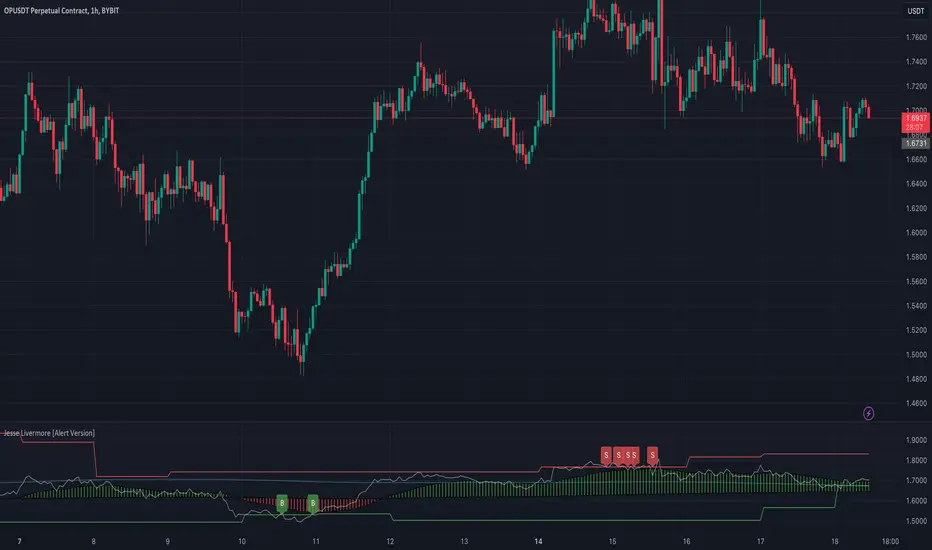
Jesse Livermore Strategy [Buy & Sell]Jesse Livermore was a famous trader who made a fortune in the early 20th century through his unique approach to trading.
While he did not leave behind a single, specific trading strategy that is attributed to him, I have tried to reproduce one.
His trading strategy was based on understanding market trends and sentiment, and he used several technical indicators to identify potential entry and exit points.
Some of the indicators he used include:
Price Action:
Jesse Livermore relied heavily on price action to make trading decisions.
He believed that the price itself was the best indicator of market sentiment, and that by analyzing the price movement, he could identify trends and market behavior.
Volume:
Livermore also used volume to confirm price movements.
He believed that a rise in volume along with a price increase indicated a strong bullish trend, while a decrease in volume with a price increase indicated a weak trend.
Pivot Points:
Another key component of Jesse Livermore's trading strategy was pivot points.
He used pivot points to identify potential support and resistance levels in the market, which he then used to identify potential entry and exit points.
Jesse Livermore outlined a simple trading system: wait for pivotal points before entering a trade.
When the points come into play, trade them using a buffer, trading in the direction of the overall market.
Let the price dictate your actions and stay with profitable trades until there is good reason to exit the trade.
The one I have tried to reproduce it's based on Pivot High and Low looking back 5 Days, and the average price oscillator.
When the price is bellow the support defined line it's time to Buy ( Long Position ), when the Price line is over the Resistance Line it's time to Sell ( Short Position )
This indicator has to be checked, and tried into a Real-Time context, so using the Replay functionality of TradingView is the best way to see and understand how Signals comes
(NB: look back into the chart without Replay should give you wrong Buy/Sell information)
The Indicator can be used on every TimeFrames, but the better ones are 5min - 15min.
I will add the possibility to choose the TimeFrames value for Pivot High and Low.
I will create a version with Alerts for Buy and Sell and the possibility to integrate it with "3commas Bot" where the best deal can be to set a TP to 1% for each Long or Short Entry.
Let's try it and comment for doubts or questions.
BUY/SELL + ADVANCE DECLINEThis script is a custom trading view indicator that helps to identify potential buy and sell signals based on the RSI (Relative Strength Index) and SMA (Simple Moving Average) indicators. The script also identifies potential reversals using a combination of RSI and price action. It plots buy, sell, and reversal signals on the chart along with an SMA line. Additionally, it provides alerts based on the buy, sell, and reversal conditions.
Changes made to the original script:
Fixed the undeclared identifier 'c' error by calculating the difference between the current closing price and the previous closing price: c = close - close .
Added an "ADD Value Floating Label" to the chart. The label shows the difference between the current and previous closing prices (ADD value) along with a "Bullish" or "Bearish" indicator based on the value of 'c'. The label is positioned at the top right of the visible chart area and remains static.
Here's a summary of the major components of the script:
Input settings: Define the input parameters for RSI and SMA.
Calculation of RSI and SMA: Compute the RSI and SMA values based on the input parameters.
Color definitions: Define colors for different conditions and levels.
Condition definitions: Define various conditions for buy, sell, reversal, and other criteria.
Buy and sell conditions: Determine buy and sell signals based on RSI, SMA, and price action.
Reversal conditions: Identify potential reversals using RSI and price action.
Plot signals: Display buy, sell, and reversal signals on the chart.
Bar colors: Color the bars based on the identified signals.
Plot SMA: Display the SMA line on the chart.
Alert conditions: Set up alerts for buy, sell, and reversal conditions.
ADD Value Floating Label: Add a label to the chart showing the ADD value and a "Bullish" or "Bearish" indicator.

ADX Trend FilterADX Trend Filter Indicator is a traditional ADX indicator with a different presentation. its consist of two indicators EMA TREND and ADX / DMI
About Indicator:
1. BAND / EMA band to represent EMA Trend of EMA-12 and EMA-50
(Band is plotted at level-20 which is the Threshold level of DMI / ADX indicator)
2. Histogram showing the direction of ADX / DMI trend
3. Area behind the histogram showing ADX/DMI strength
How to use?
1. Histogram represents current Trend Red for Bearish / Green for Bullish
2. Area behind the histogram represents Strength of ADX / DMI Threshold level is 0-20(represented as band). (Area below the Band is Sideways)
3. Band represents the current MA Trend.
4. Buy Sell signals are plotted as triangles in red/green obtained from ADX / DMI Crossovers
Buy Signal (Green Triangle on band- ADX Crossover)
1.Band below Histogram must be Green
2.Histogram must be green
3.Area behind histogram must be above the lower trend band (20level) and visible
Sell Signal (Red Triangle on band- ADX Crossover)
1.Band below Histogram must be Red
2.Histogram must be Red
3.Area behind histogram must be above the lower trend band (20level) and visible
Alerts provided for ADX crossovers.

TUE ADX/MACD Confluence Algorithm V1This algorithm is designed to look at the ADX/MACD confluence for opening conditions, apply various filters including volume and volatility, then determine stop outs, break evens, and take profits.
The ADX and MACD confluence can be a powerful predictor in stock movements. Both of these indicators find trend but do it in different ways. When they're combined they have a high success rate of finding openings. That's done by finding the bar in which both show the same direction - that bar is the beginning of the confluence. I have a free indicator called the TUE ADX/MACD Confluence that you can use to see this in action.
This script will help you find those confluences in an easy to understand manner. It will open a trade on a detected confluence, using the rest of the variables available in the algorithm as filters. You can filter based on cumulative volume delta, volatility, and trend. It includes settings for either trend following or contrarian trades, and the ability to go long, short, or both.
It includes Buy and Sell signals for detected confluences, and will show colored candles to help you determine when to exit a trade if you don't want to follow the included take profit areas. When the candles turn to white that means the detected confluence is no longer in play. The Buy and Sell signals will display on the first occurrence of each confluence.
The take profit areas are based on proprietary math that help find peaks and valleys. You can adjust the size of the take profits as a percentage of the position, change to static take profits (i.e. take profit in 16 ticks), or use both. You can also disable them and use the natural closing conditions (reversal of MACD/ADX confluence).
Our algo works in any market and will allow user to adjust input settings to be used on any ticker they'd like. It is built as a strategy so you can back test on any ticker to find the exact right settings to dial it in and then switch to live trading mode to see signals. Can be used for day trades or swing trades.
Automated Trading
This algo has been tested and certified to work for automated trading.
Works on Forex
It's confirmed to work on forex so you can trade that market.
Gets you into long successful trades, and gets out of poor ones quickly
It keeps you in the long trades taking small profits along the way, but cuts losers quickly in comparison. This style leads to a high profit factor, as you can see over 3.0 in the included ES 3 Min chart.
It looks at many variables so you don't have to
- Uses ADX/MACD confluence for opening/closing conditions.
- It uses volume, if the user wants, to help filter entries. The volume calculation is based off of my proprietary cumulative volume delta indicator and helps find if the volume is moving long or short.
- It uses proprietary take profit math to help find peaks and valleys to peel off profits. It is based on the changes in momentum of the underlying.
- It allows for stop outs and break evens based on volatility so they'll always adjust with the movement of the underlying ticker (see the blue lines above and below the opening in the chart).
- It allows for offset break evens to keep a portion of the profit.
Strategy for the Algo
Included so you can understand how to trade with it.
ONE: After loading this strategy onto a ticker turn off volume if it's a ticker with no volume , set the dates at the bottom to when the stock is active (you want to start backtesting when a stock started trading like it trades currently).
TWO: From there adjust the ADX/MACD to find the highest win rate and profit factor.
THREE: Then adjust the volume length to find the highest win rate and profit factor. It's important while doing these that you pay attention to a smooth upward equity curve.
FOUR: After this has been done now adjust the long and short risk multipliers. This determines your stop out.
FIVE: Then adjust breakeven multipliers - this is the level at which it changes to a breakeven stop out instead of the previous one. You can also set an offset to keep a small part of the profit.
SIX: Finally adjust the take profit sizes.
SEVEN: Once this is all done go back through the list and adjust up and down by one or two clicks and see if a better curve can be obtained. Very frequently long and short trades have different settings.
EIGHT: When you are finished save the settings in a custom indicator template and put it with it's own chart.
Additional
The settings shown on screen are not the default settings, but are settings chosen for this ticker and timeframe based on the process above. Nearly every ticker and timeframe will require adjustment from default, that's why the algorithm is built to be highly flexible. It can fit any ticker and timeframe, as well as market environment.
Also included in the chart above is a $1.25 commission per contract, and a tick of slippage (which on average is about right for automated trading on ES).

Buy Sell Signal ScannerThis is a higher timeframe scanner that detects whether the market is bullish or bearish according to our Buy Sell Indicator on up to 8 different timeframes. It can also be customized to scan different tickers so you can scan tickers that typically move with or against the ticker you are trading for extra confirmation. The scanner can be configured to use the exact same settings that you use with the Buy Sell Indicator so everything is using the same formula.
For price action identification, scalp mode looks at the candle body, candle wicks and size of the body and wicks and compares all of that to the previous candle to see if it is bullish or bearish. Swing mode will compare the current candle to the last 2 candles and long swing mode will compare the current candle to the last 10 candles. It’s looking for higher highs & lower lows, if the candle body is large or small and much more.
There are also filters that prevent signals from being given when the candle is small or has not made a higher high or lower low compared to the previous candle and multiple other filters to help hold positions longer. Once the price action direction has been confirmed, then the script looks at a massive amount of other calculations to determine if a signal should be given or not. These calculations are made up of all of my best indicators combined into a master signal generator as well as more new calculations from things I have learned over time and tested extensively that have not been made available to the public until now.
Price action as well as many other factors will all have to be confirming the direction before a signal can come in, but it reacts very quickly so it can give early signals at the first sign of reversal. Fine tune your settings to match your Buy Sell Indicator settings to get the same signals on the scanner.
HOW TO USE
The scanner will show the higher timeframe in a table on the side of the chart if no other ticker is selected to scan. The timeframe cell will show as green if that timeframe is currently in a bullish signal and red if that timeframe is currently in a bearish signal. If you set it to use a different ticker, the ticker name and timeframe will show up in the table.
The defaults are set up to scan the same ticker as your chart but on higher timeframes. It is set up for a 1 minute chart by default, but each timeframe can be adjusted to suit your preference all the way up to a 1 year timeframe.
You can set the scanner to look at different tickers as well which is very useful for getting confirmation by setting it to scan other tickers that usually move in the same direction or opposite of the ticker you are trading.
TRADE MODE
The signal settings allow you to match the scanner settings to your settings on the Buy Sell Indicator. There is scalp mode, swing mode and long swing mode. All 3 settings use the same calculations for signals, but they have different price action filters to help hold swings longer. Scalp mode will only be looking at the current bar compared to the previous bar, but swing mode will look at the current bar compared to the previous 2 candles. Long swing mode will compare the current candle to the last 10 candles to hold positions even longer.
There is also a candle trailing length that can be adjusted as well to suit your preference. This adds a filter that ensures the current candle is closing higher than the previous X number of candles you choose for a bull signal and is closing lower than X number of previous candles for a bear signal. Make sure to match these settings to how your Buy Sell Indicator is configured to get matching results.
You can also move the position of the scanner table to any part of the chart in the settings menu at the bottom.
ALERTS
There are alerts set up that will give you a signal when all timeframes are bullish on candle close and another signal that will alert when all timeframes are bearish on candle close. There is also an alert for when the first 4 timeframes & ticker are bullish and the last 4 timeframes & ticker are bearish or the opposite. This is useful for looking at forex markets and setting the first 4 to tickers that move together and the last 4 to tickers that move opposite.
MARKETS
This Buy Sell Signal Scanner can be used on any market with price data such as stocks, crypto, forex and futures.
TIMEFRAMES
This Buy Sell Signal Scanner can be used on any timeframe. And will scan any of our available timeframes between 1 minute and 1 year.
PAIRINGS
We recommend pairing this Buy Sell Signal Scanner with our Buy Sell Indicator so you can get signals and price action colored candles on the ticker you are trading and then use the scanner for confirmation of trend on higher timeframes and trade with the trend.

Buy Sell IndicatorThis Buy Sell Indicator uses price action calculations to determine the bullish or bearish nature of the current market and then calculates if the price action is strong enough to give a signal. The indicator is fully adjustable so you can fine tune it to fit your specific trading style with Scalp Mode, Swing Mode, Long Swing Mode and candle trailing length. It also has an automatic trailing stop loss and take profit features that can be customized.
For price action identification, scalp mode looks at the candle body, candle wicks and size of the body and wicks and compares all of that to the previous candle to see if it is bullish or bearish. Swing mode will compare the current candle to the last 2 candles and long swing mode will compare the current candle to the last 10 candles. It’s looking for higher highs & lower lows, if the candle body is large or small and much more.
There are also filters that prevent signals from being given when the candle is small or has not made a higher high or lower low compared to the previous candle and multiple other filters to help hold positions longer. Once the price action direction has been confirmed, then the script looks at a massive amount of other calculations to determine if a signal should be given or not. These calculations are made up of all of my best indicators combined into a master signal generator as well as more new calculations from things I have learned over time and tested extensively that have not been made available to the public until now.
Price action as well as many other factors will all have to be confirming the direction before a signal can come in, but it reacts very quickly so it can give early signals at the first sign of reversal. Fine tune your settings to match your trading style from within the input settings and then look for potential reversal areas and take signals that appear in that reversal area for the highest probability of winning trades. I decided not to include any support or resistance or similar tools in order to keep the indicator lightweight and respond as fast as possible as well as update the candles as quickly as possible. This also lets you keep your charts clean and only use the support & resistance tools that you prefer since everyone has a different trading style.
HIGHER TIMEFRAME AND/OR MARKET SCANNER
There is also a higher timeframe scanner available as a separate indicator titled Buy Sell Signal Scanner that you can find on my profile. It can be customized to show you up to 8 higher timeframes of your current ticker or any other ticker you like. This is useful for trading with the trend of the higher timeframes or you can set it to the same timeframe as your chart and scan other tickers that usually move together or opposite for extra confirmation. Each ticker/timeframe will be displayed in a table on the chart and colored green or red depending if it is currently bullish or bearish. If you are using a different timeframe than the current chart, then it will display the timeframe next to the ticker name.
HOW TO USE
CANDLES
The candles will paint blue or orange according to the price action detected. This can be customized or turned on/off and will follow the price action according to the trade mode settings. Using these candle colors helps to get rid of anxiety when watching candles come in that are in the opposite direction of your trade. I highly recommend using this feature as it helps you control your emotions much better during trading.
TRADE MODE
The trade mode settings let you choose between Scalp Mode, Swing Mode and Long Swing mode. They all use the same price calculations, but each mode has its own filters to hold through ranging price action in a slightly different way. You can also adjust the candle trailing length to make it hold positions even longer. The candle trailing length will not let a signal come in until there is a higher high or lower low than the previous X number of candles from this setting.
Scalp mode will get you in and out of positions the earliest. Swing mode will hold signals longer by filtering out ranging price action. Long swing mode uses even more filtering to hold positions even longer than swing mode and let price range more without calling out every move. Each one of these modes will also be affected by the candle trailing length.
It should be noted that using swing mode and long swing mode or increasing the candle trailing length will make the signals not perform as well when price action is whipsawing up and down and also will not have as early of entries and exits as scalp mode due to the range breaks that are needed for a signal to be given. That being said, it will hold positions much longer when markets are trending and still have great entries and exits, so use the longer settings when markets are trending and then switch to scalp mode when the market is chopping around and moving sideways for best results.
Scalp Mode
Swing Mode
Long Swing Mode
STOPLOSS
There is an automatic stoploss feature as well. It calculates the average candle height and adds/subtracts that from the highest high or lowest low of the past X number of candles according to your Stoploss Candle Trail Length. Use a lower number for a tight trailing stoploss and increase the number for a more loose stoploss. You can also customize the color of the stoploss line and label or turn it off if you prefer. The stoploss will update on every candle for proper trailing but it will not switch to an opposing signal until the candle closes with a new signal.
TAKE PROFIT
There is an automatic take profit level generator as well that also uses the average candle height for its calculations. There are 3 settings that let you set the average candle size multiplier for each take profit level. The default settings are evenly spaced at 3, 6 and 9 times the average candle height from where the most recent signal locked in at candle close. Adjust these numbers to suit your preference. You can also customize the color of the take profit lines and label or turn it off if you prefer. The take profit levels will not change to an opposing signal until the opposing signal is confirmed on the candle close.
Auto Stoploss & Take Profit
SIGNALS
The default signals are green and red arrows. The color can be adjusted in the settings or you can turn the bull or bear signals on or off if you only want entry signals for the direction of the trend.
VOLUME SPIKE SUPPORT & RESISTANCE
There are volume based auto support & resistance levels that are off by default, but can be turned on in the settings. It calculates the average volume over multiple periods and gets the average of that and then looks for volume spikes that were greater than the average, multiplied by the volume spike multiplier in the settings. If set to 3, then the volume spike will need to be 3 times or higher than the average volume bar for a level to show up. Increase or decrease this number to get more or less levels.
VOLUME WARNING
If volume is very low compared to normal, then a volume warning label will appear at the top of the chart letting you know that volume is very low and to trade with caution. I recommend not trading during those times though as price can whipsaw very easily.
ALERTS
There are also alerts that can be triggered for buy signals as well as sell signals. They are set to only send signals when the bar is confirmed so you won’t get alerts for signals that repaint while the candle is still open. You can use these alerts to send signals to your own trading bot if you choose to.
MARKETS
This buy sell indicator can be used on any market with price data such as stocks, crypto, forex and futures.
TIMEFRAMES
This buy sell indicator can be used on any timeframe.
PAIRINGS
We recommend pairing this Buy Sell Indicator with our Buy Sell Signal Scanner so you can check other timeframes and trade with the trend or use the scanner to look at other markets that move together or opposite of the ticker you are trading for extra confirmation of direction.

Buy Sell Calendar [LuxAlgo]The Buy Sell Calendar indicator displays a calendar showing the sentiment for the current day/month. Three different methods can be used to determine this sentiment.
The calendar can also highlight the percentage of bullish days/months for a month/year.
🔶 SETTINGS
Frequency: Calendar frequency, options include "Daily" and "Monthly"
Sentiment Method: Method used to determine the sentiment for the day/month, options include: "Linreg", "Accumulated Deltas", and "Max/Min"
Timezone Offset: UTC time zone offset.
Limit Date: Limit date used by the calendar, the sentiment of days/months outside this limit will not be returned.
🔹 Calendar
Show Calendar: Determines whether to display or hide the calendar.
Location: Location of the calendar on the chart.
Size: Calendar size.
🔶 USAGE
The proposed script can allow users to quickly determine if a specific day/month is considered bullish or bearish. A green cell is used for bullish days/months, while a red one is used for bearish days/months.
Additionally vertical lines are displayed on new days/months with a color highlighting the current sentiment for this specific day/month. Note that this is done retrospectively, the color of a line set at time t might differ at time t+n .
🔶 SENTIMENT METHODS
Determining whether a day/month is bullish or bearish can be done using three different methods. Note that each method makes use of the closing price as the input, and as such can eventually return different results depending on the selected timeframe. Each method is described below:
🔹 Linreg
The Linreg method fit lines between each day/month using the method of least squares and determines if that particular day is bullish or bearish based on the line slope sign. For example, a rising line would indicate a bullish day/month.
🔹 Accumulated Deltas
The method of accumulated deltas simply accumulates bullish and bearish price changes for the current day/month, the result with the highest magnitude determines the sentiment for that day/month.
🔹 Max/Min
The max/min method computes a trailing maximum and a trailing minimum for the current day/month. The sentiment is determined by the price position relative to the average between the obtained maximum/minimum, with a bullish sentiment being determined if price is above the average.

Orb breakout Buy condition =>ORB range 9:20-9:25. On 5 min TF if candle breaks high and next candle break high of that candle. buy signal when third candle breaks high of 2nd candle
Sell condition=>ORB range 9:20-9:25. On 5 min TF if candle breaks low and next candle break low of that candle. sell signal when third candle breaks low of 2nd candle
this indicator is extended version of my previous indicator i got a comment request from @RISHISAKHARE to devlope indicator based on above mention rule ....

MAGIC MACDMAGIC MACD ( MACD Indicator with Trend Filter and EMA Crossover confirmation and Momentum). This MACD uses Default Trading view MACD
from Technical indicators library and adding a second MACD along with 3 EMA's to detect Trend and confirm MACD Signal.
Eliminates usage of 3different indicators (Default MACD , MACD-2,EMA5, EMA20, EMA50)
Basic IDEA.
Idea is to filter Histogram when price is above or below 50EMA. Similar to QQE -mod oscillator but Has a EMA Filter
1.Take DEFAULT MACD crossover signals with lower period
2.check with a Higher MACD Histogram.
3.Enter upon EMA crossover signal and Histogram confirmation.
Histogram changes to GRAY when price is below EMA 50 or above EMA 50 (Follows Trend)
4.Exit on next Default MACD crossover signal.
Overview :
Moving Average Convergence Divergence Indicator Popularly Known as MACD is widely used. MACD Usually generates a lots of False signals
and noise in Lower Time Frames, making it difficult to enter a trade in sideways market. Divergence is a major issue along with sideways
movement and tangling of MACD and Signal Lines. There is no way to confirm a Default MACD signal, except to switch time frames and
verify.
Magic MACD Can be used to in combination with other signals.
This MACD uses two MACD Signals to verify the signal given by Default MACD . The Histogram Plot shown is of a higher period
MACD (close,5,50,30) values. When a signal is generated on a lower MACD it is verified by the histogram with higher time period.
Technicals Used:
1. Lower MACD-1 values 12,26 and signal-9 (crossover Signals)
2. Higher MACD-2 values 5,50 and signal-30 (Histogram)
3. EMA 50 (Histogram Filter to allow only if price above or below Ema 50)
4. EMA 5 and EMA 20 for crossover confirmation of trend
What's is in this Indicator?
1.Histogram-(higher period 5,50 and 30signal)
2. MACD crossover Signals-(lower period Default MACD setting)
3.Signal Lines-( EMA 5 & 20)
Implemented & Removed in this Indicator
1. Default MACD and Signal Lines are removed completely
2. MACD crossover are taken on lower periods and plotted as signals(Blue Triangle or Red Triangle)
3. Histogram is plotted from a higher Period providing a clear picture with Higher Time period
4. EMA 5 and EMA 20 are used for MACD signal confirmation
How to use?
Up Signal
1. MACD Default (12,26,30) up signals are shown in Blue
2. Wait till the Histogram changes Blue
3. Look for EMA signals crossover near by
Down Signal
1. MACD Default (12,26,30) up signals are shown in Red
2. Wait till the Histogram changes Red
3. Look for EMA signals crossover near by
Do's
Consider only opposite color as signals
1. Red Triangle on Blue Histogram(likely to move down direction)
2. Blue Triangle on Red Histogram (Likely to move up direction)
Don'ts
1.Ignore Blue Signal on Blue Histogram (pull back signals can be used to enter trade if you miss first crossover)
2.Ignore Red Signal on Red Histogram(pull back signals can be used to enter trade if you miss first crossover)
3.Ignore Up and Down signals till Gray or Blacked out area is finished in Histogram
Tips:
1. EMA plot also shows pull back areas along with signals
2.side by side opposite signals shows sides ways movement
3. EMA 5,20 is plotted on MACD Histogram for Additional Benefit
Thanks & Credits
To Tradingview Team for allowing me to use their default MACD version and coding it in to a MAGIC MACD by adding a few lines of code that
makes it more enhanced.
Warning...!
This is purely for Educational purpose only. Not to be used as a stand alone indicator. Usage is at your own Risk. Please get familiar with its working before implementing. Its not a Financial Advice or Suggestion . Any losses or gains is at your own risk.

[-_-] Volatility Calibrated ATRDescription:
An indicator based on ATR adjusted for volatility of the market. It uses Heikin Ashi data to find short and long opportunities and displays a dynamic stop loss level. Additionally, it has alerts for when the trend changes (which is an entry signal).
How it works:
It works by dynamically calculating the Period for ATR which depends on current volatility level that is calculated by a function that uses Standard Deviation of price. ATR is then smoothed by Weighted Moving Average and multiplied by ATR Factor, resulting in a plot that changes its colour to red when we're in a downtrend and green when in an uptrend. This plot should be used as a dynamic Stop Loss level. Trend change is determined by price crossing the dynamic Stop Loss level. The squared red and green labels appear when the trend changes, and should be used as Entry signals.
Parameters:
- Source -> data used for calculations
- ATR Factor -> higher values produce less noise and longer trends, lower values give more signals

Pair Prowler [CR]█ OVERVIEW
Pair Prowler v6 Enhanced is a sophisticated oscillator-based trading system designed for traders seeking high-probability setups with multiple confirmation layers. The indicator combines proprietary signal generation with institutional-grade filters to identify optimal entry and exit points while minimizing false signals.
The system features adaptive zones that dynamically adjust to market conditions, multi-timeframe support/resistance analysis, volume-weighted mean reversion filters, and real-time performance tracking. A comprehensive confluence scoring system evaluates each potential trade across eight technical dimensions, allowing traders to filter for only the highest-quality opportunities.
█ KEY FEATURES
Adaptive Dynamic Zones
Rather than using fixed overbought/oversold levels, the indicator employs statistical methods to calculate adaptive zones that adjust to recent price behavior. These zones automatically widen during high volatility and tighten during consolidation, ensuring signals remain relevant across all market conditions.
VWAP Mean Reversion Filter
This filter uses volume-weighted price analysis to identify when price has moved significantly away from fair value. The system calculates statistical deviation from VWAP and only permits:
- Long entries when price is substantially below VWAP (oversold relative)
- Short entries when price is substantially above VWAP (overbought relative)
Higher Timeframe Support/Resistance Filter
To avoid entries near major reversal zones, the indicator analyzes pivot highs and lows from a user-selected higher timeframe. The system maintains a database of recent support and resistance levels and blocks trades that would occur too close to these critical price levels. This prevents getting stopped out by predictable institutional activity at key levels.
Divergence Detection
The indicator automatically identifies four types of divergences between price and the oscillator.
Risk Entry Signals
For aggressive traders, the indicator provides early warning signals that fire before the main entry triggers. These risk entries offer better entry prices but come with lower probability. They are visually distinct from standard entries and can be toggled on or off.
Safe Exit Zones
In addition to standard exit signals, the system identifies optimal profit-taking zones using statistical analysis and adaptive thresholds. These safe exit zones are highlighted with background coloring to alert traders when positions have reached favorable risk-reward levels.
Performance Statistics Panel
A comprehensive real-time statistics dashboard tracks:
- Total trades executed (long and short separately)
- Win rate percentages (overall, long-only, short-only)
- Profit factor calculation
- Total and average profit/loss per trade
- Largest winning and losing trades
- Maximum consecutive wins and losses
The panel can be positioned in any corner of the chart and updates automatically as trades close. Note that statistics represent theoretical performance based on signal timing and do not account for slippage, commissions, or execution delays.
Comprehensive Alert System
The indicator includes over 20 pre-configured alert types
█ HOW TO USE
Initial Setup
1 — Select your preferred base strategy from the Signal Settings group. Strategy 1 is recommended for most traders as it provides a balanced approach suitable for various market conditions.
2 — Configure the VWAP filter threshold based on your trading style:
Lower thresholds (1.0–1.5) for more frequent entries
Higher thresholds (2.0+) for fewer but more extreme reversals
3 — Set the HTF S/R filter timeframe to approximately 4–6 times your chart timeframe. For example, use 4H pivots when trading on 1H charts.
Reading Signals
Entry signals appear as triangles at the oscillator level:
- Green upward triangles indicate long entries
- Red downward triangles indicate short entries
- Small circles mark early risk entries
Exit signals appear as opposite-colored triangles. Background shading indicates special conditions like safe exit zones or averaging opportunities.
Interpreting Statistics
Use the performance panel to gauge strategy effectiveness:
- Win rates above 50% indicate positive edge
- Profit factor above 1.5 suggests robust performance
- Review max consecutive losses for position sizing guidance
Remember that past theoretical performance does not guarantee future results.
█ NOTES
Timeframe Considerations
This indicator works on all timeframes but performs optimally on 15-minute to 4-hour charts. Very low timeframes (1m–5m) may produce excessive signals, while daily and weekly charts may produce insufficient signals for active trading.
Market Conditions
The adaptive nature of the indicator allows it to function in both trending and ranging markets. However, extremely choppy or low-liquidity conditions may reduce signal quality. The confluence scoring system helps filter these periods automatically.
VWAP Behavior
VWAP resets at session boundaries for traditional markets (stocks) but runs continuously for 24-hour markets (crypto, forex). The z-score filter accounts for this difference automatically.
HTF Pivot Lag
Higher timeframe pivots require confirmation bars before being identified, introducing slight lag. Pivots are detected retrospectively once the full pattern completes on the selected timeframe.
Performance Tracking Limitations
The statistics panel tracks theoretical entry at close of signal bar and exit at close of exit bar. Actual trading results will differ due to:
- Slippage and spread costs
- Commission and fees
- Execution timing and delays
- Partial fills or rejections
- Overnight holding costs
Use the statistics as a comparative tool for optimization rather than a profit predictor.
Filter Interactions
All filters work sequentially. A signal must pass the VWAP filter, then the S/R filter. If any filter rejects the signal, it will not appear on the chart. This hierarchical approach ensures only fully validated setups generate alerts.
Optimization Guidelines
If receiving too many signals, tighten filter thresholds. If receiving too few signals, relax filters. Monitor the statistics panel over at least 50 trades before making significant parameter adjustments.

Chandelier Exit ZLSMA StrategyIntroduction
Heyo guys, I recently checked out some eye-catching trading strategy videos on YT and found one to test.
This indicator is based on the video.
Usage
The recommended timeframe is 5 min.
Signals
Long Entry => L Label
Price crosses above ZLSMA and Chandelier Exit shows Buy
Long Exit => green circle
Price crosses below ZLSMA
Short Entry => S Label
Price crosses below ZLSMA and Chandelier Exit shows Sell
Short Exit => orange circle
Prices crosses above ZLSMA
Ty for checking this out. Enjoy!
--
Credits to
@netweaver2011 - ZLSMA
@everget – Chandelier Exit

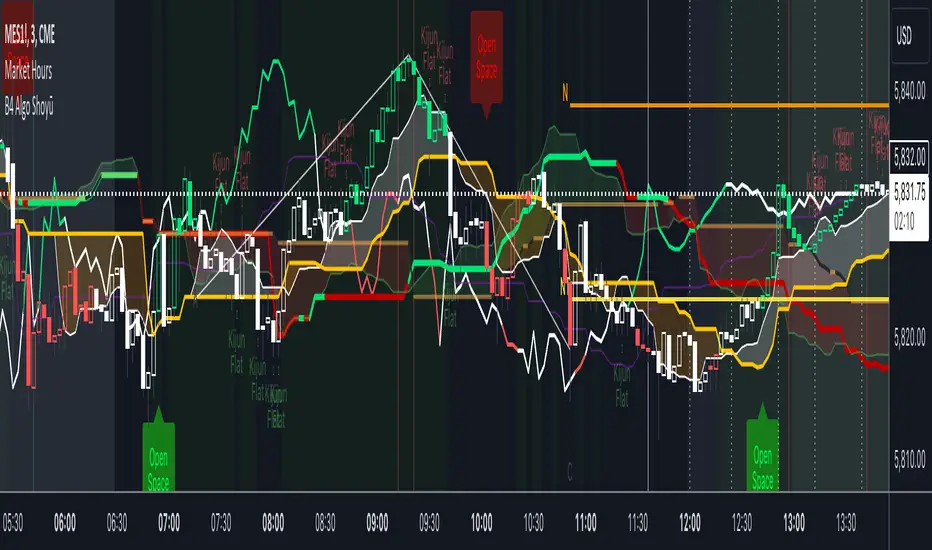
B4Signals Ichimoku Premium Addon ShoyūThis indicator is based on "Ichimoku" with additional and useful features. It is designed to complement B4Signals Ichimoku as an add-on.
FEATURES
The indicator is mainly divided into 5 parts:
* Future Tenkan-sen, Kijun-sen & Kumo Lines: Tenkan-sen next 5 days projection, Kijun-sen next 10 days, Senko Span A next 5 days and Senko Span B next 14 days will be displayed to increase depth of your analysis and help forecast price movements.
* QualityLine + DirectionLine for determining beginning and end of trend as well as a visual to spot Kijun bounces and crosses.
* 9 /26 Tenke-sen/Kijun-sen pullback detection lines, “KISS Lines”, for better entries on pullbacks.
* Flat Kijun-sen signal to determine trend exhaustion and possible reversals.
* Open Space Chikou coloring and confirmation signal for Identifying momentum breakouts and spotting areas of projected consolidation.
* Ichimoku Hosoda Target Price Targets. Simply choose point A,B and C and have 4 Hosoda price targets appear on your chart.
The addition of these features provides traders with a collection of technical metrics capable of outlining directional trend momentum, proposed pullbacks and possible continuations in any financial market. Using multiple plots, this indicator plots a forecast where the Han-ne lines might travel in the future. The Direction line gives you a clear perspective of price in relation to the Kijun. While the Quality Line gauges the health or quality of the Kumo, helping determine entries and exits, while confirming pullbacks and areas of consolidation. The “KISS Lines” help identify Tenken-sen / Kijun-sen 9/26 pullbacks and the Kijun Flat alert signals you when trend exhaustion is identified by a flat Kijun-sen.
Another significant aspect of this indicator is that it identifies the Chikou Span reaching ‘Open Space' by coloring the Chikou Span's line giving you a signal as well. This can help traders identify the market’s dominant trend (bullish or bearish) and determine an appropriate time to enter/exit active positions.
Disclaimer
Copyright by B4Signals.
The information contained in our scripts/indicators/ideas does not constitute financial advice or a solicitation to buy or sell any securities of any type. We will not accept liability for any loss or damage, including without limitation any loss of profit, which may arise directly or indirectly from the use of or reliance on such information.
All investments involve risk, and the past performance of a security, industry, sector, market, financial product, trading strategy, or individual’s trading does not guarantee future results or returns. Investors are fully responsible for any investment decisions they make. Such decisions should be based solely on an evaluation of their financial circumstances, investment objectives, risk tolerance, and liquidity needs.
Unicorn X-AlgoUnicorn X-Algo is a multifunctional trading indicator. It is designed to help traders make real-time decisions using quantitative models.
Its core is a trend trading strategy based on our enhanced Trailing Stop-Loss algorithm. This strategy provides the user with position entry and exit signals. It is customizable and has a built-in instant backtesting feature.
For those who have difficulty with finding the good settings the indicator has the Automatic Mode. In this mode, there is no need for the user to adjust any settings. The indicator calculates optimized trading signals automatically.
In addition, the indicator provides a number of useful tools that aim to provide additional confirmation to the trading signals. They include: support and resistance levels forecast, price range prediction and institutional activity detection.
The script can send real-time alerts to the user’s Email and to the cell phone via notifications in the TradingView app.
The indicator can be used for various types of trend and swing trading, including positional trading, day trading and scalping.
Unicorn X-Algo allows users to:
forecast direction of trends with BUY and SELL signals;
determine the right time to close a position;
detect institutional activity in the market;
forecast key support and resistance levels;
predict the future price range for any market;
customize any settings and do a backtest with one click;
see historical trades on the chart;
use the fully Automatic Mode where the algorithm optimizes all its settings itself.
When using this script, keep in mind that past results do not necessarily reflect future results and that many factors influence trading results.
FEATURES
Trading signals
The feature calculates trend or swing entry and exit signals. The underlying strategy does not use fixed Take-Profit levels. It trails the price with a Trailing Stop-Loss to get as many pips as possible from price movements.
The feature is based on our custom Volatility Stop algorithm. It uses linear regressions instead of averaging. As our practice shows, this helps to reduce signal lag while keeping the number of false signals low.
Trading signals are customizable with Sensitivity and Trade Length parameters which determine the trading signals frequency and width of the Trailing-Stop levels, respectively.
Automatic Mode
The Trading Signals function has an automatic mode. When it is turned on, you do not need to adjust the trading signals settings. The algorithm tries to calculate the best settings automatically using an optimization algorithm.
In this mode, Buy and Sell signals are displayed as green and red triangles respectively. There are two types of exit signals displayed as circles and crosses. A circle signal means that a price reversal is expected and you can partially close the position. A cross signal means that a trading signal in the opposite direction is expected soon and you can partially or completely close your position.
Support and Resistance Levels
Support/Resistance levels forecasting model. The forecasted levels are non-repainting. Once calculated for a specified period in the future (day, week, month, etc.), they don't change during this period.
The feature allows the trader to plan trades and use the forecasted levels as entry levels and targets for opening and closing positions. Both intraday and higher timeframes are supported.
The forecasting model analyses the distribution of the price time series to find clusters in the data. These clusters are then used to make the key price levels forecast.
Big Money Activity detection
The Big Money Activity tool identifies areas on the price chart associated with instructional traders' activity in the market.
Institutional activity in a trending market can be a leading signal for upcoming reversal. Institutions could be fixing their profit, causing the price to move against the current trend.
Institutional activity in a sideways market can be due to positions accumulation and signal a new trend formation.
The algorithm uses tick volume, volume, and volatility data to forecast activity of institutional investors. The method develops the idea described in the Daigler & Wiley (2015) and Shalen (1993) works. It says that when institutional traders actively open or close their positions in the market, a divergence between volume and volatility time-series arises. It can be due to their use of position-splitting algorithms that reduce the impact of their positions on the market.
Trading Range Forecast
Trading Range Forecast feature predicts the price range of an asset for a selected period of time in the future, called Forecast Horizon. It can be the next day or 12-hour trading session. This function works if your chart timeframe is intraday (i.e. the timeframe below "D"). It shows the upper and lower bounds between which the price is going to stay in the upcoming Forecast Horizon period.
Instant Backtesting
After changing any settings, you can immediately see the performance of the strategy on the Instant Backtesting panel. Two metrics are displayed there - the percentage of profitable trades and the total return. This information, as well as the historical trades shown on the chart, will help you quickly and easily evaluate any settings you make.
SETTINGS
TRADING SIGNALS
Trade Length - defines the length of the trades the algorithm tries to make. Recommended values are from 1.0 to 6.0.
Sensitivity - controls the sensitivity of the trading signals algorithm. The sensitivity determines the density of trading signals and how close the trailing-stop levels follow the price. The higher the value of this parameter is, the less sensitive the algorithm is. High values of the Sensitivity parameters (100-500) can help to withstand large price swings to stay in longer price moves. Lower values (10-100) work well for short- and medium-term trades.
TRADING TOOLS
Big Money Activity - turns on and off the identification of the areas associated with institutional traders activity.
SUPPORТ AND RESISTANCЕ LEVELS
Show Support And Resistance Levels - turns on and off support and resistance levels calculation.
TRADING RANGE FORECAST
Show Trading Range Forecast - turns on/off trading range forecasting
Forecast Horizon - sets the period for which the trading range forecast is made
Forecasting Method - allows to choose a forecasting algorithm for the trading range forecast.
BACKTESTING
Use Starting Date - turns on/off the starting date for the strategy and backtests. When off, all available historical data is used.
Starting Date - sets the starting date for the strategy and backtests.
Show Instant Backtesting Dashboard - turns on/off a dashboard that shows the current strategy performance: the percentage of profitable trades and total return.
Leverage - sets the leverage that the strategy uses.

Unicorn QuantDeeply customizable trading algorithm with instant backtesting. It emulates real trading and displays all the actions it takes on the chart. For example, it shows when to enter or partially close a position, move Stop-Loss to breakeven, etc. The user can replicate these actions in their trading terminal in real time. The algorithm uses up to three Take-Profit levels, and a Stop-Loss level that can move in a trade to protect the floating profit.
The script can send real-time alerts to the user’s Email and to the cell phone via notifications in the TradingView app.
The indicator is designed to be used on all timeframes, including lower ones for intraday trading and scalping.
HOW TO USE
Set the Stop-Loss and up to three Take-Profit levels. Choose the rules for moving the Stop-Loss level in a trade. Adjust the sensitivity of the trading signals. And check the backtest result in the Instant Backtesting dashboard. If the performance of the strategy satisfies you, proceed with the forward testing or live trading.
When using this script, please, keep in mind that past results do not necessarily reflect future results and there are many factors that influence trading results.
FEATURES
Trading Signals
The feature calculates Buy and Sell signals for trend or swing trading. The user can change the Sensitivity parameter to control the frequency of the signals. This allows them to be adjusted for different markets and timeframes.
Position Manager
To make the Position Manager setup as easy as possible, the algorithm calculates Stop-Loss and Take-Profit levels in Average True Range (ATR) units. They are self-adjusting for any market and timeframe, since they account for its average volatility .
You don't have to worry about what market you are trading - Forex, Stocks, Crypto, etc. With the self-adjusting Stop-Loss and Take-Profit, you can find settings that work for one market and use the same numerical values as a starting point for a completely different market.
Instant Backtesting
After changing any settings, you can immediately see the performance of the strategy on the Instant Backtesting panel. Two metrics are displayed there - the percentage of profitable trades and the total return. This information, as well as the historical trades shown on the chart, will help you quickly and easily evaluate the settings.
SETTINGS
TRADING SIGNALS
Sensitivity - controls the sensitivity of the trading signals algorithm. It determines the frequency of the trading signals. The higher the value of this parameter, the less trading signals you get and the longer trends the algorithm tries to catch. The lower the sensitivity value, the more signals you receive. This can be useful if you want to profit from small price movements.
POSITION MANAGER
SL - sets the Stop-Loss level measured in ATR units.
TP1, TP2, TP3 - set the Take-Profit levels measured in the ATR units.
Close % at TP1, Close % at TP2, Close % at TP3 - set portions of the open position (as a percentage of the initial order size) to close at each of the TP levels.
At TP1 move SL to, At TP2 move SL to - set the rules for moving the Stop-Loss level in an open trade to protect the floating profit.
Show Open Position Dashboard - turns on/off a dashboard that shows the current Stop-Loss and Take-Profit levels for the open position.
BACKTESTING
Use Starting Date - turns on/off the starting date for the strategy and backtests. When off, all available historical data is used.
Starting Date - sets the starting date for the strategy and backtests.
Show Instant Backtesting Dashboard - turns on/off a dashboard that shows the current strategy performance: the percentage of profitable trades and total return.
Leverage - sets the leverage that the strategy uses.
