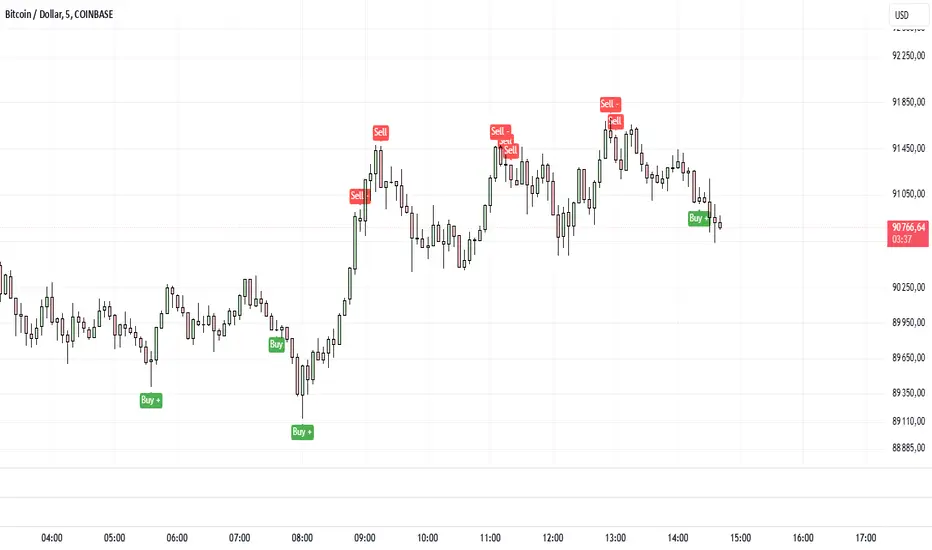
Intraday BUY/SELL & AUTO SL (5-min timeframe only) by chaitu50c)Intraday BUY/SELL & AUTO SL (5-min timeframe only) by chaitu50c
This indicator provides intraday traders with BUY/SELL reversal signals and automated SL (Stoploss) tracking, based on a 3-candle reversal block logic — designed to work exclusively on the 5-min timeframe.
Key Features:
• 3-Candle Reversal Logic — Signals are generated when a defined 3-candle reversal pattern is detected (body-close breakout).
• Current Session Only — All signals and SL lines are valid only for the current session and automatically reset at session start.
• BUY/SELL Signal Labels — Visual ▲ and ▼ labels mark valid reversal signals on the chart.
• Dynamic Auto SL Lines — Plots dashed SL lines based on the reversal block's low/high.
• SL HIT Tracking — If SL is broken, the line stops extending and a ‘SL HIT’ label is displayed at the midpoint of the SL line.
• Adjustable Visual Settings — Customize signal label size, SL line width, colors, and more.
• Clean & Lightweight — Optimized for intraday use without cluttering the chart.
How to Use:
You can trade this indicator in two ways:
1. Direct Signal Entry — Take a BUY or SELL trade when a valid ▲/▼ reversal signal forms.
2. SL HIT Re-entry — If an existing SL line is broken and ‘SL HIT’ appears, you can optionally take an opposite side trade in the direction of the SL HIT.
Example:
A BUY signal is generated and an SL line is plotted below.
If price breaks the SL (SL HIT appears), you may consider entering a SELL trade at that point — as it indicates weakness.
Important Notes:
• Works only on 5-min timeframe — Set your chart to 5-min for correct behavior.
• Designed for intraday trading — all signals and SL levels reset at session start.
• Does not carry signals between sessions.
• SL lines and HIT labels provide a clear and simple visual aid for trade management.
---
Buysell

RSI Buy Sell Signals+ with MFI Cloud [RanaAlgo]Indicator Overview
This indicator combines RSI (Relative Strength Index) with MFI (Money Flow Index) to generate trading signals with additional confirmation filters. The key features include:
RSI Analysis (14-period) with overbought/oversold levels
MFI Cloud (20-period default) showing trend direction via EMAs
Enhanced Signal Generation with volume and trend confirmation options
Visual Elements including colored zones, signal labels, and an information panel
How to Use This Indicator
Basic Interpretation:
Buy Signals (green labels) appear when:
RSI crosses above oversold level (30) OR
RSI shows a rising pattern from oversold zone with volume/trend confirmation (if enabled)
Sell Signals (red labels) appear when:
RSI crosses below overbought level (70) OR
RSI shows a falling pattern from overbought zone with volume/trend confirmation (if enabled)
MFI Cloud provides trend confirmation:
Green cloud = bullish trend (fast EMA > slow EMA)
Red cloud = bearish trend (fast EMA < slow EMA)
Recommended Usage:
For Conservative Trading:
Enable both volume and trend confirmation
Require MFI cloud to align with signal direction
Wait for RSI to clearly exit overbought/oversold zones
For Active Trading:
Combine with price action at key support/resistance levels
Watch for divergence between price and RSI
The Information Panel (top-right) shows:
Current RSI value and status
MFI trend direction
Last generated signal
Current momentum
Customization Options:
Adjust RSI/MFI lengths for sensitivity
Modify overbought/oversold levels
Toggle volume/trend confirmation requirements
Adjust visual elements like cloud opacity and zone visibility

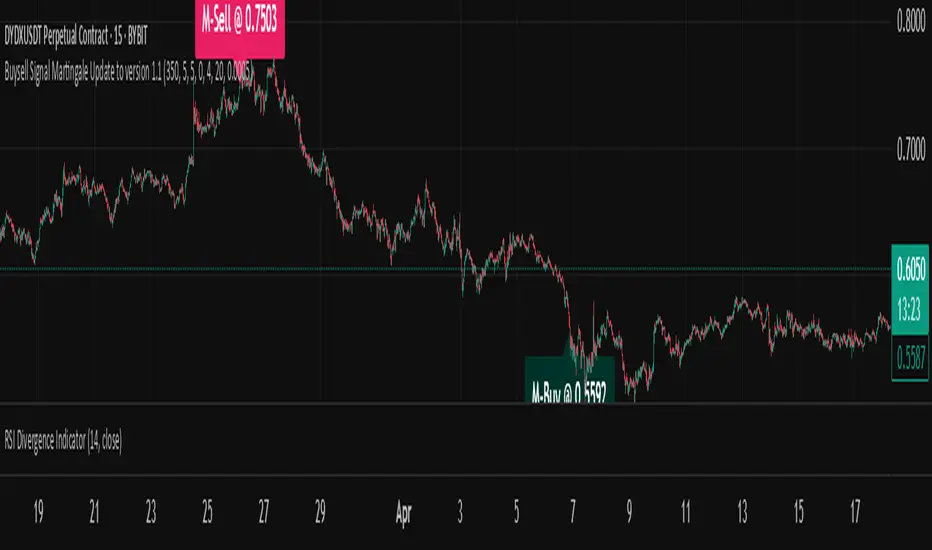
Buysell Martingale Signal - CustomBuysell Martingale Signal - Custom Indicator
Introduction:
This indicator provides a dynamic buy and sell signal system incorporating an adaptive Martingale logic. Built upon the signalLib_yashgode9/2 library, it is designed for use across various markets and timeframes.
Key Features:
Primary Buy & Sell Signals: Identifies initial buy and sell opportunities based on directional changes derived from the signalLib.
Martingale Signals:
For Short (Sell) Positions: A Martingale Sell signal is triggered when the price moves against the existing short position by a specified stepPercent from the last entry price, indicating a potential opportunity to average down or increase position size.
For Long (Buy) Positions: Similarly, a Martingale Buy signal is triggered when the price moves against the existing long position by a stepPercent from the last entry price.
On-Chart Labels: Displays clear, customizable labels on the chart for primary Buy, Sell, Martingale Buy, and Martingale Sell signals.
Customizable Colors: Allows users to set distinct colors for primary signals and Martingale signals for better visual distinction.
Adjustable Sensitivity: Features configurable parameters (DEPTH_ENGINE, DEVIATION_ENGINE, BACKSTEP_ENGINE) to fine-tune the sensitivity of the underlying signal generation.
Webhook Support (Static Message Alerts): This indicator provides alerts with static messages for both primary and Martingale buy/sell signals. These alerts can be leveraged for automation by external systems (such as trading bots or exchange-provided Webhook Signal Trading services).
Important Note: When using these alerts for automation, an external system is required to handle the complex Martingale logic and position management (e.g., tracking steps, PnL calculation, hedging, dynamic quantity sizing), as this indicator solely focuses on signal generation and sending predefined messages.
How to Use:
Add the indicator to your desired chart.
Adjust the input parameters in the indicator's settings to match your specific trading symbol and timeframe.
For automation, you can set up TradingView alerts for the Buy Signal (Main/Martingale) and Sell Signal (Main/Martingale) conditions, pointing them to your preferred Webhook URL.
Configurable Parameters:
DEPTH_ENGINE: (e.g., 30) Controls the depth of analysis for the signal algorithm.
DEVIATION_ENGINE: (e.g., 5) Defines the allowable deviation for signal generation.
BACKSTEP_ENGINE: (e.g., 5) Specifies the number of historical bars to look back.
Martingale Step Percent: (e.g., 0.5) The percentage price movement against the current position that triggers a Martingale signal.
Labels Transparency: Adjusts the transparency of the on-chart signal labels.
Buy-Color / Sell-Color: Sets the color for primary Buy and Sell signal labels.
Martingale Buy-Color / Martingale Sell-Color: Sets the color for Martingale Buy and Sell signal labels.
Label size: Controls the visual size of the labels.
Label Offset: Adjusts the vertical offset of the labels from the candlesticks.
Risk Warning:
Financial trading inherently carries significant risk. Martingale strategies are particularly high-risk and can lead to substantial losses or even complete liquidation of capital if the market moves strongly and persistently against your position. Always backtest thoroughly and practice with a demo account, fully understanding the associated risks, before engaging with real capital.
RSI Buy Sell Signals[RanaAlgo]Overview
This Premium RSI with Enhanced Signals builds upon the classic Relative Strength Index by incorporating multiple confirmation filters and visual enhancements to improve signal reliability. The indicator goes beyond basic overbought/oversold levels by adding volume confirmation, trend alignment, and peak detection logic.
Key Features
Enhanced Signal Detection
Peak Strength Filter: Requires RSI movements to meet minimum strength criteria (configurable from 1-5 bars)
Volume Confirmation: Optional volume filter to ensure signals occur with above-average trading activity
Trend Alignment: Optional trend confirmation that checks price position relative to 20-period EMA
Visual Improvements
Dynamic coloring of RSI line (green in oversold, red in overbought)
Customizable reference lines and zones
Clear buy/sell signals with triangle markers
Comprehensive info panel showing current RSI status
Alert Capabilities
Ready-to-use alert conditions for both buy and sell signals
Visual and audible alerts when signals trigger
How It Works
Core RSI Calculation: Uses standard RSI formula with configurable length (default 14)
Signal Generation:
Buy signals require either:
RSI rising from oversold with volume/trend confirmation (when enabled)
Simple crossover above oversold level (when filters disabled)
Sell signals require either:
RSI falling from overbought with volume/trend confirmation
Simple crossunder below overbought level
Additional Filters:
Minimum peak strength prevents weak, insignificant movements from generating signals
Volume filter helps confirm institutional participation
Trend filter aligns signals with broader price direction
Usage Instructions
Apply to any chart timeframe (works best on 1H or higher)
Configure settings in the input panel:
Adjust RSI length if needed
Set overbought/oversold levels (default 70/30)
Enable/disable volume and trend filters
Customize visual elements
Signals appear as triangles below/above the RSI line
Use alerts to get notified of new signals
Differentiation from Standard RSI
This indicator adds several layers of confirmation that aren't present in the basic RSI:
Multi-bar momentum requirement for peaks/troughs
Volume validation option
Trend confirmation option
Smoothed RSI line for cleaner visualization
Comprehensive info panel with current status
The combination of these features helps filter out false signals that commonly occur with traditional RSI implementations.

Uptrick: Stellar NexusOverview
Uptrick: Stellar Nexus is a multi-layered chart tool designed to help traders visualize market behavior with enhanced clarity and depth. It presents various overlays, signal triggers, and an asset-level behavioral table in one cohesive interface. Its core focus is to illustrate how different market states shift over time. By displaying directional structures, dynamic zones, momentum shifts, and a real-time probability assessment of multiple assets, it aims to deliver a comprehensive perspective for those looking to navigate complex market environments more confidently.
Purpose
The primary purpose of Stellar Nexus is to unify several market assessment methods into a single framework, sparing users the need to rely on multiple disjointed indicators. It is especially useful for traders who value having layered signals, interactive overlays, and a quick reference to asset-specific metrics within one tool. By consolidating multiple market insights, the script aspires to reduce guesswork, limit information overload, and present clear triggers for potential trade opportunities or risk management decisions.
Originality
Stellar Nexus stands out because it relies on a proprietary set of logic layers, each carefully designed to detect nuanced shifts in price movement. The script brings forward a streamlined depiction of underlying market changes through color-coded zones, shape markers, and short textual tags. Its architecture also accommodates multiple “modes” of viewing the market—be it through layered cloud structures, trend ribbons, or step-based overlays—so traders can adapt its outputs to match changing conditions. The presence of a specialized probability table and a real-time market state meter (HUD Meter) further underscores its uniqueness, providing at-a-glance scoring for various instruments and a gauge that visually displays ongoing transitions from trending to ranging phases.
Inputs
Stellar Nexus includes several user-configurable settings, organized into themed groups. Each input subtly modifies how information is derived or rendered on the chart:
General
Silken Veil (integer input) : Governs how smooth or responsive various underlying signals will appear.
Canvas (dropdown) : Chooses the primary visual overlay style among Nebula Trail, Velora, or Stellar Stepfilter.
Signals (dropdown) : Selects which built-in signal engine (Fluxor or Flowgen) is responsible for painting buy and sell markers.
Nova Tension (integer input) : Influences the internal motion sensitivity used by certain triggers.
Astral Ribbon (integer input) : Imparts a broader directional bias layer that can highlight whether the current environment is bullish or bearish.
Bands
Phase Delay (integer input) : Impacts baseline offsets for certain dynamic band calculations.
Band Softener (float input) : Creates a blended baseline, balancing two distinct smoothing techniques.
Spread Factor (float input) : Scales how wide or narrow the generated envelope bands become.
Layer Offset (float input) : Adjusts spacing between multiple layered boundaries in the band structure.
Smooth Mode (dropdown boolean) : Toggles an extra layer of smoothing on or off for the plotted envelopes.
Feed Matrix
Burst (integer input) : Adjusts how the Flowgen engine interprets momentum buildup. Higher values generally lead to more conservative signals.
Delta Curve Sync (integer input) : Alters the sensitivity of directional alignment within the Flowgen system, refining how quickly the script adapts to market slope changes.
Lambda Pulse Shift (integer input) : Controls timing offsets within the Flowgen structure, subtly influencing the trigger timing of transitions.
Sync Drift Limit (integer input) : Provides a stabilizing effect on the internal motion detection engine, helping reduce erratic behavior during choppy conditions.
WMA Open Filter Tunnel (integer input) : Filters signal validity by applying a dynamic range check on opening price structures, reducing false positives in unstable markets.
Probability Table
Show Predictability Table (boolean) : Enables or disables a table of asset metrics.
Show Numeric Values (boolean) : Switches between displaying numeric values and using simple directional markers in the table cells.
Stepfilter
Sensitivity (dropdown) : Offers a range of speed profiles (Very Fast to Very Slow and TURTLE option) that define how quickly or slowly the step-based overlay reacts to price changes.
HUD Meter
Show Stellar HUD Meter (boolean) : Turns on or off a specialized gauge for quick insight into trending vs. ranging conditions.
Take Profit Signals
Show TP Signals (boolean) : Determines whether exit or take-profit markers are displayed after certain conditions have been met.
Phase Length (integer input) : Influences the internal baseline used for the exit signal logic.
Sync Channel (integer input) : Sets a period within which different data points are compared or synced.
Filter (integer input) : Imposes an additional smoothing on exit-related cues.
Features
Signals (Fluxor and Flowgen)
Fluxor
Logic: Fluxor focuses on detecting specific price transitions, validating them against an internal directional and momentum layer, and then confirming the move based on the script’s overarching market bias.
Visual Representation: When Fluxor is activated, up and down label markers (“▲+” or “▼+”) appear at points the system regards as noteworthy transitions. These do not guarantee trades but are designed to guide users on when buying or selling pressure may have intensified or reversed.
How It Helps: Fluxor is streamlined for those who want simpler, clearer triggers that factor in both trend alignment and short-term motion shifts. This option is more for mean reversion traders.
Flowgen
Logic: Flowgen employs a slightly more sophisticated approach that evaluates multiple “environmental layers,” including structural alignment, directional slope checks, and distinct open-state filters.
Visual Representation: When Flowgen senses a valid transition, it prints discrete up and down markers, much like Fluxor, but triggered by different, multi-layer considerations.
How It Helps: Flowgen caters to traders who desire more emphasis on layered agreement—where multiple aspects of the market must line up before a signal is shown. This option is more for trend following traders.
Overlays (Nebula Trail, Velora, Stellar Stepfilter)
Nebula Trail
Purpose: This indicator employs dynamic, color-coded bands around price action to illustrate prevailing market bias and track which side—bulls or bears—wields greater influence, aligning with a trend-following approach.
Usage: This indicator creates outer and inner “band” regions that can function as potential support or resistance in alignment with market momentum. In bullish phases, the cloud below price acts as a supportive barrier, whereas during bearish conditions, the cloud above price provides a point of resistance. When a bearish signal is detected, traders may enter short positions on a price bounce off this band and then exit when subsequent take-profit cues appear, effectively leveraging the band for both entry and exit strategies.
Velora
Purpose: Extends the concept of band visualization into layered “tiers,” giving a more fine-grained view of how price transitions from one band to another.
Representation: Zones are subdivided into multiple steps, each with distinct shading. As the script’s internal logic detects shifts between bullish or bearish conditions, these layered bands expand or contract to reflect changing momentum.
Usage: Velora subdivides zones into multiple steps, each featuring distinct shading. As the script's internal logic detects shifts between bullish or bearish conditions, these layered bands expand or contract, signaling changes in momentum. When price enters the upper band, especially if the HUD meter shows less definitive momentum, it may hint at a non-trending environment; conversely, in a bearish scenario, the lower band can act as potential support. Narrower bands often point to an impending breakout, while wider bands can suggest a possible reversion in price. Velora is well-suited for traders wanting to see more intermediate zones where the market may hesitate or show partial confirmation—ideal for refined entries or exits.
Smooth:
Choppy:
Stellar Stepfilter
Purpose: Focuses on a persistent directional line that only updates when the script’s logic deems a genuine shift is taking place.
Representation: A single line plots on the chart to represent the “locked” direction. During periods of noise or indecision, this line may remain static, reducing false signals. Optionally, bars can be recolored to reflect bullish or bearish states.
Usage: Traders who prefer a minimalistic, stand-back approach often select Stellar Stepfilter for its ability to filter out choppy conditions and highlight clearer momentum strides. When the line remains flat—particularly in the very slow or “turtle” mode—it signals a ranging market, offering valuable insight into periods of reduced volatility. In TURTLE mode, bars are recolored green or orange to reflect locked trend direction more visibly. TURTLE mode offers the most conservative setting within the Stepfilter engine, emphasizing stability and clarity by reacting only to the strongest directional conditions and visually reinforcing its state through bar coloring.
Very Fast
Very Slow
TURTLE Mode
Probability Table
Description: The Probability Table is displayed on the top-right corner (by default). It automatically fetches data for a handful of assets (in this case, five popular cryptocurrencies), then scores each asset on multiple behavioral metrics. By default, the Probability Table monitors SOL, BTC, ETH, BNB, and XRP from Binance.
Metrics Explained:
HV: Suggests how the asset’s price is fluctuating relative to a standard reference.
ATR/Vol: A ratio that provides insight into volatility compared to trading activity.
WBR: Compares candle wicks against their bodies to gauge the frequency of price swings outside an open-close range.
Liq Clust: Indicates if there are pockets of stable or unstable liquidity.
Momentum: Observes shifts in buying or selling pressure.
PRI: Shows a baseline measure of how far price has deviated from a certain average over time.
Final Verdict: Based on each metric’s reading, an overall classification emerges: Predictable, Moderate, or Chaotic.
How It Helps: Traders can quickly scan this table to see if an asset’s environment is “Predictable” (potentially more structured), “Moderate” (balanced or transitional), or “Chaotic” (unstable and riskier). Each cell can optionally show either numeric approximations or simple “up/down” arrows to reduce clutter.
Non Numeric Values
Numeric Values
Stellar HUD Meter
Description: Located at the top center of the chart, this horizontal gauge toggles between “Trending” and “Ranging,” representing how firmly price is locked in directional expansion versus sideways hesitation.
Mechanics (General): The gauge increments or decrements over time, smoothing out abrupt shifts. A pointer slides across the meter, indicating whether conditions are leaning more toward persistent momentum or uncertain, choppy movement.
How It Helps: This immediate visual feedback helps traders decide if momentum strategies or mean-reversion approaches are more suitable at a given moment, avoiding reliance on guesswork alone.
Take Profit Signals
Description: After any buy or sell trigger occurs (either through Fluxor or Flowgen), the script can flag up to three potential exit points.
Trigger Logic (General): These exits appear when certain internal checks sense that short-term upside or downside pressure may be waning.
Representation: Small markers (“X”) appear near the top or bottom of the candle.
How It Helps: Rather than passively holding a position, these optional signals remind traders of possible exhaustion points. If they choose to follow them, it can help secure partial or full profits during a trend.
Why more than one indicator?
Having more than one internal indicator engine allows Stellar Nexus to adapt to different market behaviors and personal trading styles. Sometimes traders require swift, high-frequency triggers (Fluxor). Other times, they prefer more layered agreement before taking a position (Flowgen). Similarly, each overlay—Nebula Trail, Velora, and Stellar Stepfilter—offers a distinct method for visualizing price action. Markets are dynamic, and no single representation is ideal for all conditions. By blending multiple approaches into one script, Stellar Nexus provides flexibility: a user can switch between sets of signals or overlays based on market phase, personal risk preference, or the timeframe being traded.
Additional Features
Alert System: Built-in alerts for every trigger or state change ensure that traders can receive real-time notifications, even when away from the chart. The alert system includes buy/sell triggers, trend shifts, overlay transitions, take-profit points, and predictability status changes across monitored assets.
Selective Visibility: Users can enable or disable various modules—Probability Table, HUD Meter, Take Profit Signals—to keep their chart interface uncluttered.
State Persistence: Certain modules “lock in” their reading until a strong reason emerges to change it, which can help minimize false flips in volatile conditions.
Tailored Aesthetics: Color choices and label styling are curated to be visually distinct, reducing confusion when multiple signals or overlays occur simultaneously.
Conclusion
Uptrick: Stellar Nexus is a comprehensive, multi-layer script that merges aesthetic clarity with functional depth. It combines diverse overlays, signal engines, probability analyses, and a heads-up market meter into one cohesive tool. By handling trending vs. ranging states, evaluating asset predictability, and offering selective take-profit cues, it serves as a versatile companion for traders who want organized, visually intuitive guidance. Its originality is found not only in how it disguises internal computations, but in the ease with which users can cycle through different overlays and signals to suit changing market conditions. As always, personal due diligence, market awareness, and risk management remain essential. Stellar Nexus simply provides a refined canvas on which to read and interpret price action more confidently.
Disclaimer
This indicator is provided solely for informational and educational purposes. It does not constitute investment advice or a recommendation to engage in any trading activities. Trading and investing in financial markets involve significant risk, and past performance is not indicative of future results. Always conduct your own research, utilize proper risk management, and consider consulting a qualified financial professional before making any investment decisions. Neither the creator nor any contributors to this script accept any liability for financial losses or damages arising from its use. Users of this indicator assume full responsibility for their trading activities.

Reversal Trading Bot Strategy[BullByte]Overview :
The indicator Reversal Trading Bot Strategy is crafted to capture potential market reversal points by combining momentum, volatility, and trend alignment filters. It uses a blend of technical indicators to identify both bullish and bearish reversal setups, ensuring that multiple market conditions are met before entering a trade.
Core Components :
Technical Indicators Used :
RSI (Relative Strength Index) :
Purpose : Detects divergence conditions by comparing recent lows/highs in price with the RSI.
Parameter : Length of 8.
Bollinger Bands (BB) :
Purpose : Measures volatility and identifies price levels that are statistically extreme.
Parameter : Length of 20 and a 2-standard deviation multiplier.
ADX (Average Directional Index) & DMI (Directional Movement Index) :
Purpose : Quantifies the strength of the trend. The ADX threshold is set at 20, and additional filters check for the alignment of the directional indicators (DI+ and DI–).
ATR (Average True Range) :
Purpose : Provides a volatility measure used to set stop levels and determine risk through trailing stops.
Volume SMA (Simple Moving Average of Volume ):
Purpose : Helps confirm strength by comparing the current volume against a 20-period average, with an optional filter to ensure volume is at least twice the SMA.
User-Defined Toggle Filters :
Volume Filter : Confirms that the volume is above average (or twice the SMA) before taking trades.
ADX Trend Alignment Filter : Checks that the ADX’s directional indicators support the trade direction.
BB Close Confirmation : Optionally refines the entry by requiring price to be beyond the upper or lower Bollinger Band rather than just above or below.
RSI Divergence Exit : Allows the script to close positions if RSI divergence is detected.
BB Mean Reversion Exit : Closes positions if the price reverts to the Bollinger Bands’ middle line.
Risk/Reward Filter : Ensures that the potential reward is at least twice the risk by comparing the distance to the Bollinger Band with the ATR.
Candle Movement Filter : Optional filter to require a minimum percentage move in the candle to confirm momentum.
ADX Trend Exit : Closes positions if the ADX falls below the threshold and the directional indicators reverse.
Entry Conditions :
Bullish Entry :
RSI Divergence : Checks if the current close is lower than a previous low while the RSI is above the previous low, suggesting bullish divergence.
Bollinger Confirmation : Requires that the price is above the lower (or upper if confirmation is toggled) Bollinger Band.
Volume & Trend Filters : Combines volume condition, ADX strength, and an optional candle momentum condition.
Risk/Reward Check : Validates that the trade meets a favorable risk-to-reward ratio.
Bearish Entry :
Uses a mirror logic of the bullish entry by checking for bearish divergence, ensuring the price is below the appropriate Bollinger level, and confirming volume, trend strength, candle pattern, and risk/reward criteria.
Trade Execution and Exit Strateg y:
Trade Execution :
Upon meeting the entry conditions, the strategy initiates a long or short position.
Stop Loss & Trailing Stops :
A stop-loss is dynamically set using the ATR value, and trailing stops are implemented as a percentage of the close price.
Exit Conditions :
Additional exit filters can trigger early closures based on RSI divergence, mean reversion (via the middle Bollinger Band), or a weakening trend as signaled by ADX falling below its threshold.
This multi-layered exit strategy is designed to lock in gains or minimize losses if the market begins to reverse unexpectedly.
How the Strategy Works in Different Market Conditions :
Trending Markets :
The ADX filter ensures that trades are only taken when the trend is strong. When the market is trending, the directional movement indicators help confirm the momentum, making the reversal signal more reliable.
Ranging Markets :
In choppy markets, the Bollinger Bands expand and contract, while the RSI divergence can highlight potential turning points. The optional filters can be adjusted to avoid false signals in low-volume or low-volatility conditions.
Volatility Management :
With ATR-based stop-losses and a risk/reward filter, the strategy adapts to current market volatility, ensuring that risk is managed consistently.
Recommendation on using this Strategy with a Trading Bot :
This strategy is well-suited for high-frequency trading (HFT) due to its ability to quickly identify reversal setups and execute trades dynamically with automated stop-loss and trailing exits. By integrating this script with a TradingView webhook-based bot or an API-driven execution system, traders can automate trade entries and exits in real-time, reducing manual execution delays and capitalizing on fast market movements.
Disclaimer :
This script is provided for educational and informational purposes only. It is not intended as investment advice. Trading involves significant risk, and you should always conduct your own research and analysis before making any trading decisions. The author is not responsible for any losses incurred while using this script.

Adaptive Fibonacci Pullback System -FibonacciFluxAdaptive Fibonacci Pullback System (AFPS) - FibonacciFlux
This work is licensed under a Attribution-NonCommercial-ShareAlike 4.0 International (CC BY-NC-SA 4.0). Original concepts by FibonacciFlux.
Abstract
The Adaptive Fibonacci Pullback System (AFPS) presents a sophisticated, institutional-grade algorithmic strategy engineered for high-probability trend pullback entries. Developed by FibonacciFlux, AFPS uniquely integrates a proprietary Multi-Fibonacci Supertrend engine (0.618, 1.618, 2.618 ratios) for harmonic volatility assessment, an Adaptive Moving Average (AMA) Channel providing dynamic market context, and a synergistic Multi-Timeframe (MTF) filter suite (RSI, MACD, Volume). This strategy transcends simple indicator combinations through its strict, multi-stage confluence validation logic. Historical simulations suggest that specific MTF filter configurations can yield exceptional performance metrics, potentially achieving Profit Factors exceeding 2.6 , indicative of institutional-level potential, while maintaining controlled risk under realistic trading parameters (managed equity risk, commission, slippage).
4 hourly MTF filtering
1. Introduction: Elevating Pullback Trading with Adaptive Confluence
Traditional pullback strategies often struggle with noise, false signals, and adapting to changing market dynamics. AFPS addresses these challenges by introducing a novel framework grounded in Fibonacci principles and adaptive logic. Instead of relying on static levels or single confirmations, AFPS seeks high-probability pullback entries within established trends by validating signals through a rigorous confluence of:
Harmonic Volatility Context: Understanding the trend's stability and potential turning points using the unique Multi-Fibonacci Supertrend.
Adaptive Market Structure: Assessing the prevailing trend regime via the AMA Channel.
Multi-Dimensional Confirmation: Filtering signals with lower-timeframe Momentum (RSI), Trend Alignment (MACD), and Market Conviction (Volume) using the MTF suite.
The objective is to achieve superior signal quality and adaptability, moving beyond conventional pullback methodologies.
2. Core Methodology: Synergistic Integration
AFPS's effectiveness stems from the engineered synergy between its core components:
2.1. Multi-Fibonacci Supertrend Engine: Utilizes specific Fibonacci ratios (0.618, 1.618, 2.618) applied to ATR, creating a multi-layered volatility envelope potentially resonant with market harmonics. The averaged and EMA-smoothed result (`smoothed_supertrend`) provides a robust, dynamic trend baseline and context filter.
// Key Components: Multi-Fibonacci Supertrend & Smoothing
average_supertrend = (supertrend1 + supertrend2 + supertrend3) / 3
smoothed_supertrend = ta.ema(average_supertrend, st_smooth_length)
2.2. Adaptive Moving Average (AMA) Channel: Provides dynamic market context. The `ama_midline` serves as a key filter in the entry logic, confirming the broader trend bias relative to adaptive price action. Extended Fibonacci levels derived from the channel width offer potential dynamic S/R zones.
// Key Component: AMA Midline
ama_midline = (ama_high_band + ama_low_band) / 2
2.3. Multi-Timeframe (MTF) Filter Suite: An optional but powerful validation layer (RSI, MACD, Volume) assessed on a lower timeframe. Acts as a **validation cascade** – signals must pass all enabled filters simultaneously.
2.4. High-Confluence Entry Logic: The core innovation. A pullback entry requires a specific sequence and validation:
Price interaction with `average_supertrend` and recovery above/below `smoothed_supertrend`.
Price confirmation relative to the `ama_midline`.
Simultaneous validation by all enabled MTF filters.
// Simplified Long Entry Logic Example (incorporates key elements)
long_entry_condition = enable_long_positions and
(low < average_supertrend and close > smoothed_supertrend) and // Pullback & Recovery
(close > ama_midline and close > ama_midline) and // AMA Confirmation
(rsi_filter_long_ok and macd_filter_long_ok and volume_filter_ok) // MTF Validation
This strict, multi-stage confluence significantly elevates signal quality compared to simpler pullback approaches.
1hourly filtering
3. Realistic Implementation and Performance Potential
AFPS is designed for practical application, incorporating realistic defaults and highlighting performance potential with crucial context:
3.1. Realistic Default Strategy Settings:
The script includes responsible default parameters:
strategy('Adaptive Fibonacci Pullback System - FibonacciFlux', shorttitle = "AFPS", ...,
initial_capital = 10000, // Accessible capital
default_qty_type = strategy.percent_of_equity, // Equity-based risk
default_qty_value = 4, // Default 4% equity risk per initial trade
commission_type = strategy.commission.percent,
commission_value = 0.03, // Realistic commission
slippage = 2, // Realistic slippage
pyramiding = 2 // Limited pyramiding allowed
)
Note: The default 4% risk (`default_qty_value = 4`) requires careful user assessment and adjustment based on individual risk tolerance.
3.2. Historical Performance Insights & Institutional Potential:
Backtesting provides insights into historical behavior under specific conditions (always specify Asset/Timeframe/Dates when sharing results):
Default Performance Example: With defaults, historical tests might show characteristics like Overall PF ~1.38, Max DD ~1.16%, with potential Long/Short performance variance (e.g., Long PF 1.6+, Short PF < 1).
Optimized MTF Filter Performance: Crucially, historical simulations demonstrate that meticulous configuration of the MTF filters (particularly RSI and potentially others depending on market) can significantly enhance performance. Under specific, optimized MTF filter settings combined with appropriate risk management (e.g., 7.5% risk), historical tests have indicated the potential to achieve **Profit Factors exceeding 2.6**, alongside controlled drawdowns (e.g., ~1.32%). This level of performance, if consistently achievable (which requires ongoing adaptation), aligns with metrics often sought in institutional trading environments.
Disclaimer Reminder: These results are strictly historical simulations. Past performance does not guarantee future results. Achieving high performance requires careful parameter tuning, adaptation to changing markets, and robust risk management.
3.3. Emphasizing Risk Management:
Effective use of AFPS mandates active risk management. Utilize the built-in Stop Loss, Take Profit, and Trailing Stop features. The `pyramiding = 2` setting requires particularly diligent oversight. Do not rely solely on default settings.
4. Conclusion: Advancing Trend Pullback Strategies
The Adaptive Fibonacci Pullback System (AFPS) offers a sophisticated, theoretically grounded, and highly adaptable framework for identifying and executing high-probability trend pullback trades. Its unique blend of Fibonacci resonance, adaptive context, and multi-dimensional MTF filtering represents a significant advancement over conventional methods. While requiring thoughtful implementation and risk management, AFPS provides discerning traders with a powerful tool potentially capable of achieving institutional-level performance characteristics under optimized conditions.
Acknowledgments
Developed by FibonacciFlux. Inspired by principles of Fibonacci analysis, adaptive averaging, and multi-timeframe confirmation techniques explored within the trading community.
Disclaimer
Trading involves substantial risk. AFPS is an analytical tool, not a guarantee of profit. Past performance is not indicative of future results. Market conditions change. Users are solely responsible for their decisions and risk management. Thorough testing is essential. Deploy at your own considered risk.

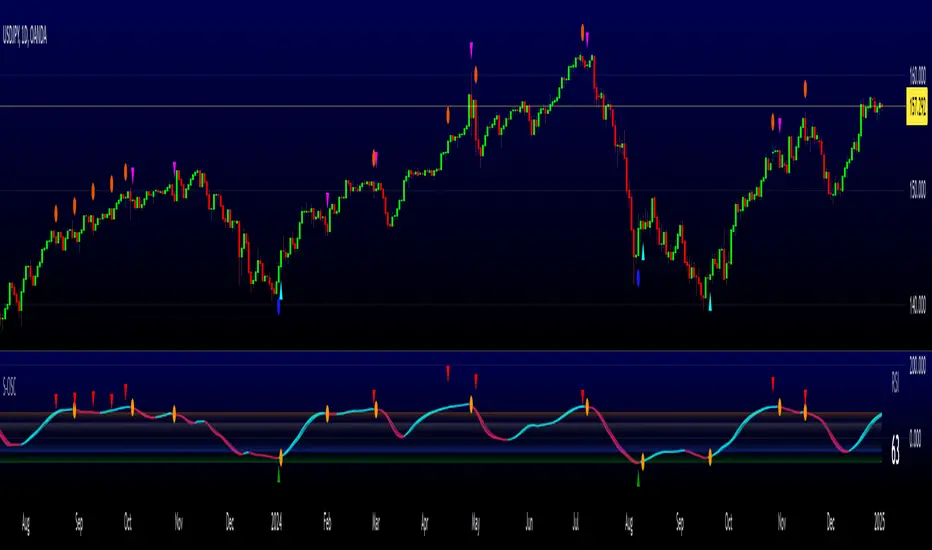
Professional MSTI+ Trading Indicator"Professional MSTI+ Trading Indicator" is a comprehensive technical analysis tool that combines over 20 indicators to generate high-quality trading signals and assess market sentiment. The script integrates standard indicators (MACD, RSI, Bollinger Bands, Stochastic, Simple Moving Averages, and Volume Analysis) with advanced components (Squeeze Momentum, Fisher Transform, True Strength Index, Heikin-Ashi, Laguerre RSI, Hull MA) and further includes metrics such as ADX, Chaikin Money Flow, Williams %R, VWAP, and EMA for in-depth market analysis.
Key Features:
Multiple Presets for Different Trading Styles:
Choose from optimal configurations like Professional, Swing Trading, Day Trading, Scalping, or Reversal Hunter. Note that the presets may not work perfectly on all pairs, and manual calibration might be required. This flexibility allows you to fine-tune the settings to align with your unique strategies and signals.
Multi-Layered Signal Filtering:
Filters based on trend, volume, and volatility help eliminate false signals, enhancing the accuracy of market entries.
Comprehensive Fear & Greed Index:
The indicator aggregates data from RSI, volatility, momentum, trend, and volume to gauge overall market sentiment, providing an additional layer of market context.
Dynamic Information Panel:
Displays detailed status updates for each component (e.g., MACD, RSI, Laguerre RSI, TSI, Fisher Transform, Squeeze, Hull MA, etc.) along with a visual strength bar that represents the intensity of the trading signal.
Signal Generation:
Buy and sell signals are generated when a predefined number of conditions are met and confirmed over multiple bars. These signals are clearly displayed on the chart with arrows, making it easier to spot potential entry and exit points.
Alert Setup:
Built-in alert conditions allow you to receive real-time notifications when trading signals are generated, helping you stay on top of market movements.
"Professional MSTI+ Trading Indicator" is designed to enhance your trading strategy by providing a multi-faceted market analysis and an intuitive visual interface. While the presets offer a robust starting point, they may require manual calibration on certain pairs, giving you the flexibility to configure your own unique strategies and signals.

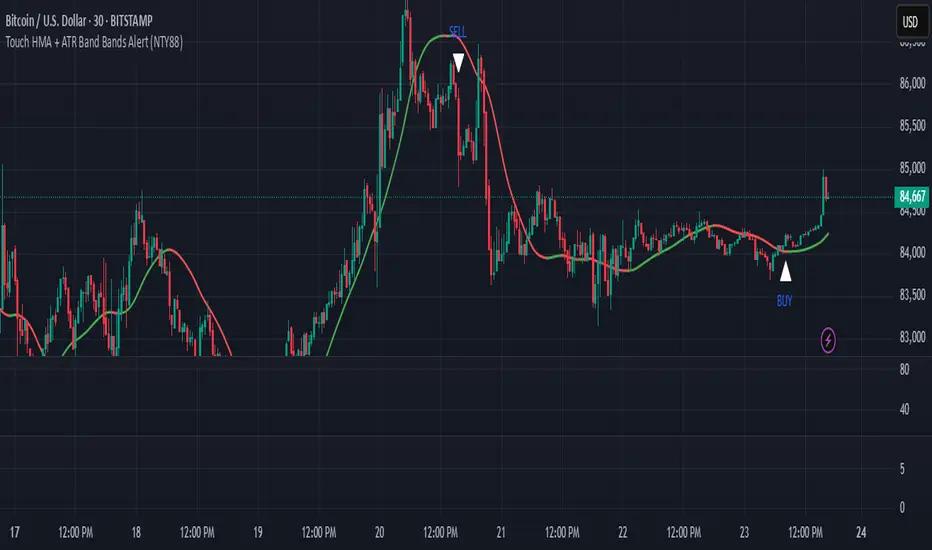
Touch HMA + ATR Band Bands Alert (NTY88)🔔 Precision Alerts | No Repainting | ATR-Based Touch Detection | HMA Trend Coloring
This script is a clean and powerful tool designed to help you catch precise market reversals using ATR Band touches combined with trend-following logic.
📌 How It Works
A custom Hull Moving Average (HMA) is used to track the trend.
Two dynamic ATR-based bands are drawn above and below the HMA.
A signal is generated when the closing price touches the upper or lower ATR band within a small tolerance zone.
✅ Key Features
🔁 Alternating Signals: Only one Buy → then one Sell → then Buy again. No signal spam.
🟢🔴 Color-Changing HMA Line: Green = HMA rising | Red = HMA falling
📏 Price Tolerance Input: Define how close the candle must be to the ATR band to trigger a signal.
🔔 Real-Time Alerts: Easily set alerts for Buy and Sell signals — works in live markets.
🚫 No Repainting: All signals are confirmed at candle close and will not change afterward.
🎯 When to Use
Great for trend reversals, scalping zones, or identifying potential exhaustion points.
Works well on any timeframe or market (crypto, stocks, forex).
💬 Pro Tip:
Combine this with RSI, Volume, or ADX filters to build a complete confluence system.
📈 Built for traders who love clean logic, precision entries, and visual clarity.
PROFIT ZONE PRO Profit Zone Pro:
ProfitZone Pro is a risk-reward indicator that helps traders identify trade setups, manage risk, and set profit targets. Designed for simplicity, this free tool generates entry, stop-loss, and take-profit levels based on support and resistance, Trailing Stoploss and built in automated alerts, with additional features to enhance trade planning, Along with a learning mode based on successful trades made
Features
Trade Setup Identification: Detects potential buy (long) or sell (short) entries using support and resistance levels, with an optional trend filter based on a 50-period SMA.
Risk-Reward Zones: Displays entry (yellow), stop-loss (red), and take-profit (green) levels, with shaded risk (red) and reward (green) zones.
Position Sizing: Calculates position size based on user-defined risk percentage and account balance.
Breakeven and Trailing Stop: Includes a breakeven feature to move the stop-loss to the entry price at a user-defined percentage of the take-profit distance, and an optional trailing stop to lock in profits.
Confidence Score: Provides a volatility-based confidence score (0-100%) to assess setup reliability.
Learning Adjustment: Adjusts stop-loss distances based on the number of successful trades entered by the user.
Info Label: Shows position size, risk, reward, direction, confidence score, ATR, trend direction (if enabled), and trailing stop status.
Alerts: Sends notifications for entry, stop-loss, take-profit, breakeven, trailing stop, and theme changes.
Customizable Display: Offers options for zone opacity, line styles (solid, circles, dotted), zone labels, and color themes (Light, Dark, Custom).
Long Mode Feature:
Short Mode Feature:
Trend Filter Feature:
Auto Trading Mode:
Usage Instructions
Add the indicator to your chart.
Adjust settings in the indicator’s properties:
Set Risk % of Account and Account Balance to define your risk and position size.
Choose Trade Direction (Auto, Long, or Short) to filter setups.
Enable Trend Filter to align trades with the market trend.
Turn on Trailing Stop and set Trailing Stop % of Reward to lock in profits.
Customize visuals (zone opacity, line style, colors) as needed.
Monitor the chart for entry (yellow), stop-loss (red), and take-profit (green) levels.
Use the info label to view position size, risk, reward, confidence score, and other details.
Set alerts for entry, stop-loss, take-profit, breakeven, and trailing stop events.
After a successful trade, increment Number of Successful Trades to adjust future stop-loss distances.
This Script is to help you have a better idea on those famous questions we ask ourselves:
Entry
Take Profit
Stoploss
The confidence score, R:R calculator, Trend Filter, Learning Mode further helps to zone in on accuracy
Happy Trading
- EZ ALGO

Simple APF Strategy Backtesting [The Quant Science]Simple backtesting strategy for the quantitative indicator Autocorrelation Price Forecasting. This is a Buy & Sell strategy that operates exclusively with long orders. It opens long positions and generates profit based on the future price forecast provided by the indicator. It's particularly suitable for trend-following trading strategies or directional markets with an established trend.
Main functions
1. Cycle Detection: Utilize autocorrelation to identify repetitive market behaviors and cycles.
2. Forecasting for Backtesting: Simulate trades and assess the profitability of various strategies based on future price predictions.
Logic
The strategy works as follow:
Entry Condition: Go long if the hypothetical gain exceeds the threshold gain (configurable by user interface).
Position Management: Sets a take-profit level based on the future price.
Position Sizing: Automatically calculates the order size as a percentage of the equity.
No Stop-Loss: this strategy doesn't includes any stop loss.
Example Use Case
A trader analyzes a dayli period using 7 historical bars for autocorrelation.
Sets a threshold gain of 20 points using a 5% of the equity for each trade.
Evaluates the effectiveness of a long-only strategy in this period to assess its profitability and risk-adjusted performance.
User Interface
Length: Set the length of the data used in the autocorrelation price forecasting model.
Thresold Gain: Minimum value to be considered for opening trades based on future price forecast.
Order Size: percentage size of the equity used for each single trade.
Strategy Limit
This strategy does not use a stop loss. If the price continues to drop and the future price forecast is incorrect, the trader may incur a loss or have their capital locked in the losing trade.
Disclaimer!
This is a simple template. Use the code as a starting point rather than a finished solution. The script does not include important parameters, so use it solely for educational purposes or as a boilerplate.

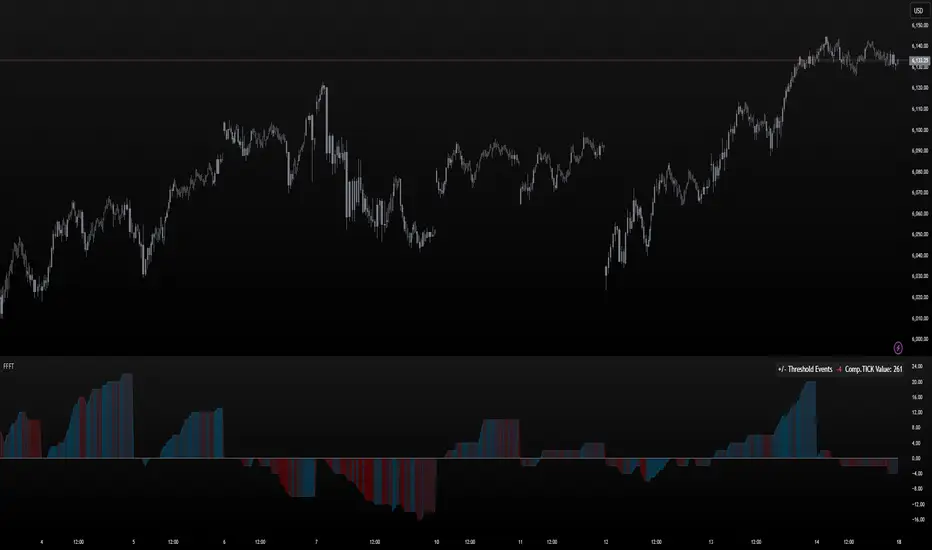
FoundryFutures Filtered Tick**Foundry Futures Filtered Tick (FFFT) – TradingView Indicator**
Overview
The Foundry Futures Filtered Tick (FFFT) is a market breadth indicator that filters out noise to track only significant tick events. Using a Custom Composite Cumulative Tick formula, it monitors buying and selling pressure during large events or waves of orders across exchanges. This gives traders a clearer view of market sentiment and momentum shifts throughout the trading day, without the distraction of minor tick movements.
Key Features
• Filters large tick events while ignoring minor fluctuations
• Tracks cumulative bullish/bearish threshold crossings ("Events") to highlight momentum shifts
• Uses dynamic color gradient visualization (red for selling, cyan for buying)
• Provides zero-line reference for directional bias
• Displays integrated real-time table for market context and large event tracking
How to Use
1. Add to favorites
2. Open chart, navigate to indicators tab > Favorites > Search "FoundryFutures Filtered Tick"
3. Apply to your chart
4. Select preferred market and begin using
Adjust Settings
• Set positive & negative thresholds to define meaningful tick events (Default +/-999)
• Customize line width and colors for better visibility if desired
• Interpret Signals above or below zero intraday as momentum shifts in sentiment across exchanges.
• Above zero & rising → Increasing bullish momentum
• Below zero & falling → Increasing selling pressure
• Frequent crossings → Potential market exhaustion or range bound activity
Risk Disclaimer & Release of Liability
Trading futures is highly speculative and involves substantial risk. The FFFT indicator does not predict market direction or guarantee profitability. It is for educational purposes only and should be used alongside proper risk management and independent analysis.
**By using this indicator, you acknowledge that:**
• You are solely responsible for your trading decisions
• Foundry Futures and its creator make no warranties or guarantees regarding accuracy or profitability
• You assume full responsibility for any financial losses incurred
• If you do not agree with these terms, do not use this indicator. Trade responsibly
Scalping long-shortThe Scalping long-short indicator is a comprehensive system for analyzing candle patterns and trading volume, designed for use in a scalping strategy. The main purpose of the indicator is to identify the key points of changing market sentiment and provide the trader with accurate signals for entering a trade.
The main components of the indicator:
1. Candle Pattern Analysis:
The indicator analyzes four main candle patterns:
-A Bullish Hammer is a candle with a small body and a long lower tail, which indicates the possible completion of a downward movement and the beginning of an uptrend.
-Bearish Hanging Man is a candle similar to a bullish hammer, but it appears after an upward movement, signaling the possible beginning of a downtrend.
-Bullish Engulfing is a candle with a large body that completely covers the body of the previous candle, showing strong buyer interest.
-Bearish Engulfing is the reverse situation, when a large bearish candle absorbs the previous bullish candle, indicating the predominance of sellers.
-Doji is a candle with almost identical opening and closing prices, indicating market indecision.
For each of these patterns, the indicator sets certain threshold values that the user can adjust to their preferences and features of the trading instrument.
2. Volume analysis:
The volume is an important confirmation of the strength of the signal. The indicator compares the current volume with the average value for the user-selected period (length parameter) multiplied by the volumeMultiplier coefficient. If the current volume exceeds this indicator, the signal is considered confirmed.
3. Visual indication:
Graphical elements corresponding to each type of signal are displayed on the price chart.:
-The green triangle down is a buy signal (bullish hammer or bullish takeover).
-The red triangle up is a sell signal (bearish hanging or bearish engulfing).
-The yellow diamond is a neutral state (doji).
These visual cues help you quickly assess the current market situation without having to analyze each candle manually in depth.
4. Alerts:
The indicator supports setting alerts that can be sent via the TradingView platform or other supporting systems. This allows the trader to receive notifications about the occurrence of new signals even outside the workplace.
Settings:
The user can change the following settings:
-Length is the period for calculating the average volume.
-Multiplier is a multiplier for the thresholds of candle patterns.
-HammerThreshold, HangingManThreshold, EngulfingThreshold, DojiThreshold are Thresholds for recognizing specific candlestick patterns.
-VolumeMultiplier is a coefficient for comparing the current volume with the average value.
These parameters allow you to adapt the indicator to various trading instruments and time intervals, making it a universal tool for a wide range of traders.
Conclusion:
The Scalping long-short indicator combines powerful analytical tools to identify key points in the market, providing the trader with clear and timely signals for making trading decisions. Its flexibility and fine-tuning capability make it useful for both beginners and experienced market participants.

Stochastics Oscillator with Buy/Sell Indicator [iSTAGs]iSTAGs "Stochastics Oscillator" with Buy/Sell Indicator
Overview
The Stochastics Oscillator is a versatile trading indicator designed to provide comprehensive insights into market momentum and potential price reversals. With its multi-layered approach, it incorporates a blend of oscillators, smoothed averages, and relative strength measures to deliver actionable trading signals.
Disclaimer
This indicator is provided for study purposes only . While it may assist in identifying potential buy and sell opportunities, please note:
1. False Signals: The buy/sell indicators may generate false signals. Always validate signals using additional analysis or tools.
2. Trading Strategies: Use appropriate exit points and stop-loss levels as part of your overall trading strategy.
3. No Guarantees: Do not rely solely on this indicator for trading decisions. Market conditions may change, and no indicator guarantees accurate results.
4. Strategy Testing: The strategy associated with this indicator is not tested, and backtesting features are not available at this time.
Key Features
1. Stochastics Oscillator
• Combines the smoothed ranges of price movement to identify overbought and oversold conditions.
• Inbuilt signal lines helps pinpoint potential crossovers for trend reversals.
2. Zones Highlighting
• Clearly visualized zones for:
o Overbought (70–100): Caution for potential reversals.
o Bullish (0–40): Positive momentum.
o Bearish (0 to -40): Negative momentum.
o Oversold (-70 to -100): Potential buying opportunities.
3. Buy and Sell Signals
• Primary Buy/Sell Indicator: Highlighted directly on the chart for ease of use.
• Potential Buy/Sell Signals: Secondary indicators based on advanced crossover conditions that can generate early signals.
4. RSI Integration
• Realtime RSI value display for an additional layer of confirmation.
• Color-coded RSI values to easily interpret market strength:
o Red: Overbought (>80)
o Orange: Strong momentum (70–80)
o White: Neutral (30–70)
o Blue: Weak momentum (20–30)
o Green: Oversold (<20)
5. Limited Customizable Visuals
o Clean and color-coded plots and fills make it intuitive to identify trends and trading opportunities at a glance.
How to Use
1. Trading Signals:
• Use buy/sell shapes and flags for identifying potential entry and exit points.
• Combine primary buy/sell indicator and secondary buy/sell signals for higher confidence.
2. Trend Confirmation:
• Monitor the oscillator and signal crossovers alongside zone fills to gauge market direction.
3. RSI Analysis:
• Keep an eye on the RSI value and its color coding for confirmation of overbought or oversold conditions.
Settings
• Enable/Disable Features: Customize the visibility of Buy/Sell indicators, Potential Signals, and RSI display.
• Editable Zones: Adjust zone colors and ranges to suit your trading strategy.
Conclusion
The Stochastics Oscillator is a powerful tool for traders seeking to enhance their technical analysis. Its layered approach provides clarity, precision, and adaptability for a wide range of trading strategies, whether you're a scalper, swing trader, or long-term investor.
________________________________________
Developed by iSTAGs
________________________________________
Happy Trading! 🎯
Improved G-Trend DetectionIt is the Improved version of G trend channel detection.
The Umair Trend Detection Indicator is a powerful tool designed to help traders identify potential buy and sell opportunities by combining dynamic price channels with RSI-based confirmation. This indicator is suitable for all types of financial markets, including stocks, forex, and cryptocurrencies.
Key Features:
Dynamic G-Channels
Calculates upper, lower, and average price channels based on the "G-Channel" methodology.
Helps identify market extremes and potential reversal points.
RSI Confirmation
Integrates RSI (Relative Strength Index) to filter buy and sell signals.
Avoids false signals by ensuring market momentum aligns with trend direction.
Buy/Sell Signals
Generates "Buy" signals when bullish conditions align with oversold RSI levels.
Generates "Sell" signals when bearish conditions align with overbought RSI levels.
Exit Signals
Provides optional exit points for both long and short positions using a buffer for confirmation.
Visual Clarity
Displays clearly plotted channels and average lines to help visualize price trends.
Buy and sell signals are marked with arrows for easy identification on the chart.
Custom Alerts
Offers customizable alerts for buy, sell, and exit conditions, ensuring traders never miss an opportunity.
Input Parameters:
Channel Length: Controls the sensitivity of the G-Channels.
Multiplier: Adjusts the width of the channels to suit different market conditions.
RSI Settings: Customize RSI length and thresholds for overbought/oversold conditions.
Exit Signal Buffer: Adds flexibility to the exit strategy by delaying signals for confirmation.
How It Helps:
The Umair Trend Detection Indicator is perfect for traders looking for an easy-to-use trend-following system with strong confirmation. By combining dynamic channels with RSI, it provides accurate and reliable signals to enter and exit trades, minimizing risks associated with false breakouts or trend reversals.
Use Cases:
Trend Trading: Identify and follow long-term trends with confidence.
Swing Trading: Spot reversals and capitalize on medium-term price movements.
Risk Management: Use exit signals to lock in profits or limit losses effectively.
This indicator is a versatile tool for both novice and experienced traders. Fine-tune its settings to align with your trading style and improve your decision-making in any market.

MACD Buy/Sell Labels + Barcolor👉 MACD Buy/Sell Labels + Barcolor
This advanced indicator combines the functionality of the MACD (Moving Average Convergence Divergence) with intuitive and customizable visual features, making it ideal for traders looking for an efficient tool to confirm buy and sell signals across any market.
It is based on the logical interpretation of a modified oscillator to improve its performance and simplify its usage. The indicator integrates seamlessly into the chart, offering an intuitive and easy-to-understand experience.
📍 Labels (Buy/Sell):
The signals are generated automatically by crossovers between the Fast EMA and Slow EMA of the Gaussian MACD. It comes with a default configuration designed to favor clean crossovers while avoiding false signals.
🧪 Barcolor:
The color of the candles dynamically changes according to the range of the Gaussian MACD histogram. This allows for a clear visualization of the MACD's status without needing to display the full oscillator. This feature integrates with the labels, as explained in the "Interpretation" section, to significantly increase their probability of success. Both the ranges and colors are fully customizable through the settings panel.
⚙️ Settings:
All aspects of the indicator can be customized:
1-MACD: Like a standard MACD, you can adjust the EMA lengths and the signal smoothing to adapt it to your trading style and the markets you trade.
2-Barcolor: The predefined values highlight extreme levels for proper interpretation, as explained in the "Interpretation" section. However, intermediate levels are also included in case you want to implement them in your strategy. You can adjust these values based on what you consider "overbought" or "oversold." This flexibility allows adaptation to various assets, as oscillator behavior varies across different instruments.
3-Buy/Sell Filter:
The filter settings allow you to further refine the signals. The default values of -70 (Buy Filter) and 80 (Sell Filter) work best for me, but you can adjust them as you see fit. Keep in mind:
-Higher distance from zero: More filtered signals (fewer, but higher quality).
-Closer to zero: Less filtered signals (more frequent, but with increased risk of false signals).
🤔 Interpretation:
As mentioned earlier, this follows the classic interpretation of a MACD oscillator: overbought/oversold levels combined with crossovers. However, the barcolor variable is what makes this indicator truly unique.
With barcolor, you can detect potential divergences and confirm them using the labels. When the oscillator reaches an extreme zone, barcolor provides a visual alert. Once the oscillator exits this zone, the candles revert to their normal color. This signals that the oscillator is dropping. If the price continues rising, this divergence can indicate an anomaly in the market. Waiting for confirmation from the label increases the probability of successful trades while detecting unusual market deviations without even looking at the oscillator.
Purpose:
This indicator is designed to help traders simplify the interpretation of the MACD. It can be used on any timeframe, but it was primarily tested using technical analysis concepts and basic liquidity principles. Its effectiveness improves significantly if you understand broader market dynamics.
Disclaimer:
This is purely an analytical tool and should NOT be considered as trading signals. Perform your own research and make decisions based solely on your responsibility. Thank you!

Up and Downwhat is "Up and Down"?
It is an indicator designed to show you in detail on the chart and warn you when there is an increase or decrease in the market at a level that you consider important.
what it does?
When the price difference between a top and bottom is greater than the level you selected (the default input is 10 percent), it indicates this along with the percentage value on the chart. Then, it indicates the start and end points with lines so that you can see the change from where to where. It shows the price's current percentage distance from the last bottom or top in the upper right corner.
it also colors the candles so you can better understand how fast the price is moving. The greener the candles, the stronger the rise, and conversely, the greater the decline, the redder the candles. Of course, if you set an alarm, it will tell you in which trading pair, in which time period, at what percentage and in which direction there is a movement.
how it does it?
It uses a moving average with a short length to find bottoms and tops. It then measures the distance from the last peak to the bottom and expresses it as a percentage. It uses momentum using the moving average as a source to paint the candles. To compress this momentum between the values 255 and 0, I used a formula that I also used in my limited fisher transform work (because the inputs in the color.rgb function take values between 0 and 255). It was a bit challenging to use the lines correctly, but with the "ta.valuewhen" function and a little experimenting, they were I made sure they were drawn correctly.
how to use it?
It is quite simple to use. First, select the minimum interval you want to receive alarms. If you make this value too high, you will not receive any alarms; if you make it too low, you will receive too many alarms. Choose the range that will benefit you most for the trading pair you are using. Then all you have to do is set an alarm. When you set an alarm, leave the note section blank and the indicator will send you the necessary information.

Dynamic RSI with Overbought/Oversold LinesDynamic RSI with Overbought/Oversold Lines
This indicator enhances the traditional RSI (Relative Strength Index) by dynamically adjusting the overbought and oversold levels based on the highest and lowest RSI values over a user-defined period. The indicator plots these levels as horizontal lines, allowing traders to visually identify when the market is "overbought" or "oversold."
Features:
Dynamic Overbought/Oversold Levels: Automatically adjusts the overbought and oversold levels based on the highest and lowest RSI values within the defined period, ensuring more accurate signals tailored to the current market conditions.
Customizable RSI Period: Choose your preferred RSI period to suit your trading strategy.
Signal Alerts: Visual signals are displayed when the RSI crosses into the overbought or oversold zone, indicating potential reversal points.
Background Color Alerts: The background changes color when the RSI exceeds overbought or oversold levels, making it easier to spot these important zones at a glance.
Clean and Simple: A minimalist design focusing on the key elements, making it suitable for all traders.
How to Use:
Overbought Zone: When the RSI moves above the overbought line (red), it may indicate that the asset is overbought, signaling a potential price reversal or pullback.
Oversold Zone: When the RSI moves below the oversold line (green), it may indicate that the asset is oversold, signaling a potential price bounce or reversal.
This dynamic RSI indicator is perfect for those looking to capture market extremes and improve their trading decisions. It's especially useful for timeframes like 30-minute and 1-hour charts, where market conditions tend to shift more rapidly.

Samih Signal AV V2The Samih Signal VA indicator is built for traders who prioritize technical analysis to determine market entry and exit points. It combines signals based on volume, moving averages, the Volume Weighted Average Price (VWAP), and identifies specific candlestick patterns, such as the Pin Bar and Inside Bar. This indicator assists in spotting optimal moments to buy or sell by analyzing trends, volume activity, and nearby liquidity zones.
Parameters and Features:
Simple Moving Average (MA) and VWAP:
Samih Signal VA uses a 50-period simple moving average for trend identification, paired with VWAP to refine price analysis with volume-weighted data.
Together, these components reveal whether the market is trending upward or downward, strengthening the reliability of entry and exit signals.
Volume Threshold:
A volume filter is applied by calculating a 20-period moving average, then setting a threshold at 1.2 times this average volume. This filter helps prevent false signals, focusing only on periods of increased market interest.
Candlestick Pattern Recognition:
Pin Bar: Detects this popular reversal/continuation pattern in both bullish and bearish scenarios, indicating potential entry or exit points.
Inside Bar: Identifies this pattern, which represents a moment of price compression and indecision, often preceding a breakout.
Trend Identification:
The indicator defines an uptrend when the price remains above both the MA and VWAP. A downtrend is confirmed when the price stays below these indicators.
Liquidity Zone Detection:
Samih Signal VA includes a feature to approximate liquidity zones, identifying recent support and resistance levels. Recognizing when prices approach these areas enhances the accuracy of buy or sell signals.
Buy and Sell Signal Logic:
Buy Signal: Triggered when a bullish Pin Bar or Inside Bar appears in an uptrend with high volume and proximity to a liquidity zone.
Sell Signal: Generated when a bearish Pin Bar or Inside Bar is detected in a downtrend with high volume, near a liquidity zone.
Signal Display on the Chart:
The indicator marks buy signals with a green “BUY” label below the bar, and sell signals with a red “SELL” label above the bar, directly on the chart for immediate clarity.
Summary:
The Samih Signal VA is suited for traders focused on precise entries and exits, integrating trend analysis, volume metrics, and candlestick patterns. By identifying liquidity zones, this indicator reduces the likelihood of false signals and provides clear buy and sell alerts.
This description can be easily added to TradingView to help users understand the features and decision-making logic of the Samih Signal VA indicator. Let me know if you’d like any additional adjustments!
Weekly RSI Buy/Sell SignalsWeekly RSI Buy/Sell Signal Indicator
This indicator is designed to help traders identify high-probability buy and sell opportunities on the weekly chart by using the Relative Strength Index (RSI). By utilizing weekly RSI values, this indicator ensures signals align with broader market trends, providing a clearer view of potential price reversals and continuation.
How It Works:
Weekly RSI Calculation: This script calculates the RSI using a 14-period setting, focusing on the weekly timeframe regardless of the user’s current chart view. The weekly RSI is derived using request.security, allowing for consistent signals even on intraday charts.
Signal Conditions:
Buy Signal: A buy signal appears when the RSI crosses above the oversold threshold of 30, suggesting that price may be gaining momentum after a potential bottom.
Sell Signal: A sell signal triggers when the RSI crosses below the overbought threshold of 70, indicating a possible momentum shift downwards.
Visual Cues:
Buy/Sell Markers: Clear green "BUY" and red "SELL" markers are displayed on the chart when buy or sell conditions are met, making it easy to identify entry and exit points.
RSI Line and Thresholds: The weekly RSI value is plotted in real time with color-coded horizontal lines at 30 (oversold) and 70 (overbought), providing a visual reference for key levels.
This indicator is ideal for traders looking for reliable, trend-based signals on higher timeframes and can be a helpful tool for filtering out shorter-term market noise.

Buy/Sell IndicatorBuy/Sell Indicator
Overview
The Buy/Sell Indicator is designed to help traders identify potential entry and exit points in the market using a combination of Simple Moving Averages (SMA) and the Relative Strength Index (RSI). This indicator plots buy and sell signals directly on the chart, making it easier to make informed trading decisions.
Inputs
Fast MA Length: The period for the fast-moving average. Default is 9.
Slow MA Length: The period for the slow-moving average. Default is 21.
RSI Length: The period for the RSI calculation. Default is 14.
RSI Overbought Level: The RSI level considered overbought. Default is 70.
RSI Oversold Level: The RSI level considered oversold. Default is 30.
How It Works
Moving Averages:
The indicator calculates two SMAs: a fast-moving average (fastMA) and a slow-moving average (slowMA).
The fast MA reacts more quickly to price changes, while the slow MA reacts more slowly.
RSI:
The RSI is calculated to measure the momentum of price movements.
It helps identify overbought and oversold conditions in the market.
Buy and Sell Conditions:
Buy Signal: A buy signal is generated when the fast MA crosses above the slow MA and the RSI is below the overbought level.
Sell Signal: A sell signal is generated when the fast MA crosses below the slow MA and the RSI is above the oversold level.
Plotting
Buy Signals: Displayed as green labels below the bars where the buy condition is met.
Sell Signals: Displayed as red labels above the bars where the sell condition is met.
Moving Averages: The fast MA is plotted in blue, and the slow MA is plotted in orange.

Thrax - QuickStrike 5-Mins Scalping** Indicator Description **
1. Price Change Threshold (%) – The minimum price change required for a candle to be recognized as significant. Candles exceeding this threshold are considered potential candidates for zone creation. Default value for 5 min is 0.5%. As you move on higher timeframe the threshold should increase
2. Percentage Change for Zones (%) – The amount of price movement needed to form a dynamic support or resistance zone. Tweak this to control how sensitive the indicator is to price fluctuations. 5 min default value is 1%. For 15 min suggested is 2-3%.
3. Break Threshold for Zones (%) – Defines how much price must break above or below a zone for it to be removed from the chart/mitigated. Keeps the chart clean by removing invalidated zones. Default value is 0.1% in 5 min, for 15 min it is 0.5%.
4. Buy Zone Retracement Level (%) – The percentage retracement level for defining the inner buy zone within a broader bullish zone. Ideal for timing precision entries. Ideal value is 75%
5. Sell Zone Retracement Level (%) – The percentage retracement level used to determine the inner sell zone within a larger bearish zone. Helps in identifying potential reversal areas or exits. Ideal value is 25%
By tailoring these inputs, traders can fully customize the indicator to suit their scalping strategies, enhancing their ability to navigate fast-moving markets with confidence.
---------------------------------------------------------------------------
There are two primary approaches for scalping using this indicator:
1. Candle-Based Scalping:
a. Bullish Signal: When you observe a bullish candle highlighted in blue (by default), you can consider entering a long position at the close of this candle. It’s advisable to wait for the candle to close before taking action. For a more aggressive scalp, you might take profits based on your scalp target after a few subsequent candles. If the price remains stagnant or moves unfavorably in the next few candles, you can exit with a small loss. Alternatively, if you have a higher risk tolerance, you may hold the position even if the price initially declines within a set percentage.
b. Bearish Signal: For a bearish candle highlighted in yellow, you can enter a short trade at the close of the candle. Similar to the bullish setup, you have the option to exit after a few candles if the price doesn’t move as expected or hold the position with a higher risk tolerance if the price goes up initially.
2. Zone-Based Scalping:
Entering Zones: Monitor the price as it enters a defined support or resistance zone. If you are open to higher risk, you can enter a trade immediately upon the price entering the zone. For a more cautious approach with a smaller stop loss, wait for the price to reach a retracement level within the zone before initiating your trade. This approach allows for a more precise entry but may result in missing out on trades if the price reverses before hitting the retracement level. Conversely, entering at the zone’s boundary offers the potential for early trade capture but comes with a higher stop loss risk.
Adjust these strategies based on your risk tolerance and trading preferences to optimize your scalping opportunities.

Market Flow with Convergence🟪 Overview
The "Market Flow with Convergence" indicator leverages advanced volume metrics to accurately measure the underlying market pressure by analyzing the cumulative buying and selling volumes with the TICK index. This unique combination helps identify potential market reversals and trends, providing a comprehensive view of market flow. The indicator is particularly useful for those looking to capture convergence and divergence signals, crucial for making informed trading decisions.
🟪 Features
Volume-Based Convergence: Calculates the buying and selling pressures based on volume data, to produce color coded convergence. Visually represents areas where buying or selling pressures align.
Divergence Detection: Identifies and visually represents areas where buying and selling pressures diverge from each other, which can indicate key market turning points.
TICK Index: Incorporates data from the TICK index, normalizing and smoothing the cumulative data to highlight potential market reversals and trends.
Cumulative Flow Crossovers: Identifies and visually represents areas where buying and selling pressures crossover and become the dominant market flow.
Customizable Visualization: Uses conditional coloring and shapes to provide a clear, easy-to-interpret visual representation of the market state, making it easier to spot critical signals at a glance.
🟪 How it Works
Leveraging a combination of volume analysis and market breadth data, particularly the TICK index, to assess the underlying market pressure. By normalizing key market metrics, the indicator provides a clear view of buying and selling activity over time. The flow is standard across all charts, but convergence will change based on the charts ticker.
The indicator tracks and aggregates movements in the TICK index, allowing for an assessment of the market's cumulative momentum. This cumulative measure, combined with volume-based analysis, helps traders identify potential shifts in market trends, whether they be continuations or reversals.
The visual output of the indicator is designed to be intuitive and actionable. Key market conditions are highlighted through color-coded histograms and plot shapes, making it easy to interpret the data and apply it in real-time trading scenarios.
Understanding the Convergence Color Codes
Gray: represent periods of the markets lack of convergence, where neither buyers nor sellers have a decisive advantage. These conditions may indicate market indecision or a potential reversal point. The gray bars can also suggest a period of consolidation before a significant move.
Green: this indicates that buying pressure is greater than selling pressure, suggesting a bullish market condition. This is typically seen when the market may be trending upwards or when buyers are gaining control.
Red: signifies that selling pressure exceeds buying pressure, indicating a bearish market condition. This can be a signal that the market is trending downwards or that sellers are dominating the market.
Understanding Flow Crossovers
Green Dots: correspond to crossovers where the buying pressure (from the TICK) crosses above the selling pressure. This crossover often signals a potential upward move or a bullish market opportunity.
Red Dots: indicate a crossover where the selling pressure (from the TICK) crosses above the buying pressure. This crossover typically suggests a potential downward move or a bearish market signal.
🟪 Usage Examples
If the selling flow is consistently over buying and convergence is red, it indicates a strong and sustained bearish trend. This points to a potential downward move, with sellers predominantly in control.
When the buying flow is consistently over selling and convergence is green, it indicates a strong and sustained bullish trend. This can lead to a potential upward move, with buyers predominantly in control.
No convergence can mean it's time to be cautious. This could be a sign of market indecision, and it's often wise to wait for confirmation. This can lead to sideways market conditions or inverse of the current dominant flow.
🟪 Settings
This indicator does not require any user inputs as it automatically calculates the necessary data based on the ticker's price and volume information. It’s ready to use immediately upon application to any chart.
🟪 Limitations
This indicator is only works during the New York session of trading. It's flow values will not function outside of that trading session.
🟪 Conclusion
We believe in providing user-friendly tools to help speed up traders technical analysis and implement easy trading strategies. The "Market Flow with Convergence" offers a unique way to gauge prevailing market conditions, with simple visual cues for identifying trends.
🟪 Risk Disclaimer
All content, tools, scripts & education provided, are for informational & educational purposes only. Trading is risk and most lose their money, past performance does not guarantee future results.
