Bar CountCount K bars based on sessions
Support at most 3 sessions
Customize the session's timezone and period
Set steps between each number
Use with the built-in Trading Session indicator is a great convenience
Corak carta

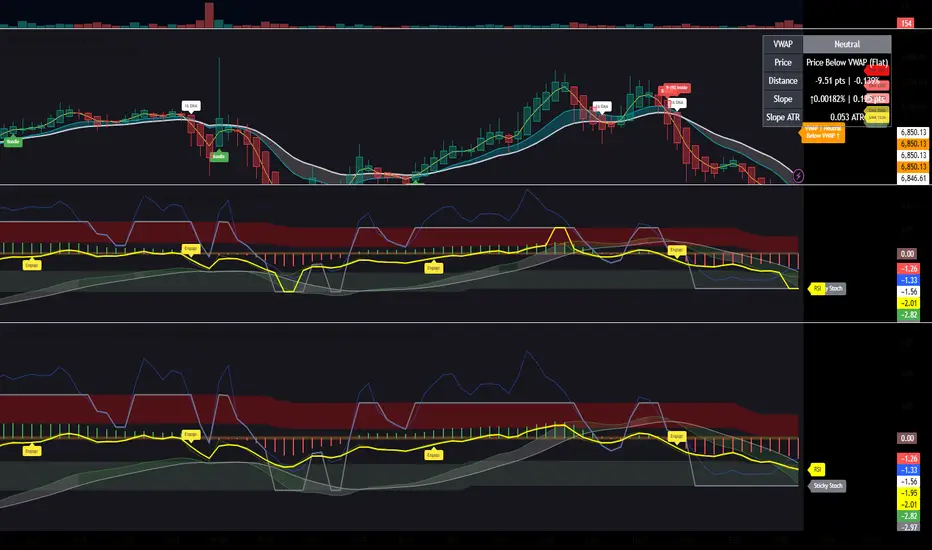
MASTER MACD'S Plus2nd Indicator- Description to come later... Invite only Go to the indicator then invite only. Click invite only and it should show up under my scripts. Save as a favorite and in settings click checkboxes Enable Ghost MacD MOdule, Show Histograms, Show Zero Line, Show Adaptive Zero Buff, Show engage Labels, Show RSI Zones, , and Smooth RSI. I will provide a better description later.
ZigZag Strict + Filtered DivergenceThis is not a traditional ZigZag. This script implements an advanced State Machine designed to filter market noise and identify only the most significant price swings (Major Turning Points) .
The core strength lies in its Strict AND Confirmation logic: a new swing is confirmed only when two conditions are met simultaneously: sufficient Price Deviation (e.g., 0.4%) AND sufficient Time/Bar Count (e.g., 5 bars) . This ensures the indicator is Non-Repainting and highly reliable.
Divergences (Regular and Hidden) are calculated exclusively between these Confirmed and Frozen extreme points, providing high-probability reversal and continuation signals, free from the noise of minor price fluctuations. Use this tool to visualize true market structure and execute precision trades based on validated momentum shifts.

ZigZag Strict & Smart DivergenceThis is not a traditional ZigZag. This script implements an advanced State Machine designed to filter market noise and identify only the most significant price swings (Major Turning Points) .
The core strength lies in its Strict AND Confirmation logic: a new swing is confirmed only when two conditions are met simultaneously: sufficient Price Deviation (e.g., 0.4%) AND sufficient Time/Bar Count (e.g., 5 bars) . This ensures the indicator is Non-Repainting and highly reliable.
Divergences (Regular and Hidden) are calculated exclusively between these Confirmed and Frozen extreme points, providing high-probability reversal and continuation signals, free from the noise of minor price fluctuations. Use this tool to visualize true market structure and execute precision trades based on validated momentum shifts.

QQQ/ES Overlay on NQQQQ/ES Overlay on NQ
This indicator overlays QQQ or ES price levels onto your NQ chart, dynamically mapping reference levels from your chosen symbol to equivalent NQ prices. Perfect for tracking correlations between Nasdaq futures and related instruments.
Key Features
Dual Symbol Support - Toggle between QQQ and ES with a dropdown. Each symbol uses optimized defaults: QQQ shows every 1 point, ES shows every 5 points.
Pre-Market Ready - Extended session support starting at 4:00 AM ET captures pre-market movement. By 9:00 AM, levels accurately reflect overnight action.
Smart Level Mapping - Calculates real-time ratio between NQ and your overlay symbol, then maps round price levels (like QQQ 614 or ES 5985) to equivalent NQ prices.
Anti-Jitter Technology - Stability threshold prevents lines from shaking on minor movements while maintaining accuracy.
How It Works
The indicator fetches live prices from both QQQ and ES, calculates the dynamic ratio to NQ, and displays mapped reference levels. For example, if NQ trades at 21,500 and QQQ at 614, the ratio is approximately 35.016. This means QQQ 615 maps to roughly 21,535 on your NQ chart.
Customization
Choose overlay source (QQQ or ES)
Adjust level increments independently for each symbol
Set number of levels above/below price
Customize line style, width, and color
Control label appearance and position
Fine-tune update sensitivity
Use Cases
Track market correlations in real-time, identify divergences between instruments, trade off psychological round numbers from correlated markets, monitor pre-market relationships, and maintain consistent reference levels across timeframes.
Settings
Default configuration shows 20 levels above and below current price with white lines at 40% opacity. QQQ uses 1-point increments, ES uses 5-point increments. Labels appear 8 bars to the right with dashed lines. Minimum 0.5-point move required to update positions.
Technical Notes
Designed specifically for NQ charts. Uses extended session data (4:00 AM - 8:00 PM ET) for live calculations. Outside trading hours, maintains ratio from previous close. Real-time updates depend on active data feed for all symbols.

The Strat Candle Types (1 / 2U / 2D / 3)This script uses TheStrat candle numbers 1, 2D, 2U, 3 and places the text below or above. You can also change the text size. This also allows you to change the colors of the candles with two options for the 1 & 3 so you can color them in the direction they are going. For example a 1 that is green can be green and a 1 that is red can be red.

Scalping Signals with MTF Fibo BandsThis indicator is a scalping / intraday signal system built on Multi-Timeframe (MTF) Fibonacci Bands, combined with an RSI midline filter and an optional direction-lock mechanism to reduce consecutive losing entries.
🔹 What does this indicator do?
It plots two independent Fibonacci Band sets (A & B), each calculated from a higher timeframe SMA + ATR.
Entry zones are defined between Band 2 and Band 3, representing statistically extreme price areas.
You can choose to generate signals from:
Band A only
Band B only
BOTH (A + B confirmation)
📈 Entry Logic
LONG
Price closes inside the Lower Zone (between Fib2 Lower & Fib3 Lower)
RSI is above the midline (default 50)
SHORT
Price closes inside the Upper Zone (between Fib2 Upper & Fib3 Upper)
RSI is below the midline (default 50)
🟧 Direction Lock System
If enabled, the indicator locks the trade direction when a position hits Stop Loss before reaching TP1.
This prevents repeated entries in the same direction during unfavorable conditions.
🔓 Unlock Logic
The lock can be removed when:
RSI crosses back over the midline (RSI > 50 for LONG, RSI < 50 for SHORT)
AND price closes again inside the valid Band 2–3 zone
With the optional setting enabled, a new entry can occur on the same candle
🛑 Stop Loss Logic (Important)
This indicator uses price-action-based stop logic, not fixed pip stops.
1️⃣ Before TP1
LONG: Two consecutive candle closes below Fib3 Lower
SHORT: Two consecutive candle closes above Fib3 Upper
⚠️ Because SL depends on candle closes, you must monitor lower timeframes (1m or below) to react quickly and avoid delayed exits.
2️⃣ After TP1 (Break-Even Protection)
Once TP1 is touched:
SL automatically shifts to Break-Even (entry price)
Any return to entry will close the position
⚠️ Usage Warning
This indicator is NOT designed for sharp, explosive, or news-driven moves
Avoid using it during:
High-impact news
Extremely fast impulsive candles
Sudden volatility spikes
Best performance is achieved in structured price action environments, not chaotic market conditions.

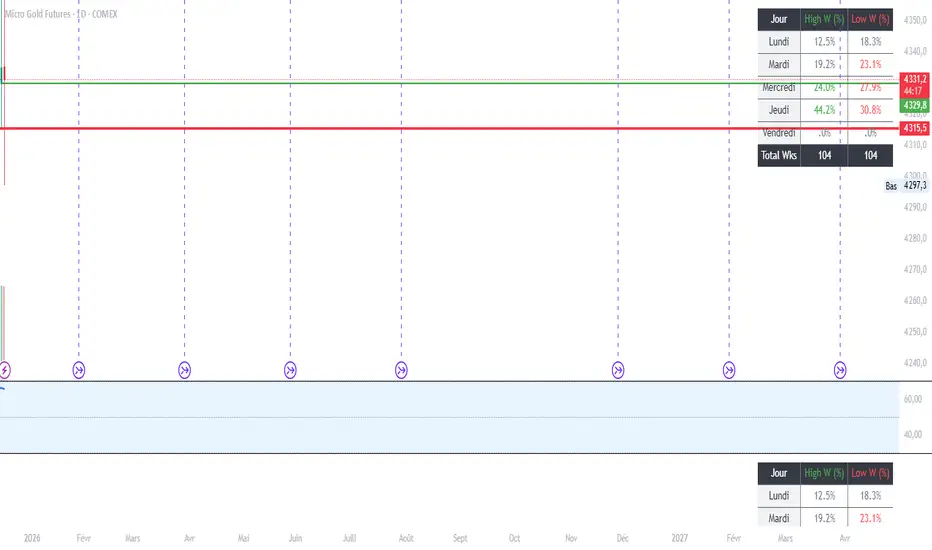
MGC1! - Stats jour du Weekly High/Low Lun VenIndicator Name: Weekly High/Low Day Statistics (Probability Dashboard)
Description:
This indicator provides a statistical edge by analyzing historical price action to determine which day of the week is most likely to form the Weekly High or the Weekly Low.
Designed for intraday traders and swing traders, this tool helps you anticipate the structure of the weekly candle. By understanding the probabilities of when the extremums (HOD/LOD of the week) usually occur, you can better align your trade setups with the true weekly expansion.
Key Features:
Historical Analysis: Calculates statistics based on a user-defined lookback period (default is 104 weeks / 2 years) to ensure statistical significance.
Probability Dashboard: Displays a clean table on the chart showing the percentage chance for each day (Monday to Friday) to be the High or Low of the week.
Rolling Window: Automatically updates data at the close of every week to keep probabilities current.
How to Use (ICT/SMC Context):
Weekly Profiles: Use this data to validate "Classic Tuesday Low" or "Wednesday/Thursday Reversal" profiles.
Bias Confirmation: If the statistics show a 40% chance of the Weekly Low forming on a Tuesday, and price is diving into a Higher Timeframe POI on Tuesday morning, this adds high-probability confluence to your long setups.
Targeting: If the Weekly High typically forms on Thursday and it is currently Wednesday, you can hold runners for an expansion into the next day.
Trend SignalSystem Trend Signal — What It Does
Shows you when your trading system says "be long" vs "stay out" — with a trailing line and buy/sell labels only when the state flips.
The Rules Built In:
BUY state requires ALL of these:
Price above 50-DMA (intermediate trend up)
10-DMA above 20-DMA (short-term trend confirmed)
Sell/Buy Pressure Ratio below 1.5 AND flattening or falling (sellers not aggressive)
RSI above 30 and not making lower lows (momentum OK)
SELL state triggers on ANY of these :
Price drops below 50-DMA (trend broken)
Pressure Ratio spikes above 2.0 (heavy selling)
RSI making lower lows AND below 40 (momentum failing)
What You See:
"Buy" label appears only when state flips from sell → buy
"Sell" label appears only when state flips from buy → sell
No spam. One label per flip.
The Trailing Line:
Uses ATR to set distance from price.
In buy state: line = close - (ATR × 2.0), ratchets up only
In sell state: line = close + (ATR × 2.0), ratchets down only

EMA/SMA Full color signal candles💡 What It Does:
The indicator calculates and plots the 21-period Exponential Moving Average (EMA) and the 30-period Simple Moving Average (SMA). It then analyzes the closing price of each candle and colors the entire candlestick (body and border) according to pre-defined trend conditions.
This visualization allows traders to identify strong trend environments versus periods of consolidation or indecision at a glance, removing the need to constantly check the price relationship manually.
🎨 Color Conditions and Meaning:
The indicator uses three distinct color states to signal the market's current momentum:
Color,Condition,Market Interpretation
🟢 GREEN,Closing Price is ABOVE both the 21 EMA AND the 30 SMA.,Strong Bullish Trend: Suggests high momentum and confirmation of an uptrend. Ideal for long bias.
🔴 RED,Closing Price is BELOW both the 21 EMA AND the 30 SMA.,Strong Bearish Trend: Suggests high downward pressure and confirmation of a downtrend. Ideal for short bias.
⚫ GRAY,"Closing Price is in any other state (e.g., between the two MAs, or under one and over the other).","Neutral / Consolidation: Indicates uncertainty, low momentum, or potential trend exhaustion/reversal. Caution is advised."
🔧 Customization Options:The indicator is fully customizable, allowing users to fine-tune the periods to match their preferred trading style (e.g., scalping, swing trading).Dĺžka EMA (Length EMA): Allows you to change the period for the Exponential Moving Average (default is 21).Dĺžka SMA (Length SMA): Allows you to change the period for the Simple Moving Average (default is 30).
I added also Extra 4 EMA lines to have extra edge.
Highlighted Range (3 Sessions)3 session customizable range. All one color customizable for simplicity.

Intermarket SSMT Table [Pogiest]General
Intermarket Sequential Smart Money Technique (IMSSMT) is a Quarterly Theory concept that identifies divergences (extreme highs/lows) when comparing different market triads to another market triad in two consecutive quarters.
SSMT involves identifying divergences in a correlated asset triad that occurs consecutively from the previous quarter to the current quarter to predict new phases of price, a shift in market sentiment, and also potential trend reversals. An SSMT divergence occurs when one or two assets makes a new high or low, but the other asset or assets does not, signaling a potential shift in market direction. A Hidden SSMT Divergence occurs when one or two assets’ closing price closes higher or lower than the other one or two assets’ closing price. However, with potential gaps in price, an opening price can also be the extreme when comparing assets for divergences. Hidden SSMT divergence compares the candle bodies while a Standard SSMT divergence compares the highs and lows. Both types of SSMTs are considered to be cracks in correlation and can be used to identify potential new phases of price whether it be a reversal, retracement, consolidation, and continuation.
Credit of concepts/ideas: ICT & TraderDaye
What Makes This Indicator Unique
The indicator table is designed to be used on any symbol the trader is viewing. For example, the indicator is shown on an NQ chart while selecting three symbols in the Forex triad in settings. The indicator will request the separate data from the symbols selected and display the data within the table. The table does not rely on data on the chart being viewed. Instead of switching charts, the table is used to track other market triads for SSMTs (standard & hidden) while viewing other markets simultaneously.
The indicator has the ability to display Standard SSMTs, Hidden SSMTs, or both simultaneously in real-time, tick by tick in the time period selected in a correlated asset triad within the table. Toggle modes for each type of SSMT will run independently (runs when enabled) and therefore, optimizes performance. The user is able to select three different tickers in settings instead of limiting to pairs. In addition, the indicator has “Invert” toggle options to track both Standard and Hidden SSMTs for assets with negative correlations.
How the Indicator Table Works
The indicator functions to track any divergences from the previous quarter to the current quarter. In addition, the indicator tracks the current status even when there are no divergences (see phase column below).
Timeframe Column:
1. Displays up to two different timeframes to monitor.
Asset Columns:
1. Display up to three different assets to monitor.
2. Cells display “Bull” in green background color or “Bear” in red background color showing the current state of each candle and updates in real-time tick by tick.
Phase Column:
Displays the current status from the previous quarter to the current quarter. The status updates in real-time tick by tick.
1. “F/S” indicates there are no current SSMT divergences between the previous quarter to the current quarter and all assets have not swept the previous quarter, a “failure swing”.
2. “HH” is displayed when all assets have swept the previous quarter’s extreme high. (Higher High)
3. “LL” is displayed when all assets have swept the previous quarter’s extreme low. (Lower Low) See screenshot with drawings below.
4. SSMT indicates there is an SSMT from the previous quarter to the current quarter. Red background is a bearish SSMT (divergence at the highs) or green background is a bullish SSMT (divergence at the lows). If the SSMT becomes invalid (i.e. the last asset sweeps the extreme high/low), then the table will update to display either “HH” or “LL” depending on the extreme it swept. See screenshot with drawings below.
5. “Both” indicates there are SSMT divergences at both the extremes highs and lows. If an SSMT on one side gets deleted, then the cell will automatically update to display the SSMT that is still intact. See screenshot with drawings below.
Invert Toggle Option:
When this setting is turned on, the asset column cells will display the inverted color of the live chart to show assets are in-sync. It will track the inverted swing points for SSMTs, higher highs, lower lows, etc. For example, if EUR and GBP are making lower highs, while DXY (Inverted toggle on), makes a lower low on the actual live chart, it will display “SSMT”.
NOTE:
Scanning function per timeframe to detect SSMTs:
Weekly HTF: Scans 4HR bars
Daily HTF: Scans 1HR bars
6HR/4HR HTF: Scans 15m bars
1HR HTF: Scans 5m bars
5m HTF: Scans 1m bars
The script has fixed lookback periods for bars to ensure the appropriate data is being captured. The higher the timeframe the user selects in settings while viewing on an extremely lower timeframe, the indicator may give inaccurate readings:
Recommended Chart Timeframes:
For best performance and accuracy, view your chart on a timeframe close to or lower than the scan timeframe:
Weekly HTF → View on 1H-4H chart
Daily HTF → View on 1H-4H chart
6HR/4HR HTF → View on 5m-15m chart
90M HTF → View on 3m-15m chart
1H HTF → View on 1m-15m chart
The indicator will attempt to scan further back if needed, but extremely low chart timeframes (e.g., 1m) with high HTF (e.g., Weekly) may still have limitations.
In addition, the indicator bases the SSMT off the previous quarter’s time range to the current quarter’s time range. If there are discrepancies in the time ranges (start to end of higher timeframe period selected), the SSMTs may display differently than what is viewed on the chart. For example, indices open at 18:00 est on a new trading day, so the time ranges matches throughout the day. However, in Forex, EUR and GBP opens at 17:00 est while DXY opens later, so the time ranges may be off (i.e. 6 hour timeframe). For best use, select time periods that matches throughout the day.
Usage
Traders can use both types of SSMT divergences to anticipate potential reversals in points of interest such as higher timeframe swing points, supply/demand zones, higher timeframe imbalances, key levels, etc. This indicator can also be beneficial in identifying cracks in correlation via Hidden SSMT when there are no divergences off the highs and lows. Divergences can come in different forms relating to Intermarket SSMT. For example, if one market triad is all making lower lows while the other market triad is making higher highs, this can be deemed a divergence between the two markets. Another example would be one market triad all makes lower lows while another market triad makes a bullish SSMT. This can potentially signal a bullish move up. SSMT divergences (standard and hidden) can be used as a confirmation tool with other confluences to identify trend direction with respect to points of interest, higher timeframe order-flow, lower timeframe order-flow, etc. In addition, having both a Standard SSMT and Hidden SSMT divergence display could potentially signal a reversal. It is up to the trader to gauge the price action at the time.
Settings
1. Choose up to three different assets to monitor.
Note: If only two are selected, the indicator will only display the two selected and compare the two assets for divergences. If one is selected, a warning sign will be displayed to select at least two assets.
2. Choose up to two different timeframes. Option to deselect timeframes.
3. Enable/disable standard or hidden SSMT.
4. Option to enable alerts. Alerts include the different phases in the table (i.e. SSMT, HH, LL, and Dual SSMT [both standard & hidden) for each timeframe.
5. Toggle option to show/hide the table. Toggle option to show/hide the “Title Row” which is the first row at the top of the table.
6. Adjust the table positioning to be displayed on the chart.
7. Option to change text size in the table cells. This will also increase/decrease the size of the table.
Risk Disclaimer
This indicator is for educational and informational purposes only and does not constitute financial advice. All trading and investment decisions remain solely the responsibility of the user.
Trading involves a high degree of risk, and past performance is not indicative of future results.
Always conduct your own research and consult with a qualified financial professional before making any trading decisions.
By using this indicator, users acknowledge they understand these risks and accept full responsibility for their trading decisions and outcomes.

Advanced Demand ZoneThis indicator automatically identifies strong demand zones based on swing lows followed by significant bullish reactions. It is designed for 4H timeframe and crypto trading (BTC, ETH, altcoins).
Key Features:
Automatically draws clear demand zones for better visual analysis.
Filters out weak impulses to reduce false zones.
Sends alerts when price enters a demand zone.
Transparent zones that do not clutter your chart.
Fully customizable parameters: swing lookback, impulse threshold, and zone transparency.
This tool helps traders quickly spot high-probability buy areas while allowing manual confirmation with price action, making it perfect for swing and intraday trading.

AI-based Price action confluence dashboard# **AI-Based Price Action Confluence Dashboard - Publication Guide**
Here's a comprehensive introduction guide for your TradingView indicator publication:
***
## **📊 TITLE**
**AI-Based Price Action Confluence Dashboard**
***
## **🎯 SHORT DESCRIPTION** (For the summary field)
A sophisticated real-time confluence scoring system that analyzes multiple price action signals across 15-minute timeframes, providing traders with an AI-weighted scoring mechanism (0-6 scale) to identify high-probability trade setups through visual signal panels and intelligent path detection.
***
## **📝 FULL DESCRIPTION**
### **Overview**
The AI-Based Price Action Confluence Dashboard is an advanced technical indicator designed to eliminate guesswork in intraday trading by systematically scoring and displaying multiple price action signals in real-time. Unlike traditional single-indicator approaches, this dashboard employs a confluence methodology that combines multiple independent signals to provide stronger trade confirmations and reduce false signals.
This indicator is specifically optimized for **1-minute chart analysis** while monitoring **15-minute price structure**, making it ideal for day traders and scalpers who need precise entry timing with larger timeframe context.
***
### **🔑 Key Features**
**✅ Real-Time AI Confluence Scoring**
- Dynamic scoring system (0-6 points) for both bullish and bearish setups
- Visual meter display shows signal strength at a glance
- Color-coded backgrounds indicate confluence levels (strong, moderate, mixed)
**✅ Multi-Signal Analysis**
The dashboard tracks 6 distinct signal types:
1. **FTFC (First to Finish Close)** - Base & Bonus signals
2. **Long/Short Grab** - Liquidity sweep patterns (Path A)
3. **High/Low Hold** - Extended momentum confirmation (+2 bonus)
4. **2-Up/2-Down** - Clean breakout patterns (Path B)
5. **Breakaway** - First candle gap strategies
**✅ Intelligent Path Detection**
- Mutually exclusive path logic prevents signal conflicts
- Automatically identifies whether price is following a "sweep path" or "clean path"
- Unavailable paths are clearly marked with gray indicators
**✅ Visual Signal Panels**
- 🟢 Green Light = Bullish signal ACTIVE
- 🔴 Red Light = Bearish signal ACTIVE
- 🟡 Yellow Light = Signal BUILDING (conditions partially met)
- ⚪ White Light = Signal OFF
- ▪️ Gray Square = Path UNAVAILABLE (mutually exclusive)
**✅ Comprehensive Alert System**
- 10 different alert conditions covering all major signals
- Strong confluence alerts (5+ points)
- Individual signal completion alerts
- Customizable alert messages
***
### **📐 How It Works**
#### **The Confluence Methodology**
This indicator implements a sophisticated confluence trading approach where multiple independent price action signals are combined to identify high-probability setups. Each signal type contributes points to either the bullish or bearish score, with a maximum of 6 points per direction.
**Scoring Breakdown:**
**BULLISH SIGNALS:**
- FTFC Base (15m close > previous 15m close) = +1
- FTFC Bonus (price clears 15th candle high) = +1
- **PATH A (Sweep):** Long Grab = +1, High Hold Bonus = +2
- **PATH B (Clean):** 2-Up = +1, 2-Up Bonus = +1
- Breakaway (gap above first candle) = +1
**BEARISH SIGNALS:**
- FTFC Base (15m close < previous 15m close) = +1
- FTFC Bonus (price clears 15th candle low) = +1
- **PATH A (Sweep):** Short Grab = +1, Low Hold Bonus = +2
- **PATH B (Clean):** 2-Down = +1, 2-Down Bonus = +1
- Breakaway (gap below first candle) = +1
#### **Path Detection Logic**
The indicator automatically determines which path the market is following:
**PATH A: SWEEP PATH**
- Activated when previous 15m low (bull) or high (bear) is breached
- Indicates liquidity grab before reversal
- Includes powerful +2 bonus for "Hold" confirmations
- Mutually exclusive with Path B
**PATH B: CLEAN PATH**
- Activated when previous 15m low (bull) or high (bear) holds
- Indicates strong directional momentum without sweep
- Cleaner price action but smaller point potential
- Mutually exclusive with Path A
This mutual exclusivity prevents double-counting and ensures signal accuracy.
***
### **🎨 How to Use**
#### **Installation**
1. Add indicator to your 1-minute chart
2. The dashboard appears as a table overlay (default: top right)
3. No additional indicators required - this is a complete system
#### **Reading the Dashboard**
**Top Section - Confluence Meter:**
- Shows current bull/bear scores with visual dot meters
- Background color changes based on confluence strength:
- **Bright Green/Red** = 5+ points (strong directional bias)
- **Medium Green/Red** = 3+ points (moderate bias)
- **Orange** = 3+ points both sides (conflicting signals)
- **Gray** = Low confluence (choppy conditions)
**Signal Panels Section:**
- Each row shows a signal type with bull/bear lights side-by-side
- Active signals (🟢🔴) contribute to the total score
- Building signals (🟡) indicate potential setups forming
- Unavailable paths (▪️) show which exclusive path is blocked
#### **Trading Strategy**
**High-Probability Long Entries:**
- Bull score ≥ 5 AND bear score ≤ 1
- Multiple green lights active in signal panels
- PATH A or PATH B showing full completion
- Consider entry on pullback to key 15m level
**High-Probability Short Entries:**
- Bear score ≥ 5 AND bull score ≤ 1
- Multiple red lights active in signal panels
- PATH A or PATH B showing full completion
- Consider entry on rally to key 15m level
**Avoid Trading When:**
- Both scores are 3+ (conflicting signals)
- No path is showing active/building status
- Score is below 3 on both sides (low confluence)
#### **Risk Management**
- Use 15m swing high/low for stop placement
- Target opposing 15m level or previous session extremes
- Scale out at partial targets when confluence decreases
- Best results when combined with proper position sizing
***
### **⚙️ Customization**
**Dashboard Settings:**
- **Table Location:** Top Left, Top Right, Bottom Left, Bottom Right
- **Text Size:** Tiny, Small, Normal, Large
**Color Scheme:**
- **Bullish Color:** Customize green for bull signals (default: #00cc66)
- **Bearish Color:** Customize red for bear signals (default: #ff4444)
- **Building Color:** Customize yellow for forming signals (default: #ffaa00)
- **Inactive Color:** Customize gray for off signals (default: #555555)
- **Unavailable Color:** Customize dark gray for blocked paths (default: #333333)
All colors can be adjusted to match your chart theme or visual preferences.
***
### **🎯 Best Practices**
1. **Use on 1-minute charts only** - The indicator is calibrated for this timeframe
2. **Trade during liquid sessions** - Best results during NY/London overlap
3. **Wait for 3+ confluence** - Minimum threshold for trade consideration
4. **Watch path transitions** - Signal strength changes when paths flip
5. **Use alerts strategically** - Set alerts for 5+ confluence to catch strong setups
6. **Combine with volume** - High volume confirms signal validity
7. **Respect 15m structure** - Don't fight the larger timeframe bias
***
### **⚠️ Important Notes**
- This indicator is designed for **intraday trading only**
- Requires active monitoring during trading sessions
- Works best on liquid instruments (major forex pairs, indices, large-cap stocks)
- Not suitable for swing trading or position trading
- Past performance does not guarantee future results
- Always use proper risk management and position sizing
***
### **🏷️ Category**
**Oscillators** or **Volatility** (choose based on TradingView categories)
***
### **🏷️ Suggested Tags**
- confluence
- price action
- day trading
- scalping
- intraday
- signals
- dashboard
- multi-timeframe
- 1-minute
- 15-minute
***
### **📜 Disclaimer**
This indicator is a tool for technical analysis and should not be used as the sole basis for trading decisions. All trading involves risk, and you should never risk more than you can afford to lose. The developer assumes no responsibility for trading losses incurred through the use of this indicator. Always practice proper risk management and consider your own risk tolerance before trading.

BTC - VDD Multiple (Approx)Overview & Philosophy
⚠️ Note: This indicator is optimized for the Daily (1D) Timeframe. Please switch your chart to 1D for accurate signal reading.
The BTC – VDD Multiple (Approx) is an advanced oscillator designed to identify market overheating and cycle tops by analyzing the velocity of value moving through the market.
In traditional On-Chain Analysis, Value Days Destroyed (VDD) is a premier metric for spotting macro tops. It multiplies the coin age (how long a coin was held) by the price at which it was moved. When old coins (HODLer money) move at high prices, VDD spikes, signaling massive profit-taking.
The Problem: Real "Coin Days Destroyed" (CDD) data is typically locked behind institutional paywalls or unavailable on standard TradingView plans.
The Solution: This script calculates a Deterministic Proxy. By analyzing the relationship between Exchange Volume, Price, and a Dormancy Constant, we can approximate the structure of the VDD Multiple without needing a premium data feed.
Methodology
The VDD Multiple works by comparing short-term market velocity against a long-term baseline.
1. The Proxy Calculation
Since we cannot directly access the age of coins on TradingView, we model the economic weight of the move:
Proxy Value = Exchange Volume * Price * Dormancy Factor
This creates a synthetic representation of "Value Throughput."
2. The Multiple
We compare the immediate heat of the market against the yearly trend:
• Short-Term MA (2 Days): Captures flash spikes and sudden liquidity exit events.
• Long-Term MA (365 Days): Represents the baseline "hum" of network activity.
VDD Multiple = Short Term MA / Long Term MA
How to Read the Chart
The indicator plots the Multiple as a line and uses background highlighting to signal extreme regimes.
🔴 The Red Zone (Overheated > 2.9)
Meaning: Current value transfer is ~3x higher than the yearly average.
Interpretation: Historically, sharp spikes into the Red Zone correlate with Local or Cycle Tops. This indicates that massive volume is changing hands at high prices—typically a sign of "Smart Money" distributing into "Dumb Money" FOMO.
Note: In strong bull runs, price can push higher even after a VDD spike, but the risk/reward ratio is extremely poor here.
🟢 The Green Zone (Undervalued < 0.75)
Meaning: Market activity is quiet and below the yearly baseline.
Interpretation: These are periods of apathy or accumulation. Historically, extended time spent in the Green Zone (the "flatline") has offered the best asymmetric buying opportunities.
🟠 The Orange Line (Neutral)
Meaning: The market is in transition or equilibrium.
Strategy & Context
This indicator is best used as a Macro Cycle Tool, not a day-trading signal.
• Exit Strategy: Look for "Clusters" of Red Spikes. A single spike often marks a local correction, but a cluster of intense spikes while price makes new highs (Divergence) is a strong Cycle Top warning.
• Entry Strategy: Historically the best entries occur when the indicator flattens out in the Green Zone for weeks or months. This suggests sellers are exhausted and the market has reached a floor.
Credits
This script is an approximation of the original VDD Multiple concept. Full credit for the underlying on-chain theory goes to the pioneers of this metric:
• Concept: The original Value Days Destroyed metric was popularized by Hans Hauge and Glassnode.
• The Multiple: The specific application of a Short/Long MA Multiple on VDD is widely attributed to analysts like TXMC and Bitbo.
This script adapts these concepts for the free TradingView environment using exchange volume proxies.
Settings
• Data Source: Defaults to BINANCE:BTCUSDT to capture high-volume liquidity.
• Short MA: Default is 2 Days to capture rapid velocity spikes.
• Long MA: Default is 365 Days to track the annual trend.
Disclaimer
This tool is an approximation based on exchange volume, not raw blockchain data. While exchange volume and on-chain volume are highly correlated during cycle extremes, they are not identical. This script is for educational and research purposes only. Past performance does not guarantee future results.
Tags
bitcoin, btc, onchain, vdd, cdd, valuation, cycle, top, bottom, Rob Maths

BoS/CHoCH + FakeoutRMI • BoS / CHoCH + Fakeout Detector
This indicator identifies true market structure breaks based on Break of Structure (BoS) and Change of Character (CHoCH), combined with a precise Fakeout / Liquidity Sweep detector to filter false breakouts.
The logic is built on Smart Money Concepts (SMC) and ICT market structure, using close-confirmation only instead of wick-based signals.
Key Features
BoS & CHoCH Detection (Major Structure)
– Clear distinction between trend continuation (BoS) and trend reversal (CHoCH)
– Bullish and bearish structures are visually separated by color
Fakeout / Liquidity Sweep Detection
– Detects wick sweeps above highs and below lows
– Fakeouts are automatically removed once a valid structure break occurs
– No overlap between Fakeouts and BoS / CHoCH
Close-Only Confirmation (Institutional Logic)
– Structure is considered broken only after candle close
– Reduces noise and false signals caused by stop hunts
Split-Line Design (Clean Chart)
– Structure lines with centered text gap
– Extremely clean and readable, even on lower timeframes
Potential Next Break (Optional)
– Displays potential next major highs and lows
– Ideal for liquidity targeting and trade planning
Why This Indicator?
This tool is designed for traders who:
want non-repainting structure logic
focus on price action & market structure, not lagging indicators
need a clear distinction between fakeouts and real breaks
trade using SMC / ICT concepts
Perfect for scalping, day trading, and swing trading across Forex, Indices, Crypto, and Commodities.
Disclaimer
This indicator is an analysis tool, not an automated trading system.
For best results, combine it with Order Blocks, Fair Value Gaps (FVG), Liquidity Pools, and session bias.

AMN Zones The AMN Model Indicator streamlines your trading by:
-Displaying all active AMN 6 tap opportunities directly on the chart.
-Helps you analyze structure and establish bias
-Highlights 50% of the optimal zone for precision entries.
Additionally, it marks setups that haven’t been mitigated and provides real-time alerts whenever a new setup presents itself. Ideal for traders aiming for clarity, consistency, and efficiency in identifying high-probability zones for entries and exits.

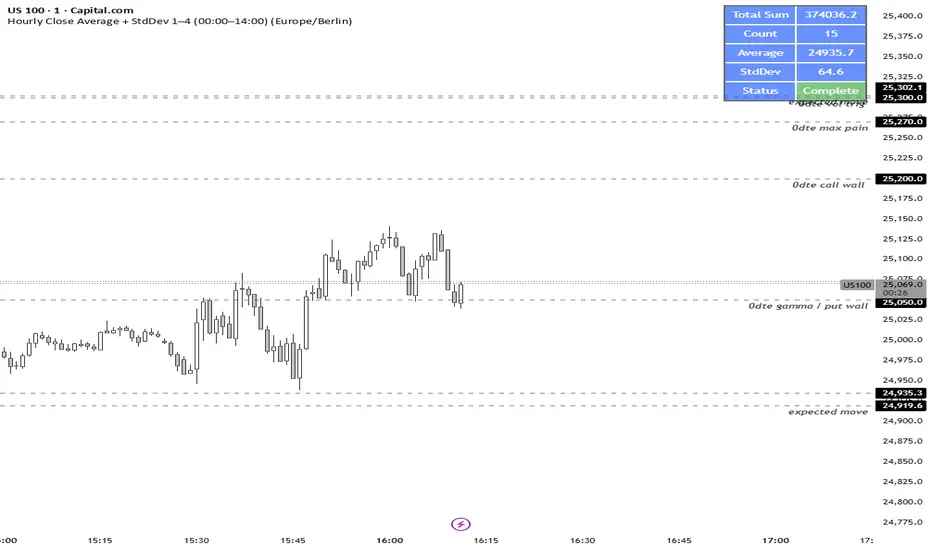
Key Levels: Volume Profile POCProfessional Intraday Key Levels (CST)
This is a comprehensive, institutional-grade Pine Script indicator designed for intraday traders (Futures, Stocks, Options) operating in the Central Time Zone. It automatically plots the most significant support and resistance levels used by algorithms and professional desks.
1. Core Levels Monitored
Daily Levels: Previous Day High (PDH), Low (PDL), Open, Close, and the 50% Midpoint (Equilibrium).
Volume Profile POC: Unlike standard indicators that use a simple average, this calculates the Volume Weighted Average Price (VWAP) of the previous day to determine the true "Fair Value" or Point of Control. Plotted with a thicker, distinct purple line.
Weekly Magnets: Previous Week High (PWH) and Low (PWL), which often act as major targets for breakouts or reversals.
Pre-Market Data: Tracks the High and Low established between 03:00 AM – 08:30 AM CST.
Opening Range (OR): Automatically captures the High and Low of the first 60 minutes of the regular session (08:30 AM – 09:30 AM CST).
2. Smart Visualization Features
Anti-Overlap Labels: If two levels (e.g., Pre-Market High and Previous Day High) are within 0.02% of each other, the script automatically merges them into a single label (e.g., "PDH & Pre-Market High") to prevent chart clutter.
Source Tracing: Trace lines extend backward from the current price level to the exact candle where that High or Low was formed (for Pre-Market and Opening Range levels), giving you instant context on when the level was created.
Clean Readability: Labels are displayed in bold, solid text without price numbers, ensuring a clean chart that focuses on level identification rather than data overload.
3. Technical Precision
Time Zone Locked: Hardcoded to America/Chicago to ensure Pre-Market and Opening Range calculations remain accurate regardless of your local computer settings.
Non-Repainting: Daily and Weekly levels are locked using closed-candle data (lookahead_on), ensuring lines do not shift during the trading day.
Buffer Safe: Optimized drawing logic prevents historical buffer errors, even on lower timeframes (1m/5m).
4. Customization
Toggle Everything: Every single level has an individual "Show/Hide" checkbox in the settings.
Label Sizing: Adjustable text size (Tiny to Huge) and offset positioning.
Compact Mode: Option to switch between full names ("Previous Day High") and abbreviations ("PDH").

MTF H4 Double Maru - All Historydouble marubozu level at h4 will appear at lower timeframe, use it wisely , take action after price already near or react with the level


GS Volume Truth Serum (With Alerts)this tells you when institutions are behind a move and its not a bull trap

Premium Volume Divergence Signals [Stansbooth]Advanced Divergence Indicator
This indicator is designed to uncover the hidden relationship between price action and momentum. By accurately detecting when price and momentum move in different directions, it highlights bullish and bearish divergences at critical market points — often before reversals or strong continuations occur.
🔹 Key Features:
Precise detection of Regular and Hidden Divergence
Helps identify early market reversals
Clean, clear, and easy-to-read visual signals
Works across Forex, Crypto, and Stock markets
Suitable for all timeframes and trading styles
This indicator empowers traders to make smarter entries, confident exits, and better risk management decisions. Instead of chasing the market, it allows you to anticipate price movement with confidence.
Trade smarter, not harder — let divergence reveal the real market strength.
