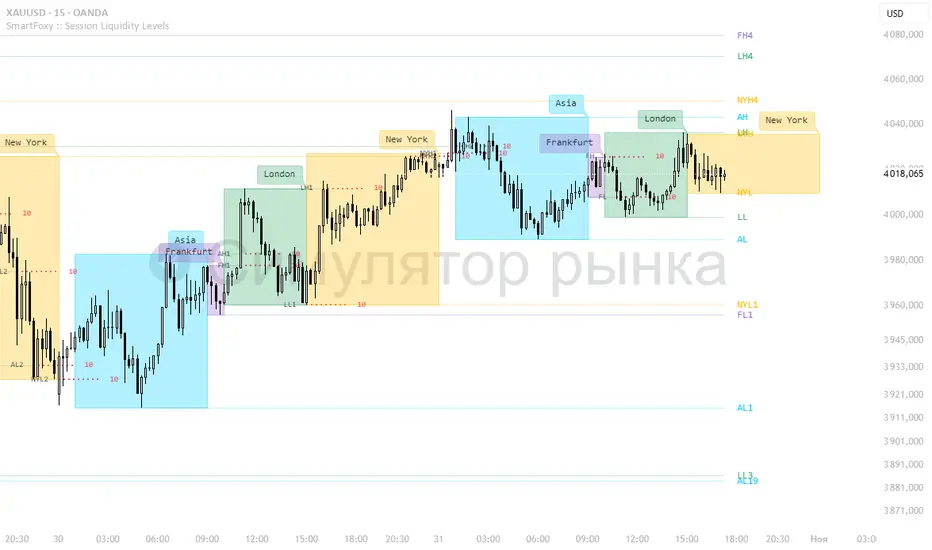
Killzone Session High/Low Levels [SmartFoxy]Killzone Session High/Low Levels
The Killzone Session High/Low Levels indicator by SmartFoxy provides a complete intraday framework for understanding session-based liquidity, market structure rotation, and breakout behavior across global trading sessions.
It automatically plots the High/Low ranges for each selected session, highlights session killzones, and tracks breakout events with optional alerts.
This tool is designed for traders who rely on session dynamics (Asia, Frankfurt, London, New York) to identify liquidity targets, sweep zones, key ranges, and continuation/reversal opportunities.
________________________________________
How It Works
The indicator detects the active trading sessions for each day and builds structural High/Low ranges for them:
• Asia Session Range (High/Low);
• Frankfurt Session Range;
• London Session Range;
• New York Session Range;
• Optional custom session (NY Open, or any killzone).
For each session, the script can display:
• Session box or column;
• High/Low levels;
• Labels for every range (H/L);
• True session boundaries using user-defined timezone;
• Auto-extended levels up to the latest candle;
• Break levels after a breakout;
• Conditional removal or recoloring after a level is breached.
This gives traders a clean visual map of session liquidity and how price interacts with it throughout the day.
________________________________________
Key Features
1. Multiple Global Sessions •➤ Asia, Frankfurt, London, New York, plus one custom session for advanced killzone mapping.
2. Session High/Low Liquidity Levels •➤ Automatic plotting of every session’s High and Low, with optional labels and price markers.
3. Session Boxes or Columns •➤ Two display modes allow traders to visualize the session either as a filled box or a clear vertical column.
4. Breakout Logic & Temporary Levels .
When price breaks a session High/Low:
• Levels can be extended for a selected number of bars
• Or removed instantly after a breakout
• Or recolored to highlight the sweep event
This enables clean identification of liquidity grabs, breakouts, and continuation setups.
5. Alerts for Session Breakouts .
Set alerts when price breaks:
• Any session level
• Only levels formed on the current day
Perfect for traders who want real-time notifications of sweeps or key structure breaks.
6. Full Customization
You can configure:
• Session times;
• Timezone;
• Colors;
• Labels;
• Line styles and widths;
• Breakout behavior;
• Killzone range handling.
Everything is adjustable to match any trading style.
________________________________________
How to Use
1. Enable the sessions you want to track •➤ Asia, Frankfurt, London, New York, or custom.
2. Choose display mode
Box mode for visual range blocks;
Column mode for clean vertical alignment.
3. Enable High/Low Levels .
These act as liquidity magnets and key rejection zones.
4. Turn on Breakout Levels (optional)
Useful for spotting sweeps and continuation setups.
5. Turn on Alerts if you want notifications when price breaks levels.
6. Use session levels as liquidity reference points .
They work exceptionally well with smart money concepts (SMC), ICT, and intraday structure analysis.
________________________________________
Why This Indicator Is Useful
Shows exactly where liquidity is placed each session;
Highlights market structure transitions as sessions hand over control;
Helps identify stop hunts, sweeps, reversals, and continuation patterns;
Provides real-time alerts for structural breaks;
Organizes the chart and reduces noise;
Works with any intraday timeframe and any market.
This makes it valuable for scalpers, day traders, and SMC/ICT-style analysts.
________________________________________
Summary
Killzone Session High/Low Levels delivers a complete, highly customizable intraday mapping system based on global trading sessions.
It clarifies the session structure, reveals liquidity targets, and empowers traders to make confident trading decisions using clean, objective market data.
Daytrading
GB · Set upUp & Confirmation (Lower Pane)The GB Set-Up & Confirmation Indicator transforms raw momentum into a clear, color-coded decision framework for intraday scalping.
It’s the heartbeat monitor of 0DTE trading — revealing when momentum quietly shifts and when it explodes into confirmation.
Milliseconds Ahead: Confirm-on-Prior mode mimics predictive confirmation, letting traders catch reversals before the lag candle.
Noise-Adaptive: Near-zero band filtering reduces false breaks from micro volatility.
Visual Precision: Dual markers and labeled confirmations remove hesitation in execution.
Configurable Latency: Sensitivity presets + fine-tune ensure adaptability from SPX 1-min charts to QQQ 5-min momentum waves.
Platform: Designed for lower-pane deployment beneath the main price chart.
Primary Use: Time-sensitive momentum confirmation for 0DTE SPX/SPY/QQQ scalps.
Typical Workflow:
Wait for Early (Set-Up) triangle near the zero band → signals momentum shift.
Enter on the Confirmed triangle (or one candle prior if using “Confirm on Prior”).
Exit when opposite signal fires or wave color fades (momentum exhaustion).
Complementary Indicators: Pairs seamlessly with GB TMA Overlay, GB ORB Shading, or Phoenix Fire Confluence for full-stack entry validation.
Adaptive Sensitivity Presets
- Aggressive: reacts early to momentum pulses (scalp mode).
- Balanced: optimized for intraday consistency.
- Strict: waits for full trend maturity (swing mode).

FUTURA ORB.o3 Stategy (Gap + Dynamic Risk)ORB Strategy
Includes Mini & Micro Futures
Dynamic Risk based position sizing
Adjustable RR Levels
Gap Detection
Default settings are for NQ & MNQ.
Adjust as needed for different futures.

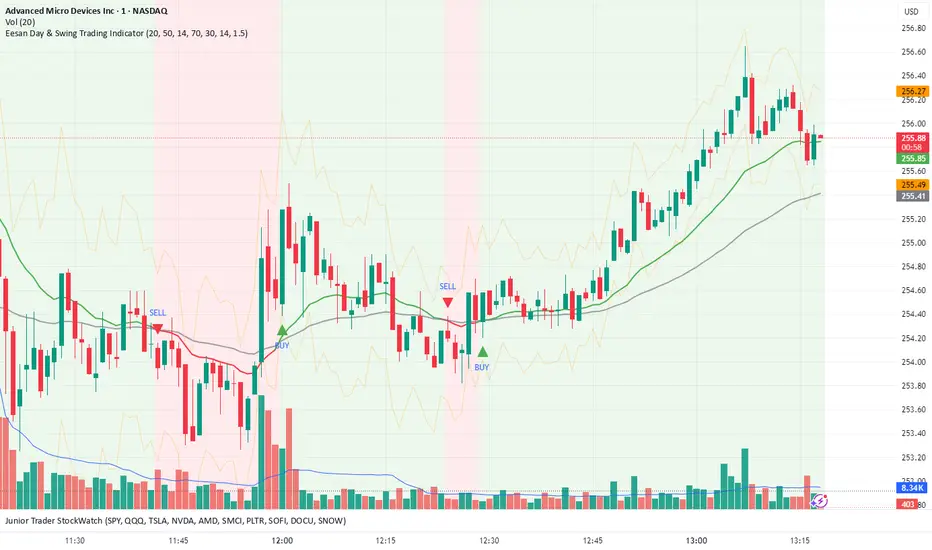
Eesan Day & Swing Trading Indicator🧭 Eesan Day & Swing Trading Indicator
🔍 Overview
The Eesan Day & Swing Trading Indicator is an all-in-one trend, momentum, and volatility tool designed for active traders who want clean, reliable signals for both day trading and swing trading.
It automatically detects buy and sell signals based on moving averages, RSI, and ATR — giving traders clear visual guidance on when to enter or exit trades.
⚙️ How It Works
This indicator combines three powerful concepts:
Trend Detection (EMA Crossovers)
Fast EMA (20) and Slow EMA (50) identify trend direction.
When the Fast EMA crosses above the Slow EMA → BUY Signal
When the Fast EMA crosses below the Slow EMA → SELL Signal
Momentum Confirmation (RSI Filter)
RSI ensures signals align with market momentum.
Avoids chasing overbought or oversold conditions.
Volatility Visualization (ATR Bands)
ATR Bands show potential price expansion zones.
Helps manage risk and visualize support/resistance.
🧠 Signal Logic
BUY → Fast EMA crosses above Slow EMA and RSI is below Overbought (70).
SELL → Fast EMA crosses below Slow EMA and RSI is above Oversold (30).
The background color changes with market trend:
🟩 Green = Bullish Trend
🟥 Red = Bearish Trend
📈 Visual Elements
Green & Red Triangles: Buy and Sell signal markers.
Colored EMAs: Reflect trend direction in real time.
ATR Bands: Show upper and lower price expansion zones.
Background Color: Indicates the dominant market trend.
⚡ Alerts
You’ll get alerts when:
✅ A BUY signal appears → “Eesan Indicator: BUY on @ ”
❌ A SELL signal appears → “Eesan Indicator: SELL on @ ”
Set alerts on the chart using “Condition → Eesan Day & Swing Trading Indicator → Buy Alert / Sell Alert.”
🧩 Best Used For
Intraday and Swing Trading
Stocks, Crypto, Forex, and Indexes
Works on all timeframes (15m, 1H, 4H, 1D recommended)
⚠️ Note
This tool is for educational and analytical purposes only.
Always confirm signals with your trading plan and proper risk management.
👤 Created by
Eesan — blending simplicity, clarity, and precision to empower traders.
MNQ Hybrid Scalper Pro - Advanced NASDAQ Futures Scalping System🎯 Overview
The MNQ Hybrid Scalper Pro is a comprehensive scalping system engineered specifically for NASDAQ futures traders. This indicator implements a modern hybrid approach that combines institutional-grade VWAP analysis with momentum oscillators optimized for the unique volatility characteristics of the NASDAQ market. Developed through extensive research on MNQ/NQ price action patterns, this indicator provides clear, actionable signals while filtering out market noise during high-volatility periods.
✨ Key Features
1. VWAP Foundation
Session-anchored VWAP with automatic reset
Dynamic standard deviation bands (1σ and 2σ)
Color-coded price bars based on VWAP positioning
VWAP test detection with momentum confirmation
2. Optimized Momentum Suite
Fast RSI (7): Aggressive settings (85/15) for quick scalping signals
Scalping MACD (5,13,6): Optimized parameters with SMA option
Quick Stochastic (9,3,3): Tuned for 1-minute chart responsiveness
Divergence Detection: Automated bullish/bearish divergence alerts
3. Multi-Timeframe Trend Filter
Triple EMA system (9, 21, 50) on current and higher timeframes
Trend strength scoring (-3 to +3) for directional bias
Prevents counter-trend trades in strong trending markets
Visual trend alignment indicators
4. Smart Signal Generation
Long Signals: VWAP pullback + RSI oversold + MACD bullish turn + HTF trend alignment
Short Signals: VWAP rally + RSI overbought + MACD bearish turn + HTF trend alignment
Signal cooldown period to prevent overtrading
Session-based filtering for optimal trading windows
5. Risk Management Visualization
Automatic profit target levels (10 & 20 points)
Dynamic stop loss levels (6 & 8 points)
Risk/reward ratio calculation (minimum 1.5:1)
Breakeven level display after 5 points profit
Visual entry, target, and stop lines on chart
6. Session Intelligence
NY opening range highlight (first 30 minutes)
Optimal scalping window shading (9:30-11:30 AM EST)
Major session markers (Asia, Europe, NY)
Session countdown timer
Contract rollover reminders
7. Real-Time Performance Dashboard
Current trend status across timeframes
Signal statistics and win rate tracking
Position relative to VWAP
Momentum indicator status (OB/OS/Neutral)
Volume analysis (relative to 20-period average)
Volatility monitoring with ATR spike detection
8. Professional Alert System
High-probability entry alerts with specific levels
VWAP test notifications with momentum confirmation
Target and stop loss hit alerts
Trend alignment notifications
Comprehensive alert messages with entry, stop, and target prices
📈 How to Use
Optimal Setup:
Timeframe: Best on 1-minute charts (also works on 3-min and 5-min)
Instrument: Optimized for MNQ (Micro E-mini NASDAQ), works with NQ
Session: Most effective during NY session (9:30-11:30 AM EST)
Chart Type: Standard candlestick or bars
Signal Interpretation:
Green Triangle (▲): Long entry signal - all conditions aligned for upward scalp
Red Triangle (▼): Short entry signal - all conditions aligned for downward scalp
DIV Labels: Momentum divergence detected - potential reversal zones
Colored Bars: Green = above VWAP (bullish bias), Red = below VWAP (bearish bias)
Entry Checklist:
Wait for signal arrow to appear
Confirm trend alignment in dashboard (HTF Trend)
Check momentum status isn't extreme
Verify you're within optimal trading window
Enter at market with predetermined stop and target
⚙️ Customization Options
Display Settings:
Toggle individual components on/off
4 color schemes (Professional, Dark, Light, Classic)
Adjustable transparency and visual elements
Dashboard position selection
Signal Settings:
Adjust momentum indicator parameters
Modify risk/reward levels
Configure session filters
Set signal cooldown periods
Advanced Features:
Multi-timeframe period adjustment
Volatility filter sensitivity
Contract type selection (MNQ/NQ)
Alert configuration options
📊 Best Practices
Start in Simulation: Test the indicator in paper trading first
Respect the Trend: Don't fight the higher timeframe trend
Manage Risk: Use the suggested stop losses consistently
Time Your Trades: Focus on the optimal scalping window
Confirm Signals: Best results when multiple confirmations align
⚠️ Important Notes
Supplementary Tool: This indicator supplements but doesn't replace proper market analysis and order flow reading
No Repainting: All signals are confirmed on bar close
Education Required: Understanding of scalping principles recommended
Risk Management: Always use proper position sizing and risk management
Market Conditions: Performance varies with market volatility and conditions
🎓 Educational Value
This indicator serves as an excellent educational tool for:
Learning VWAP-based trading strategies
Understanding momentum indicator optimization
Practicing multi-timeframe analysis
Developing systematic scalping approaches
Risk management visualization
💻 Technical Specifications
Pine Script Version: v6
Calculation Method: Non-repainting, real-time
Performance: Optimized for minimal lag
Compatibility: All TradingView plan levels
Updates: Regularly maintained and improved
🏆 What Makes This Unique
Unlike generic indicators, the MNQ Hybrid Scalper Pro is specifically engineered for NASDAQ futures volatility patterns. It combines institutional trading concepts (VWAP) with retail-friendly visualization and clear signals, bridging the gap between professional and accessible trading tools.
📬 Support & Feedback
Questions, suggestions, or feedback? Leave a comment below or send a private message. Your input helps improve the indicator for the entire community.
CME_MINI:MNQ1!
Disclaimer: This indicator is for educational and informational purposes only. It does not constitute financial advice. Trading futures involves substantial risk of loss and is not suitable for all investors. Past performance is not indicative of future results. Always conduct your own analysis and consult with a qualified financial advisor.

Global M2 Overlay 5 DaysTrading + Offset -AlexBank🌍 This indicator visualizes the Global M2 Money Supply — a combined estimate of the total liquid money circulating in major economies worldwide — directly overlaid on your active chart (for example, XAU/USD).
It allows traders to see how global liquidity evolves in relation to asset prices such as gold, Bitcoin, or equities.
In simple terms, M2 reflects how much liquid capital exists in the global financial system.
When M2 expands, liquidity increases — which can fuel asset price growth.
When M2 contracts, liquidity tightens — often signaling risk-off periods or deflationary pressures.
⚙️ This indicator aggregates national M2 data from multiple economies (United States, Eurozone, China, Japan, UK, etc.), converted to USD equivalents via live FX rates, giving a global view of liquidity trends.
Indicator Features
🧭 Overlay on any chart — plots the global M2 line directly on top of your active asset (e.g. XAU/USD, BTC/USD), allowing direct visual comparison.
⏩ Day offset control — shift the M2 curve forward or backward in time (in real trading days) to test how global liquidity leads or lags asset prices.
Example: shifting +90 days means the M2 data appears 90 trading days later (not calendar days, since weekends are excluded).
📅 5-day trading week logic — automatically converts real days into trading days, ensuring accurate offsets that match market calendars.
📊 Optional moving average — smooths the M2 line to better visualize long-term liquidity trends.
🎚️ Manual scaling (optional) — adjust the height of the M2 curve to visually align it with your charted asset’s price range (does not affect data values).
💡 How to Use
1/ Apply the indicator to your preferred chart (e.g., Gold / XAUUSD).
2/ Adjust the time offset parameter to see how changes in global liquidity precede or follow price movements.
3/ Use on DAILY TimeFrame for clear visibility
Enjoy !

Institutional Zones: Opening & Closing Trend HighlightsDescription / Content:
Track key institutional trading periods on Nifty/Bank Nifty charts with dynamic session zones:
Opening Volatility Zone: 9:15 AM – 9:45 AM IST (Green)
Closing Institutional Zone: 1:30 PM – 3:30 PM IST (Orange)
Both zones are bounded by the day’s high and low to help visualize institutional activity and price behavior.
Key Observations:
Breakout in both closing trend and opening trends often occurs on uptrending days.
Breakdown in both closing range and opening range usually happens on downside trending days.
Price opening above the previous closing trend is often a sign of a strong opening.
This script helps traders identify trend strength, breakout/breakdown zones, and institutional participation during critical market hours.
Disclaimer:
This indicator is for educational and informational purposes only. It is not a financial advice or recommendation to buy or sell any instrument. Always confirm with your own analysis before taking any trade.
Pine Script Features:
Dynamic boxes for opening and closing sessions
Boxes adjust to the day’s high and low
Optional labels at session start
Works on intraday charts (1m, 5m, 15m, etc.)
Usage Tip:
Use this indicator in combination with trend analysis and volume data to spot strong breakout/breakdown opportunities in Nifty and Bank Nifty.

Ant_JJun 5분봉 데이 트레이딩 지표[체험판]Ant_JJun — 5분봉 단기 규칙 기반 데이 트레이딩 프레임워크
(Ichimoku 구조 + 거래량 논리 기반)
이 지표는 BTC 5분봉 환경에서의 단기 트레이딩 의사결정을 돕기 위해 설계되었습니다.
목표는 진입 신호의 빈도를 늘리는 것이 아니라, 추세 구간과 비추세 구간을 구별하여 불필요한 노출을 줄이는 것에 있습니다.
많은 보조지표는 가격이 이미 움직인 뒤에만 유효하게 작동합니다.
이 시스템은 반대로, 방향성이 형성되기 전의 횡보 구간에서 자본 손실을 억제하는 것을 우선합니다. 이를 위해 일목 구조(선행스팬 기반)로 환경을 분류하고, 거래량 비대칭과 캔들 성향을 추가 필터로 사용합니다.
핵심 작동 개념
• 선행스팬 기반 구조 판별로 추세/중립 환경을 분리
• 구조 + 거래량 + 캔들조건이 모두 정렬될 때만 방향 라벨 출력
• 정렬되지 않을 경우 진입 강제가 아닌 ‘대기’ 상태 유지
• 리페인트 없음 / 사후 라벨 생성 없음 / 실시간 판정
사용 환경
• 5분봉 단기 매매
• 데이터 발표 등 변동성 이벤트 인접 구간 관찰 목적
• 자동매매가 아닌 규칙 기반 의사결정 필터링용
이 스크립트는 독자적 방식이 포함되어 있어 공개 배포되지 않습니다.
Ant_JJun — 5-Minute Rule-Based Day-Trading Framework
(Ichimoku structure + volume logic)
This indicator is designed to support short-term decision-making on the BTC 5-minute chart.
Its goal is not to increase signal frequency, but to reduce unnecessary exposure by distinguishing trending from non-trending conditions.
Most indicators only function effectively after price has already moved.
This framework prioritizes capital protection during pre-move consolidation.
It classifies market context using Ichimoku leading spans, and adds volume imbalance and candle behavior as additional filters.
Core operating logic
• Leading-span structure to classify trend vs. neutral zones
• Directional labels only when structure + volume + candle conditions align
• When alignment is absent, the system remains in a waiting state rather than forcing entries
• No repainting / no post-hoc labels / real-time evaluation only
Intended environment
• 5-minute intraday trading
• Particularly around volatility events such as economic data releases
• Used as a rule-based decision filter rather than an automation engine
This script is not publicly distributed due to proprietary methodology.

Ant_JJun 5-Minute Day-Trading IndicatorThis invite-only indicator is designed for short-term BTC and crypto trading, focusing on precision during volatile data-driven markets and capital protection during sideways conditions.
It integrates Ichimoku-based structure mapping with volume asymmetry analysis and proprietary rule-based filters.
Unlike a traditional mashup, this system does not simply overlay multiple indicators.
It uses Ichimoku’s leading spans to classify structural bias (trend vs. neutral), then evaluates directional confirmation through candle displacement and volume pressure imbalance.
Only when both structure and momentum align is a directional label printed.
If the system detects indecision (flat or overlapping clouds with contracting volume), it enters a neutral state to avoid unnecessary exposure.
Key concept:
— Preventing bleed during non-trending phases
— Adaptive response around macro/volatility events (e.g., CPI, PMI)
— Rule-based execution to remove emotional decision-making
Usage notes:
— Intended for 5-minute intraday use
— Long/Short labels appear only on rule-confirmed entries
— No repainting / no backfill logic
— Analytical use only — not investment advice

Proteus EMA SystemInstitutional-Grade EMA System
Overview and Originality
The Institutional-Grade EMA System is an advanced, multi-layered Exponential Moving Average (EMA) overlay indicator designed to provide institutional-level trend analysis, market regime identification, and trade signal generation. Unlike standard multi-EMA scripts that simply plot averages and basic crossovers, this indicator introduces a proprietary integration of features tailored for professional traders: customizable presets that dynamically adjust EMA lengths for specific trading styles (e.g., scalping vs. position trading), multiple selectable trend detection algorithms (including a unique multi-bar slope analysis with percentage-based strength thresholding), EMA alignment and confluence detection for spotting high-conviction trends and reversal zones, volume-based signal filtering, and a comprehensive statistics dashboard for real-time market insights.
What makes this script original and worthy of closed-source protection is the bespoke combination of these elements into a cohesive system. For instance, while basic EMA ribbons or trend coloring exist in other indicators, this script's trend detection goes beyond simple comparisons by incorporating a normalized slope percentage calculation (detailed below) to quantify trend strength on a 0-100% scale, integrated with EMA stacking checks and confluence thresholds. This proprietary logic—refined through extensive backtesting on diverse assets—allows for nuanced market regime classification (e.g., "Strong Uptrend" only when alignment, slope strength, and volume align), which isn't replicated in open-source alternatives. The closed-source format protects the exact orchestration of these algorithms, including custom threshold derivations and dashboard computations, preventing direct replication while allowing users full access to the tool's outputs. If published open-source, the unique mathematical formulations (e.g., slope-to-strength mapping) could be easily copied, diminishing its edge in competitive trading environments.
This indicator draws conceptual inspiration from institutional trend-following systems (e.g., those using multiple time-horizon EMAs like in hedge fund models), but enhances them with modern Pine Script capabilities for visual and analytical depth. It's particularly useful for traders seeking to reduce false signals in volatile markets by requiring multi-factor confluence.
What It Does
Core EMA Plotting and Visualization: Plots up to 7 EMAs (5 primary + 2 optional) with dynamic coloring based on detected trend direction and strength (strong bullish: bright green; weak: faded green; neutral: gray; etc.). Includes EMA ribbons (fills between consecutive EMAs) and clouds (broader fills between non-consecutive EMAs) to visualize trend expansion/contraction.
Trend Detection and Strength: Classifies trends as strong/weak bullish/bearish or neutral using user-selectable methods, with optional volume confirmation to filter low-conviction moves.
Advanced Analytics:
Detects EMA alignment (all EMAs stacked in ascending/descending order for bullish/bearish trends).
Identifies EMA confluence zones (tight clustering of EMAs, signaling potential reversals or consolidations).
Draws dynamic support/resistance lines from the nearest EMAs relative to price.
Signals and Alerts: Generates buy/sell signals on customizable EMA crossovers, only if volume thresholds are met. Includes alerts for crossovers, alignments, confluences, and regime shifts.
User Interface Enhancements: Background coloring for quick trend bias (e.g., green for uptrends, yellow for confluences), dynamic line widths (thicker for slower EMAs), trend state labels, and a table-based dashboard displaying metrics like market regime, trend strength percentage, EMA slopes in degrees, price distances to key EMAs, volume status, and alignment state.
Customization Presets: Pre-configured EMA lengths for Scalping (short, reactive: e.g., 5/8/13), Day Trading (balanced: 9/21/50), Swing Trading (medium-term: 20/50/100), Position Trading (long-term: 50/100/150), or fully custom.
The result is a versatile tool that adapts to any timeframe or asset, helping traders identify high-probability setups by combining trend momentum, volume, and EMA dynamics.
How It Works: Underlying Concepts and Calculations
Without revealing the full implementation, here's a transparent overview of the key concepts and methodologies to help users understand the indicator's logic:
EMA Calculation and Presets: EMAs are computed using standard exponential smoothing (weighting recent prices more heavily). Presets optimize lengths based on trading horizon—shorter for scalping to capture quick reversals, longer for position trading to filter noise. For example, Swing preset uses 20/50/100/150/200 to balance short-term pullbacks with long-term trends, derived from Fibonacci-inspired progressions for natural market rhythm alignment.
Trend Detection Methods: Users select from four algorithms for flexibility:
Multi-Bar Slope (Default): Calculates the average slope over a lookback period (e.g., 3 bars) as (current EMA value - EMA value ) / lookback. Normalizes to a percentage relative to the EMA value: slope_percent = (slope / EMA) * 100. Thresholds classify trends (e.g., >0.05% = strong bullish; 0.01-0.05% = weak; symmetric for bearish). This method draws from linear regression concepts but simplifies for real-time use, providing robust trend quantification over simple bar-to-bar changes.
Previous Bar: Compares current EMA to the prior bar's, with percentage change thresholds (e.g., >0.1% = strong) for quick momentum shifts.
EMA vs EMA: Measures the percentage difference between fast and slow EMAs (e.g., >2% = strong bullish), inspired by MACD-like divergence but applied directly to EMAs.
Price Position: Gauges price's percentage distance from the EMA (e.g., >1% above = strong bullish), similar to envelope channels but integrated into trend coloring.
Trend strength is further scored (0-100%) by averaging absolute slopes of key EMAs, scaled for dashboard display.
Volume Confirmation: Uses a simple moving average of volume over a user-defined length (default 20), requiring current volume to exceed it by a multiplier (default 1.2x) for signal validation. This filters out low-volume fakeouts, akin to institutional volume-weighted strategies.
EMA Alignment: Checks if all visible EMAs are in strict order (fastest highest in uptrends, lowest in downtrends) by iterating through active EMAs and verifying sequential relationships. Signals "ALIGNED" shapes when true, indicating stacked trends like in ribbon strategies but with programmatic validation.
EMA Confluence: Computes the average of active EMAs, then measures the maximum percentage deviation of any EMA from this average. If below a threshold (default 0.5%), marks a "CONFLUENCE ZONE" box, conceptually similar to Bollinger Band squeezes but applied to EMA clusters for reversal anticipation.
Market Regime Classification: Combines alignment, trend score (>30% for "strong"), and price position relative to slowest EMA. For example, bullish alignment + high score = "Strong Uptrend"; close clustering = "Consolidation". This heuristic draws from regime-switching models in quantitative finance.
Signals and Visuals: Crossovers between user-selected EMAs (e.g., fast #1 over slow #2) plot "BUY/SELL" shapes only if volume-confirmed. Ribbons use color fills (green/red) based on EMA order; background shades reflect regime; S/R lines extend from max/min EMAs below/above price over a lookback (default 50 bars).
These calculations ensure the indicator provides actionable, multi-confirmed insights rather than generic plots.
How to Use It
Setup: Add to your chart and select a preset (e.g., "Swing Trading" for 1H-4H charts). Customize trend method (start with "Multi-Bar Slope" for accuracy), enable volume filter for reliability, and toggle visuals like ribbons or dashboard.
Trend Following: In a "Strong Uptrend" (green background, upward slopes >30%, bullish alignment), go long above the fastest EMA. Use S/R lines for stops (below nearest support EMA).
Swing Trading Example: On a daily SPX chart with Swing preset:
Wait for "Weak Uptrend" transition to "Strong" (trend score >50%, positive slopes, volume spike).
Enter long on EMA1 (20) crossing EMA2 (50), confirmed by "BUY" signal.
Target next resistance EMA (e.g., 150), exit on bearish crossover or confluence zone (yellow box signaling potential top).
Risk: Stop below EMA3 (100); aim for 2:1 reward:risk on multi-day holds.
Scalp Trading Example: On a 5-min BTCUSD chart with Scalping preset:
Focus on quick "Weak Bullish" shifts (faded green EMAs, slope >0.01%).
Buy on EMA1 (5) crossing EMA3 (13) with high volume (>1.5x avg).
Scalp 0.2-0.5% gains, exit at slope flattening (dashboard shows <30% strength) or nearest resistance.
Avoid confluences (chop); use 1-min for entries, 15-min for bias.
General Tips:
Combine with price action (e.g., candlestick patterns at confluence zones).
Backtest presets on your asset—adjust thresholds for volatility (e.g., tighter confluence for forex).
Use alerts for hands-off monitoring; multi-timeframe analysis enhances accuracy (higher TF for regime, lower for signals).
For ranging markets ("Neutral" regime), fade extremes near S/R zones.
Examples for Swing Trading
Swing trading focuses on capturing medium-term moves (days to weeks) in trending markets. Use the "Swing Trading" preset, which sets EMAs to 20, 50, 100, 150, 200, 75, 125—balancing sensitivity and smoothness.
Bullish Setup Example: On a daily chart of AAPL, wait for a "Strong Uptrend" regime (green background, bullish alignment label, trend strength >50%). Enter long on a valid bullish crossover (green "BUY" circle) between EMA1 (20) and EMA2 (50), confirmed by high volume. Set stop below nearest support EMA (e.g., EMA3 at 100), target 2-3x risk or next resistance. Hold until bearish crossover or alignment breaks.
Bearish Setup Example: On a 4H chart of EURUSD, spot a "Strong Downtrend" (red background, bearish alignment). Short on a bearish crossover (red "SELL") between EMA1 and EMA3, with volume confirmation. Stop above nearest resistance EMA, exit on confluence zone (yellow) signaling potential reversal.
Tip: Focus on alignments for trend confirmation—avoid trading against them. Use confluence zones as profit-taking areas in ranging markets.
Examples for Scalp Trading
Scalping targets quick, short-term trades (minutes to hours) on lower timeframes. Select the "Scalping" preset for shorter EMAs (5, 8, 13, 21, 34, 55, 89) to catch rapid moves.
Bullish Setup Example: On a 1-min chart of BTCUSD, look for "Weak Uptrend" (faded green background, positive slopes). Enter long on a fast crossover (e.g., EMA1 over EMA2) with high volume and no confluence (avoid chop). Scalp for 0.5-1% gain, exit on slope flattening or bearish cross. Use tight stops below the fastest EMA.
Bearish Setup Example: On a 5-min chart of TSLA, identify "Weak Downtrend" (faded red). Short on a crossover between EMA2 and EMA3, confirmed by volume spike. Target small moves (e.g., 10-20 pips), exit at nearest support EMA or if trend strength drops below 30%.
Tip: Prioritize "Multi-Bar Slope" detection for quick trend shifts. Disable background if it's distracting; focus on crossovers and volume for high-frequency entries. Avoid during confluences, as they signal choppy conditions.
This detailed approach ensures traders can replicate setups while appreciating the indicator's original value. Feedback welcome—let's refine trading edges together!
PulseGrid Universal Scalper - Adaptive Pulse and Symmetric SpansInstrument agnostic. Works on any symbol and timeframe supported by TradingView.
Message or hit me up in chat for full access .
Purpose and scope
PulseGrid is a short timeframe strategy designed to read intrabar structure and recent path so that entries align with actionable momentum and context. The strategy is private. The description below provides all the information needed to understand how it behaves, how it sizes risk, how to tune it responsibly, and how to evaluate results without making unrealistic claims. The design is instrument agnostic. It runs on any asset class that prints open high low close bars on TradingView. That includes commodities such as Gold and WTI, currencies, crypto, equity indices, and single stocks. Performance will always depend on the symbol’s liquidity, spread, slippage, and session structure, which is why the description focuses on principles and safe parameter ranges instead of hard promises.
What the strategy does at a glance
It builds a composite entry signal named Pulse from five normalized bar features that reflect short term pressure and follow through.
It applies regime guards that keep the strategy inactive when the tape is either too quiet, too bursty, or too directionally random.
It optionally uses a directional filter where a fast and a slow exponential average must agree and their gap must be material relative to recent true range.
When a signal is allowed, risk is sized using symmetric spans that come from nearby untraded price distances above and below the market. The strategy sets a single stop and a single take profit from those spans.
Lines for entry, stop, and take profit are drawn on the chart. A compact on chart table shows trade counts, win rate, average R per trade, and profit factor for all trades, longs only, and shorts only.
This combination yields entries that are reactive but not chaotic, and risk lines that respect the market’s recent path instead of generic pip or point targets.
Why the design is original and useful
The core originality is the union of a composite entry that adapts to volatility and a geometry based risk model. The entry uses five different viewpoints on the same bar space instead of relying on a single technical indicator. The risk model uses spans that come from actual untraded distance rather than fixed multipliers of a generic volatility measure. The result is a framework that is simple to read on a chart and simple to evaluate, yet it avoids the traps of curve fitting to one symbol or one month of data. Because everything is normalized locally, the same logic translates across asset classes with only modest tuning.
The Pulse composite in detail
Pulse is a weighted blend of the following normalized features.
Impulse imbalance. The script sums upward and downward impulses over a short window. An upward impulse is the extension of highs relative to the prior bar. A downward impulse is the extension of lows relative to the prior bar. The net imbalance, scaled by the local range, captures whether extension pressure is building or fading.
Wick and close location. Inside each bar, the distance between the close and the extremes carries information about rejection or acceptance. A bar that closes near the high with relatively heavier lower wick suggests upward acceptance. A bar that closes near the low with heavier upper wick suggests downward acceptance. A weight controls the contribution of wick skew versus close location so that users can favor reversal or momentum behaviour.
Shock touches. Within the recent range window, touches that occur very near the top decile or bottom decile are marked. A short sliding window counts recent shocks. Frequent top shocks in a rising context suggest supply tests. Frequent bottom shocks in a declining context suggest demand tests. The count is normalized by window length.
Breakout ledger. The script compares current extremes to lagged extremes and keeps a simple count of recent upside and downside breakouts. The difference behaves as a short term polarity meter.
Curvature. A simple second difference in closing price acts as a curvature term. It is normalized by the recent maximum of absolute one bar returns so that the value remains bounded and comparable to other terms.
Pulse is smoothed over a fraction of the main signal length. Smoothing removes impulse spikes without destroying the quick reaction that scalpers need. The absolute value of smoothed Pulse can be used with an adaptive gate so that only the top percentile of energy for the recent environment is eligible for entries. A small floor prevents accidental entries during very quiet periods.
Regime guards that keep the strategy selective
Three guards must all pass before any entry can occur.
Auction Balance Factor. This is the proportion of closes that land inside a mid band of the prior bar’s high to low range. High values indicate balanced chop where breakouts tend to fail. Low values indicate directional conditions. The strategy requires ABF to sit below a user chosen maximum.
Dispersion via a Gini style measure on absolute returns. Very low dispersion means bars are small and uniform. Very high dispersion means a few outsized bars dominate and slippage risk can be elevated. The strategy allows the user to require the dispersion measure to remain inside a band that reflects healthy activity.
Binary entropy of direction. Over the core window, the proportion of up closes is used to compute a simple entropy. Values near one indicate coin flip behaviour. Values near zero indicate one sided sequences. The guard requires entropy below a ceiling so that random directionality does not produce noise entries.
An optional directional filter asks that a fast and a slow exponential average agree on direction and that their gap, when divided by an average true range, exceed a threshold. This filter can be enabled on symbols that trend cleanly and disabled when the composite entry is already selective enough.
Risk sizing with symmetric spans
Instead of fixed points or a pure ATR multiplier, the strategy sizes stops and targets from a pair of spans. The upward span reflects recent untraded distance above the market. The downward span reflects recent untraded distance below the market. Each span is floored by a fallback that comes from the maximum of a short simple range average and a standard average true range. A tick based floor prevents microscopic stops on instruments with high tick precision. An asymmetry cap prevents one span from becoming many times larger than the other. For long entries the stop is a multiple of the downward span and the target is a multiple of the upward span. For short entries the stop is a multiple of the upward span and the target is a multiple of the downward span. This creates a risk box that is symmetric by construction yet adaptive to recent voids and gaps.
Execution, ties, and housekeeping
Entries evaluate at bar close. Exits are tested from the next bar forward. If both stop and target are hit within the same bar, the outcome can be resolved in a consistent way that favors the stop or the target according to a single user setting. A short cooldown in bars prevents flip flops. Users can restrict entries to specific sessions such as London and New York. The chart renders entry, stop, and target lines for each trade so that every action is visible. The table in the top right shows trade counts, take profit and stop counts, win rate, average R per trade, and profit factor for the whole set and by direction.
Defaults and responsible backtesting
The default properties in the script use a realistic initial capital and commission value. Users should also set slippage in the strategy properties to reflect their broker and symbol. Small timeframe trading is sensitive to friction and the strategy description does not claim immunity to that reality. The strategy is intended to be tested on a dataset that produces a meaningful sample of trades. A sample in the range of a hundred trades or more is preferred because variance in short samples can be large. On thin symbols or periods with little regular trading, users should either change timeframe, change sessions, or use more selective thresholds so that the sample contains only liquid scenarios.
Universal usage across markets
The strategy is universal by design. It will run and produce lines on any open high low close series on TradingView. The composite entry is made of normalized parts. The regime guards use proportions and bounded measures. The spans use untraded distance and range floors measured in the local price scale. This allows the same logic to function on a currency pair, a commodity, an index future, a stock, or a crypto pair. What changes is calibration.
A safe approach for universal use is as follows.
Start with the default signal length and wick weight.
If the chart prints many weak signals, enable the directional filter and raise the normalized gap threshold slightly.
If the chart is too quiet, lower the adaptive percentile or, with adaptive off, lower the fixed pulse threshold by a small amount.
If stops are too tight in quiet regimes, raise the fallback span multiplier or raise the minimum tick floor in ticks.
If you observe long one sided days, lower the maximum entropy slightly so that entries only occur when directionality is genuine rather than alternating.
Because the logic is bounded and local, these simple steps carry over across symbols. That is why the strategy can be used literally on any asset that you can load on a TradingView chart. The code does not depend on a specific tick size or a specific exchange calendar. It will still remain true that symbols with higher spread or fewer regular trading hours demand stricter thresholds and larger floors.
Suggested parameter ranges for common cases
These ranges are guidelines for one to five minute bars. They are not promises of performance. They reflect the balance between having enough signals to learn from and keeping noise controlled.
Signal length between 18 and 34 for liquid commodities and large capitalization equities.
Wick weight between 0.30 and 0.50 depending on whether you want reversal recognition or close momentum.
Adaptive gate percentile between 85 and 93 when adaptive is enabled. Fixed threshold between 0.10 and 0.18 when adaptive is disabled. Use a non zero floor so very quiet periods still require some energy.
Auction Balance Factor maximum near 0.70 for symbols with clear session bursts. Slightly higher if you prefer to include more balanced prints.
Dispersion band with a lower bound near 0.18 and an upper bound near 0.68 for most session instruments. Tighten the band if you want to skip very bursty days or very flat days.
Entropy maximum near 0.90 so coin flip phases are filtered. Lower the ceiling slightly if the symbol whipsaws frequently.
Stop multiplier near one and take profit multiplier between two and three for a single target approach. Larger target multipliers reduce hit rate and lengthen holding time.
These are safe starting points across commodities, currencies, indices, equities, and crypto. From there, small increments are preferred over dramatic changes.
How to evaluate responsibly
A clean chart and a direct test process help avoid confusion. Use standard candles for signals and exits. If you use a non standard chart type such as Heikin Ashi or Renko, do so only for visualization and not for the strategy’s signal computation, as those chart types can produce unrealistic fills. Turn off other indicators on the published chart unless they are needed to demonstrate a specific property of this strategy. When you post results or discuss outcomes, include the symbol, timeframe, commission and slippage settings, and the session settings used. This makes the context clear and avoids misleading readers.
When you look at results, consider the following.
The distribution of R per trade. A positive average R with a moderate profit factor suggests that exits are sized appropriately for the symbol.
The balance between long and short sides. The HUD table separates the two so you can see if one side carries the edge for that symbol.
The sensitivity to the tie preference. If many bars hit both stop and take profit, the market is chopping inside the risk box and you may need larger floors or stricter regime guards.
The session effect. Session hours matter for many instruments. Align your session filter with where liquidity and volatility concentrate.
Known limitations and honest warnings
PulseGrid is not a guarantee of future profit. It is a systematic way to read short term structure and to size risk in a way that reflects recent path. It assumes that the data feed reflects the exchange reality. It assumes that slippage and spread are non zero and uses explicit commission and user provided slippage to approximate that. It does not place multiple targets. It does not trail stops. It is not a high frequency system and does not attempt to model queue priority or microsecond fills. On illiquid symbols or very short timeframes outside regular hours, signals will be less reliable. Users are responsible for choosing realistic settings and for evaluating whether the symbol’s conditions are suitable.
First use checklist
Load the symbol and timeframe you care about.
If the instrument has clear sessions, turn on the session filter and select realistic London and New York hours or other sessions relevant to the instrument.
Set commission and slippage in the strategy properties to values that match your broker or exchange.
Run the strategy with defaults. Look at the HUD summary and the lines.
Decide whether to enable the directional filter. If you see frequent reversals around the entry line, enable it and raise the normalized gap threshold slightly.
Adjust the adaptive gate. If the chart floods, raise the percentile. If the chart starves, lower it or use a slightly lower fixed threshold.
Adjust the fallback span multiplier and tick floor so that stops are never microscopic.
Review per session performance. If one session underperforms, restrict entries to the better one.
This simple process takes minutes and transfers to any other symbol.
Why this script is private
The source remains private so that the underlying method and its implementation details are not copied or republished. The description here is complete and self contained so that users can understand the purpose, originality, usage, and limitations without needing to inspect the source. Privacy does not change the strategy’s on chart behavior. It only protects the specific coding details.
Guarantee and compliance statements
This description does not contain advertising, solicitations, links, or contact information. It does not make performance promises. It explains how the script is original and how it works. It also warns about limitations and the need for realistic assumptions. The strategy is not investment advice and is not created only for qualified investors. It can be tested and used for educational and research purposes. Users should read TradingView’s documentation on script properties and backtesting. Users should avoid non standard chart types for signal computation because those produce unrealistic results. Users should select realistic account sizes and friction settings. Users should not post claims without showing the settings used.
Closing summary
PulseGrid is a compact framework for short timeframe trading that combines a composite entry built from multiple normalized bar features with a symmetric span model for risk. The entry adapts to volatility. The regime guards keep the strategy inactive when the tape is either too quiet or too erratic. The risk geometry respects recent untraded spans instead of arbitrary distances. The entire design is instrument agnostic. It will run on any symbol that TradingView supports and it will behave consistently across asset classes with modest tuning. Use it with a clean chart, realistic friction, and enough trades to make your evaluation meaningful. Use sessions if the instrument concentrates activity in specific hours. Adjust one control at a time and prefer small increments. The goal is not to find a magic parameter. The goal is to maintain a stable rule set that reads market structure in a way you can trust and audit.

Session Breakout Detector (SBD)Overview:
The Session Breakout Detector (SBD) is a TradingView indicator designed to identify and visualize breakouts from major trading sessions. It tracks a selected session (Tokyo, London, or New York) and detects price movements beyond the session's high or low, assisting traders in spotting potential breakout opportunities.
Key Features:
- Session Selection: Choose between Tokyo, London, or New York sessions.
- Breakout Detection Modes:
- Confirmed Bar: Detects breakouts when a candle closes beyond the session's range.
- Intrabar: Detects breakouts as soon as the price exceeds the session's high or low within a
candle.
- Visual Indicators:
- Displays session high, low, and range with a colored box for clear visualization.
- Marks breakouts with green (bullish) or red (bearish) triangles.
- Optional 50-Period SMA: Adds a 50-period Simple Moving Average to the chart for trend
analysis.
- Alerts: Configurable alerts for bullish and bearish breakouts.
Usage Instructions:
1. Select Session: Choose the desired trading session (Tokyo, London, or New York) from the
input settings.
2. Choose Breakout Detection Mode: Select between 'By confirmed bar' or 'By intrabars' based
on your trading preference.
3. Enable SMA (Optional): Toggle the 'Use SMA?' option to display the 50-period Simple Moving
Average.
4. Set Alerts: Configure alerts for breakout signals as per your trading strategy.
⚠️Note: This indicator is intended for informational purposes only and should not be construed as financial advice. Users are encouraged to conduct their own research and consider their individual risk tolerance before making trading decisions.

Multi-Symbol and Multi-Timeframe Supertrend Screener [Pineify]Multi-Symbol and Multi-Timeframe Supertrend Screener
Advanced Supertrend screener for TradingView that monitors 6 symbols across 4 timeframes simultaneously. Features customizable ATR periods, visual alerts, and color-coded trend direction displays for efficient market scanning.
Key Features
The Supertrend Screener is a comprehensive multi-symbol market monitoring tool that displays Supertrend indicator signals across multiple assets and timeframes in a single, organized table view. This screener eliminates the need to manually check individual charts by providing real-time trend analysis for up to 6 symbols across 4 different timeframes simultaneously.
How It Works
The screener utilizes the proven Supertrend indicator methodology, which combines Average True Range (ATR) and price action to determine trend direction. The core calculation involves:
Computing the ATR using a customizable period (default: 10)
Applying a multiplication factor (default: 3.0) to create dynamic support/resistance levels
Determining trend direction based on price position relative to these levels
Displaying results through color-coded cells with customizable text labels
The indicator employs the request.security() function to fetch data from multiple symbols and timeframes, ensuring accurate cross-market analysis without chart switching.
Trading Ideas and Insights
This screener excels in several trading scenarios:
Market Overview: Quickly assess overall market sentiment across major cryptocurrencies or forex pairs
Trend Confirmation: Verify trend alignment across multiple timeframes before entering positions
Divergence Spotting: Identify when shorter timeframes diverge from longer-term trends
Opportunity Scanning: Locate assets showing consistent trend direction across all monitored timeframes
Risk Management: Monitor multiple positions simultaneously to spot potential trend reversals
The screener is particularly effective for swing traders and position traders who need to monitor multiple assets without constantly switching between charts.
How Multiple Indicators Work Together
While this screener focuses specifically on the Supertrend indicator, it incorporates several complementary technical analysis components:
ATR Foundation: Uses Average True Range to adapt to market volatility, making the indicator responsive to current market conditions
Multi-Timeframe Analysis: Combines signals from 1-minute, 5-minute, 10-minute, and 30-minute timeframes to provide comprehensive trend perspective
Price Action Integration: The Supertrend calculation inherently incorporates price action by using high, low, and close values
Volatility Adjustment: The ATR-based calculation ensures the indicator adapts to different volatility regimes across various assets
The synergy between these elements creates a robust screening system that accounts for both momentum and volatility , providing more reliable trend identification than single-timeframe analysis.
Unique Aspects
Several features distinguish this screener from standard Supertrend implementations:
Table-Based Display: Presents data in an organized, space-efficient format rather than overlay plots
Customizable Visual Elements: Full control over text labels, colors, and background styling
Multi-Asset Capability: Monitors 6 different symbols simultaneously without performance degradation
Efficient Resource Usage: Optimized code structure minimizes calculation overhead
Professional Presentation: Clean, institutional-grade visual design suitable for trading desks
How to Use
Symbol Configuration: Input your desired symbols in the Symbol section (default includes major crypto pairs)
Timeframe Setup: Configure four timeframes for analysis (default: 1m, 5m, 10m, 30m)
Supertrend Parameters: Adjust the Factor (sensitivity) and ATR Period according to your trading style
Visual Customization: Set custom text labels and colors for up/down trends
Market Analysis: Monitor the table for consistent signals across timeframes and symbols
Interpretation Guide:
- Green cells indicate uptrend (price above Supertrend line)
- Red cells indicate downtrend (price below Supertrend line)
- Look for alignment across multiple timeframes for stronger signal confidence
Customization
The screener offers extensive customization options:
Factor Setting: Adjust sensitivity (higher values = less sensitive, fewer signals)
ATR Period: Modify lookback period for volatility calculation
Text Labels: Customize up/down trend display text
Color Scheme: Full RGB color control for text and background elements
Symbol Selection: Monitor any TradingView-supported symbols
Timeframe Array: Choose any four timeframes for comprehensive analysis
Conclusion
The Supertrend Screener transforms traditional single-chart analysis into an efficient, multi-dimensional market monitoring system. By combining the reliability of the Supertrend indicator with multi-timeframe and multi-symbol capabilities, this tool empowers traders to make more informed decisions with greater market context.
Whether you're managing multiple positions, scanning for new opportunities, or confirming trend direction before entries, this screener provides the comprehensive overview needed for professional trading operations. The clean interface and customizable features make it suitable for traders of all experience levels while maintaining the analytical depth required for serious market analysis.
Perfect for day traders, swing traders, and anyone requiring efficient multi-market trend monitoring in a single view.

GOLDSNIPERThe Gold Sniper Indicator is a precision trading tool designed specifically for scalping and intraday trading Gold (XAUUSD) on TradingView.
It automatically plots institutional key levels, detects breakout & retest opportunities, and provides trade management levels (Stop Loss & Take Profit) for structured, disciplined trading.
Aug 6
Release Notes
The Gold Sniper Indicator is a precision trading tool designed specifically for scalping and intraday trading Gold (XAUUSD) on TradingView.
It automatically plots institutional key levels, detects breakout & retest opportunities, and provides trade management levels (Stop Loss & Take Profit) for structured, disciplined trading
Aug 13
Release Notes
The Gold Sniper Indicator is a precision trading tool designed specifically for scalping and intraday trading Gold (XAUUSD) on TradingView.
It automatically plots institutional key levels, detects breakout & retest opportunities, and provides trade management levels (Stop Loss & Take Profit) for structured, disciplined trading.
3 days ago
Release Notes
The Gold Sniper Indicator is a precision TradingView tool for scalping and intraday trading Gold (XAUUSD).
It is built around a break-and-retest strategy with clear trade management: 10 pip Stop Loss, 20 pip TP1, and 35 pip TP2.
The indicator automatically:
• Plots institutional key levels and supply & demand zones
• Detects breakout and retest opportunities in real time
• Provides stop loss and take profit levels for structured, disciplined trading
Whether you’re a scalper or day trader, Gold Sniper helps you catch high-probability setups on XAUUSD with precise risk-to-reward ratios (1:1 and 1:3).

KAMENICZKI PROSCAPLERPROSCAPLER is an advanced trading indicator that combines a dynamic channel with a prediction line for maximum accuracy and trading success. The indicator is designed for professional traders who need reliable signals with high success rates.
Adaptive Intelligence
Automatic optimal period detection - the indicator adapts to various market conditions
Intelligent timeframe settings - automatically optimizes periods based on TF
Dynamic adaptation - the channel changes according to volatility and trend.
High Signal Accuracy
Pearson R correlation - filters only strong trends with high reliability
Multi-timeframe confirmation - confirms signals on higher timeframe
Volatility and volume filters - eliminates false signals
RSI extreme values - captures only the best entry points
Prediction Line
Future price direction - shows where the price will move
Adaptive length - adapts to timeframe
Strong signals - when the entire prediction line is in the center of the channel
Quality Filters
Minimum Pearson R 0.5+ - only strong trends
Volume filter 1.2x - only signals with sufficient volume
ATR volatility filter - eliminates low volatility
RSI extreme levels - only at oversold/overbought values
Anomalies
Anomaly detection - captures exceptional opportunities
Bright yellow/pink color - immediately visible
Fast Reaction
Minimum trend bars = 1 - fast turning
Adaptive detection - immediate reaction to changes
Automatic optimizations - without manual settings
News & Volatility Filters
News filter - disables channel during high impact news
Volatility filter - protects against high volatility
Gap detection - filters dangerous gaps
Combined Filters
All filters must be met - maximum reliability
Multi-timeframe confirmation - double check
Pearson R validation - mathematical accuracy
Volume confirmation - institutional interest
Reaction Speed
Instant signals - without delay
Adaptive settings - automatic optimization
Fast turning - minimum 1 bar trend
Signal Accuracy
Quality filters increase success rate to 70-80%
Anomalies have 80-90% success rate
STRONG signals (prediction line in center) 85-95%
HAVE FUN :)
Smart Money Support/Resistance - LiteSmart Money Support/Resistance — Lite
Overview & Methodology
This indicator identifies support and resistance as zones derived from concentrated buying and selling pressure, rather than relying solely on traditional swing highs/lows. Its design focuses on transparency: how data is sourced, how zones are computed, and how the on‑chart display should be interpreted.
Lower‑Timeframe (LTF) Data
The script requests Up Volume, Down Volume, and Volume Delta from a lower timeframe to expose intrabar order‑flow structure that the chart’s native timeframe cannot show. In practical terms, this lets you see where buyers or sellers briefly dominated inside the body of a higher‑timeframe bar.
bool use_custom_tf_input = input.bool(true, title="Use custom lower timeframe", tooltip="Override the automatically chosen lower timeframe for volume calculations.", group=grpVolume)
string custom_tf_input = input. Timeframe("1", title="Lower timeframe", tooltip="Lower timeframe used for up/down volume calculations (default 5 seconds).", group=grpVolume)
import TradingView/ta/10 as tvta
resolve_lower_tf(useCustom, customTF) =>
useCustom ? customTF :
timeframe.isseconds ? "1S" :
timeframe.isintraday ? "1" :
timeframe.isdaily ? "5" : "60"
get_up_down_volume(lowerTf) =>
= tvta.requestUpAndDownVolume(lowerTf)
var float upVolume = na
var float downVolume = na
var float deltaVolume = na
string lower_tf = resolve_lower_tf(use_custom_tf_input, custom_tf_input)
= get_up_down_volume(lower_tf)
upVolume := u_tmp
downVolume := d_tmp
deltaVolume := dl_tmp
• Data source: TradingView’s ta.requestUpAndDownVolume(lowerTf) via the official TA library.
• Plan capabilities: higher‑tier subscriptions unlock seconds‑based charts and allow more historical bars per chart. This expands both the temporal depth of LTF data and the precision of short‑horizon analysis, while base tiers provide minute‑level data suitable for day/short‑swing studies.
• Coverage clarity: a small on‑chart Coverage Panel reports the active lower timeframe, the number of bars covered, and the latest computed support/resistance ranges so you always know the bounds of valid LTF input.
Core Method
1) Data acquisition (LTF)
The script retrieves three series from the chosen lower timeframe:
– Up Volume (buyers)
– Down Volume (sellers)
– Delta (Up – Down)
2) Rolling window & extrema
Over a user‑defined lookback (Global Volume Period), the algorithm builds rolling arrays of completed bars and scans for extrema:
– Buyers_max / Buyers_min from Up Volume
– Sellers_max / Sellers_min from Down Volume
Only completed bars are considered; the current bar is excluded for stability.
3) Price mapping
The extrema are mapped back to their source candles to obtain price bounds:
– For “maximum” roles the algorithm uses the relevant candle highs.
– For “minimum” roles it uses the relevant candle lows.
These pairs define candidate resistance (max‑based) and support (min‑based) zones or vice versa.
4) Zone construction & minimum width
To ensure practicality on all symbols, zones enforce a minimum vertical thickness of two ticks. This prevents visually invisible or overly thin ranges on instruments with tight ticks.
5) Vertical role resolution
When both max‑ and min‑based zones exist, the script compares their midpoints. If, due to local price structure, the min‑based zone sits above the max‑based zone, display roles are swapped so the higher zone is labeled Resistance and the lower zone Support. Colors/widths are updated accordingly to keep the visual legend consistent.
6) Rendering & panel
Two horizontal lines and a filled box represent each active zone. The Coverage Panel (bottom‑right by default) prints:
– Lower‑timeframe in use
– Number of bars covered by LTF data
– Current Support and Resistance ranges
If the two zones overlap, an additional “Range Market” note is shown.
Key Inputs
• Global Volume Period: shared lookback window for the extrema search.
• Lower timeframe: user‑selectable override of the automatically resolved lower timeframe.
• Visualization toggles: independent show/hide controls and colors for maximum (resistance) and minimum (support) zones.
• Coverage Panel: enable/disable the single‑cell table and its readout.
Operational Notes
• The algorithm aligns all lookups to completed bars (no peeking). Price references are shifted appropriately to avoid using the still‑forming bar in calculations.
• Second‑based lower timeframes improve granularity for scalping and very short‑term entries. Minute‑based lower timeframes provide broader coverage for intraday and short‑swing contexts.
• Use the Coverage Panel to confirm the true extent of available LTF history on your symbol/plan before drawing conclusions from very deep lookbacks.
Visual Walkthrough
A step‑by‑step image sequence accompanies this description. Each figure demonstrates how the indicator reads LTF volume, locates extrema, builds price‑mapped zones, and updates labels/colors when vertical order requires it.
Chart Interpretation
This chart illustrates two distinct perspectives of the Smart Money Support/Resistance — Lite indicator, each derived from different lookback horizons and lower-timeframe (LTF) resolutions.
1- Short-term view (43 bars, 10-second LTF)
Using the most recent 43 completed bars with 10-second intrabar data, the algorithm detects that both maximum and minimum volume extrema fall within a narrow range. The result is a clearly identified range market: resistance between 178.15–184.55 and support between 175.02–179.38.
The Coverage Panel (bottom-right) confirms the scope of valid input: the lower timeframe used, number of bars covered, and the resulting zones. This short-term scan highlights how the indicator adapts to limited data depth, flagging sideways structure where neither side dominates.
2 - Long-term view (120 bars, 30-second LTF)
Over a wider 120-bar lookback with higher-granularity 30-second data, broader supply and demand zones emerge.
– The long-term resistance zone captures the concentration of buyers and sellers at the upper boundary of recent price history.
– The long-term support zone anchors to the opposite side of the distribution, derived from maxima and minima of both buying and selling pressure.
These zones reflect deeper structural levels where market participants previously committed significant volume.
Combined Perspective
By aligning the short-term and long-term outputs, the chart shows how the indicator distinguishes immediate consolidation (range market) from more durable support and resistance levels derived from extended history. This dual resolution approach makes clear that support and resistance are not static lines but dynamic zones, dependent on both timeframe depth and the resolution of intrabar volume data.

FlowSpike ES — BB • RSI • VWAP + AVWAP + News MuteThis indicator is purpose-built for E-mini S&P 500 (ES) futures traders, combining volatility bands, momentum filters, and session-anchored levels into a streamlined tool for intraday execution.
Key Features:
• ES-Tuned Presets
Automatically optimized settings for scalping (1–2m), daytrading (5m), and swing trading (15–60m) timeframes.
• Bollinger Band & RSI Signals
Entry signals trigger only at statistically significant extremes, with RSI filters to reduce false moves.
• VWAP & Anchored VWAPs
Session VWAP plus anchored VWAPs (RTH open, weekly, monthly, and custom) provide high-confidence reference levels used by professional order-flow traders.
• Volatility Filter (ATR in ticks)
Ensures signals are only shown when the ES is moving enough to offer tradable edges.
• News-Time Mute
Suppresses signals around scheduled economic releases (customizable windows in ET), helping traders avoid whipsaw conditions.
• Clean Alerts
Long/short alerts are generated only when all conditions align, with optional bar-close confirmation.
Why It’s Tailored for ES Futures:
• Designed around ES tick size (0.25) and volatility structure.
• Session settings respect RTH hours (09:30–16:00 ET), the period where most liquidity and institutional flows concentrate.
• ATR thresholds and RSI bands are pre-tuned for ES market behavior, reducing the need for manual optimization.
⸻
This is not a generic indicator—it’s a futures-focused tool created to align with the way ES trades day after day. Whether you scalp the open, manage intraday swings, or align to weekly/monthly anchored flows, FlowSpike ES gives you a clear, rules-based signal framework.

Futures Playbook: VWAP + OR + Cross-Asset TellsFutures Playbook: VWAP + OR + Cross-Asset Tells (with Trade Messages + Coach Panel)
This all-in-one futures trading toolkit combines Opening Range (OR) levels, VWAP, and cross-asset signals to help traders quickly read intraday structure, manage execution, and filter noise.
Core Features
• Opening Range (OR):
• Customizable OR window with High/Low and Midpoint.
• Automatic shading of the OR zone.
• VWAP & Bands:
• Built-in or session-anchored VWAP.
• Optional standard deviation bands for context.
• Cross-Asset Tells:
• Live reads on US 10Y yield, DXY, Crude, and Gold.
• Regime detection: rates risk, USD strength, energy softness, and real-rate easing.
• Confirmations:
• Volume vs. moving average filter.
• Cumulative delta with smoothing.
• ATR-based chop filter to avoid low-quality trends.
Trade Messages + Coach Panel
• Trade Messages (labels): Automatic on-chart prompts for OR completion, VWAP reclaim/loss, long/short setups, and EU close flows.
• Coach Panel (table): Real-time dashboard with regime context, directional bias, execution notes, risk reminders, and key levels (ORH, ORL, VWAP).
Alerts
• OR breakout (long/short with confirmations).
• VWAP reclaim or loss.
• 10Y yield crossing risk threshold.
Use Case
Designed for futures traders and scalpers who rely on VWAP + OR dynamics and need cross-asset confirmation before committing to trades. Great for structuring entries, managing risk, and filtering market noise throughout the session.

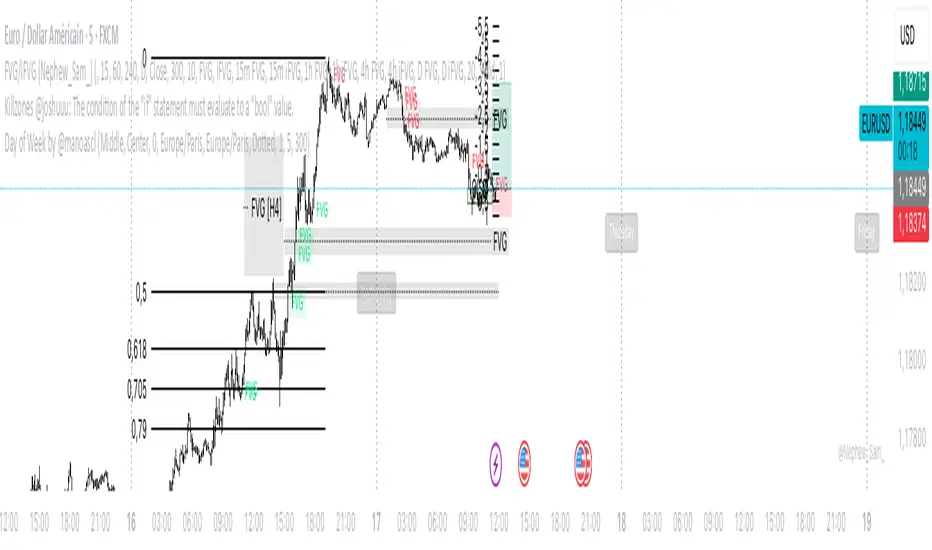
Day of Week by @manoascl Day of Week by @manoascl - version 1.8
One-line summary
This indicator draws vertical lines and labels at 00:00 of your chosen timezone for selected weekdays, helping you see daily structure, spot recurring weekly patterns, and prepare for upcoming trading days.
What it does
Draws vertical lines at 00:00 (calendar midnight) of the selected timezone for chosen weekdays (Mon–Sun).
Optionally adds a weekday label at the start of the day (top/middle/bottom alignment) with a user-defined offset in minutes.
Maintains stable label Y-positions via a configurable lookback window.
Projects future day markers (up to 30) in the same style, optionally filtering to your selected weekdays.
Fully customizable visuals: line color/width/style (solid/dashed/dotted), label background and text colors, label anchoring.
How it works (concepts & calculations)
Day boundary (midnight): Computes dayStartTz = timestamp(timezone, year, month, day, 0, 0, 0) so the boundary is true calendar midnight for the selected TZ.
Day change detection: Uses ta.change(dayStartTz) != 0 to detect the first bar of a new day (non-repainting).
Weekday naming: Determines the weekday using a midday shift (+12h) to avoid edge effects near midnight.
Drawing: When the weekday passes your filter, draws a vertical line (high→low) and an optional label positioned at the start of the day.
Future projection (DST-safe): Rebuilds future markers with timestamp(timezone, Y, M, D + k, 0, 0, 0) so daylight-saving transitions don’t drift.
Stability: Top/middle/bottom label Y-levels are derived from ta.highest/ta.lowest over a user lookback, preventing jitter.
How to use it
Add the indicator to your chart.
In Timezone, pick your region (or choose Custom and type an IANA TZ like Pacific/Tahiti).
Select the weekdays to display (e.g., only trading days, highlight Mondays, etc.).
Choose label position (top/middle/bottom), anchor (left/center/right), and set a minute offset if you want labels slightly inside the day.
Enable future projection to see upcoming day starts for planning around key weekdays (FOMC Wednesdays, NFP Fridays).
Tweak line style/width and colors to match your chart theme.
Practical applications for traders
Intraday: Instantly see where each local-time day begins; segment your session analysis cleanly.
Swing: Emphasize recurring weekdays (e.g., Monday opens, Friday profit-taking).
Event-driven: Pre-mark news-heavy weekdays and preview them with future projection.
Pattern studies: Compare behavior by weekday (range expansion, reversals, gaps) with consistent local-time boundaries.
Limitations
Visual aid only; no trading signals are generated.
Timezone must be chosen explicitly; if you pick a TZ different from your chart’s display, lines will follow the selected TZ by design.
Market holidays and custom sessions are not detected; lines still mark calendar midnight even if the market is closed.
On very small timeframes and long histories, many objects can impact performance—reduce lookback or future count if needed.
This work is licensed under a Attribution-NonCommercial-ShareAlike 4.0 International (CC BY-NC-SA 4.0) creativecommons.org
© @manoascl
KILLZONE & CHECK LIST ICAKILLZONE & CHECK LIST ICA | The Inner Circle Alchemist
✨ Features:
Display of precise trading killzones on the chart
Marking the high, low, and mid-level of each killzone
Option to show/hide killzone names
Daily separators at custom times (e.g. 17:00 or 00:00)
Highlighting Midnight Open, 8:30 Open, and New York Stock Exchange Open
Display of previous day, week, and month highs & lows (optional)
A clean and practical trading checklist on the bottom-right of the chart
Visual customization, such as showing your name/brand on the chart
Clear indication of weekdays
⚡️ A perfect mix of professional tools & visual style to keep you one step ahead!
ID on All Platforms: TheInnerCircleAlchemist
#Forex #Trading #Indicator #Killzone #TradingChecklist #PriceAction #DayTrading #SwingTrading #SmartMoney #MarketStructure #TradingTools #ChartAnalysis #TechnicalAnalysis #ForexStrategy #TraderLife #ForexTrading

Custom Time Range HighlightThis indicator highlights specific time ranges on your TradingView chart with customizable background colors and labels, making it easier to identify key trading sessions and ICT (Inner Circle Trader) Killzones. It is designed for traders who want to mark important market hours, such as major sessions (Asia, New York, London) or high-volatility Killzones, with full control over activation, timing, colors, and transparency.
Features
Customizable Time Ranges: Define up to 9 different time ranges, including one custom range, three major market sessions (Asia, New York, London), and five ICT Killzones (Asia, NY Open, NY Close, London Open, London Close).
Individual Activation: Enable or disable each time range independently via checkboxes in the settings. By default, only the ICT Killzones are active.
Custom Colors and Transparency: Set unique background and label colors for each range, with adjustable transparency for both.
Labeled Time Ranges: Each active range is marked with a customizable label at the start of the period, displayed above the chart for easy identification.
Priority Handling: If multiple ranges overlap, the range with the higher number (e.g., Asia Killzone over Custom Range) determines the background color.
CET Time Zone: Time ranges are based on Central European Time (CET, Europe/Vienna). Adjust the hours and minutes to match your trading needs.
Settings
The indicator settings are organized into three groups for clarity:
Custom Range: A flexible range (default: 15:30–18:00 CET) for user-defined periods.
Session - Asia, NY, London: Major market sessions (Asia: 01:00–10:00, New York: 14:00–23:00, London: 09:00–18:00 CET).
ICT Killzones - Asia, NY, London: High-volatility periods (NY Open: 13:00–16:00, NY Close: 20:00–23:00, London Open: 08:00–11:00, London Close: 16:00–18:00, Asia: 02:00–05:00 CET).
For each range, you can:
Toggle activation (default: only ICT Killzones enabled).
Adjust start and end times (hours and minutes).
Customize the label text.
Choose background and label colors with transparency levels (0–100).
How to Use
Add the indicator to your chart.
Open the settings to enable/disable specific ranges, adjust their times, or customize colors and labels.
The chart will highlight active time ranges with the selected background colors and display labels at the start of each range.
Use it to focus on key trading periods, such as ICT Killzones for high-probability setups or major sessions for market analysis.
Notes
Ensure your time ranges align with your trading instrument’s session times.
Overlapping ranges prioritize higher-numbered ranges (e.g., Asia Killzone overrides London Session).
Ideal for day traders, scalpers, or ICT strategy followers who need clear visual cues for specific market hours.
Feedback
If you have suggestions for improvements or need help with customization, feel free to leave a comment or contact the author!

Trade Holding Time Background HighlighterTrade Holding Time Background Highlighter
This script visually highlights the chart background based on how old each bar is relative to the current time. It’s designed for crypto futures traders (and other active traders) who want to quickly see whether price action falls inside a day trading window, a swing trading window, or is considered older history.
⸻
🔑 Features
• Dynamic Background Highlighting
• Day Trader Zone (default = last 24 hours, light green).
• Swing Trader Zone (default = last 2 weeks, light yellow).
• Older Zone (beyond 2 weeks, light gray).
• Customizable Colors
• Choose your own background colors for each zone.
• Adjust opacity to make shading subtle or bold.
• Adjustable Timeframes
• Change day trading hours (default: 24 hours).
• Change swing trading window (default: 14 days).
• Simple, Intuitive Design
• Instantly see whether the current market structure is suitable for scalps/day trades, swing trades, or simply part of older price action.
⸻
🎯 Why Use This?
As a futures/perpetual trader, knowing the context of price action is crucial:
• Scalpers/Day Traders focus on the most recent 24h.
• Swing Traders look back 1–2 weeks.
• Anything older often has less weight for short-term setups.
This script highlights those zones automatically, saving you time and giving clarity on whether you’re trading inside a fresh opportunity window or old, less relevant price action.

Trap Zone — Shinobi LabPurpose
Trap Zone draws a clean intraday “no-man’s-land” and its surrounding + / – zones so you can quickly see where momentum trades are favored — and where to avoid fighting the tape. It also overlays ADR bands to frame extreme extensions.
How it works
Trap Zone core: Built from recent high/low lookbacks and key MAs. You can include MA200 in the box bounds (on by default) for stronger regime context.
+1 / –1 zones: Dynamic bands just outside the Trap Zone, sized by an adaptive EB minimum (bar-size floor based on instrument price) or average body size.
ADR bands (+/–): Daily range estimate using the last 20 sessions with outlier filtering (keeps the 5 most representative ranges under a safe cap).
Anchoring & visuals: New zones/ADR levels are projected from the prior session close with configurable left/right extension, labels (“++”, “––”, “+++”, “–––”), and a skull label inside the box.
Why it’s useful
Clarity at a glance: Above the box → long context; below the box → short context. Inside the box = trap area where signals are lower-quality.
Avoid the worst spots: The shaded center helps you skip chop and wait for clean breaks.
Frame extensions: ADR lines highlight when price is getting stretched beyond a typical session move.
Main features
MAs: 8 / 20 / 200 / 500 (200 is optional in the box logic).
Lookbacks: independent highs/lows for precise box edges.
Adaptive EB sizing drives +1 / –1 placement.
Outlier-robust ADR calculation.
Customizable colors, labels, and projection length.
Best practices
Treat the Trap Zone as a filter, not an entry signal.
Favor longs for signals above the box and shorts for signals below it.
Use with your signal tool (e.g., EB/TB V11.4) to time entries while the Trap Zone provides bias and location.
Inputs (highlights)
Include MA200 in Trap Zone (on/off)
Bars for High / Low (lookback)
Visual Extension Zones & Left Visual Extension
Show Zones / Show ADR Labels
MA lengths (8/20/200/500)
Notes
Designed for equities; ADR is computed at the end of the regular session and projected forward.
Works on intraday charts; precision set to 2 by default.
