Apex Edge - London Open Session# Apex Edge - London Open Session Trading System
## Overview
The London Open Session indicator captures institutional price action during the first hour of the London forex session (8:00-9:00 AM GMT) and identifies high-probability breakout and retest opportunities. This system tracks the session's high/low range and generates precise entry signals when price breaks or retests these key institutional levels.
## Core Strategy
**Session Tracking**: Automatically identifies and marks the London Open session boundaries, creating a trading zone from the first hour's price range.
**Dual Entry Logic**:
- **Breakout Entries**: Triggers when price closes beyond the session high/low and continues in that direction
- **Retest Entries**: Activates when price returns to test the broken level as new support/resistance
**Performance Analytics**: Built-in win rate tracking displays real-time performance statistics over user-defined lookback periods, enabling data-driven optimization for each currency pair.
## Key Features
### Automated Zone Detection
- Precise London session timing with timezone offset controls
- Visual session boundaries with customizable colours
- Automatic high/low range calculation and display
### Smart Entry System
- Breakout confirmation requiring candle close beyond zone
- Retest detection with configurable pip distance tolerance
- Separate risk/reward ratios for breakout vs retest entries
- Visual entry arrows with clear trade direction labels
### Performance HUD
- Real-time win rate calculation over customizable periods (7-365 days)
- Total trades tracking with win/loss breakdown
- Average risk-reward ratio display
- Color-coded performance metrics (green >70%, yellow >50%, red <50%)
### PineConnector Integration
- Direct MT4/MT5 execution via PineConnector alerts
- Proper forex pip calculations for all currency pairs
- Customizable risk percentage per trade
- Symbol override capability for broker compatibility
- Automatic SL/TP level calculation in pips
## Critical Usage Requirements
### Pair-Specific Optimization
Each currency pair requires individual optimization due to varying volatility characteristics, institutional participation levels, and typical price ranges during London hours. The performance HUD is essential for identifying optimal settings before live trading.
**Recommended Testing Process**:
1. Apply indicator to desired currency pair and timeframe
2. Experiment with session timing - while 8:00-9:00 AM GMT is standard, some pairs may show improved performance with alternative hourly windows (e.g., 7:00-8:00 AM or 9:00-10:00 AM)
3. Adjust Stop Loss distances, Risk/Reward ratios, and Retest distances
4. Monitor win rate over 30+ day periods using the performance HUD
5. Only proceed with live alerts once consistent 60%+ win rates are achieved
6. Create separate optimized chart setups for each profitable pair/timeframe combination
### Timeframe Specifications
This indicator is specifically designed and tested for:
- **1-minute charts**: Optimal for capturing immediate institutional reactions
- **5-minute charts**: Balanced approach between noise reduction and opportunity frequency
Higher timeframes generally produce inferior results due to increased noise and reduced institutional edge during the London session window.
## Settings Configuration
### Session Timing
- **London Open/Close Hours**: Adjust for your chart's timezone
- **Rectangle End Time**: Set to 4:30 PM to stop signals before NY session close
- **Timezone Offset**: Ensure accurate London session capture
### Entry Parameters
- **Retest Distance**: 3-8 pips depending on pair volatility
- **Stop Loss Pips**: Separate settings for breakouts (10-15 pips) and retests (8-12 pips)
- **Risk/Reward Ratios**: Independent ratios for different entry types
### PineConnector Setup
- **License ID**: Your PineConnector license key
- **Symbol Override**: MT4/MT5 symbol names if different from TradingView
- **Risk Percentage**: Position size as percentage of account balance
- **Prefix/Comment**: Organize trades in terminal
## Manual Trading Limitations
Without PineConnector automation, traders face significant practical challenges:
**Settings Management**: Each currency pair requires different optimized parameters. Switching between charts means manually adjusting multiple settings each time, creating potential for errors and missed opportunities.
**Timing Sensitivity**: London Open signals can occur rapidly during high-volatility periods. Manual execution may result in slippage or missed entries.
**Multi-Pair Monitoring**: Tracking 4-11 currency pairs simultaneously while manually adjusting settings for each switch becomes impractical for most traders.
**Parameter Consistency**: Risk of using suboptimal settings when quickly switching between pairs, potentially compromising the careful optimization work.
## Recommended Workflow
1. **Historical Testing**: Use win rate HUD to identify profitable pairs and optimal parameters
2. **Demo Automation**: Test PineConnector alerts on demo accounts with optimized settings
3. **Live Implementation**: Deploy alerts only on proven profitable pair/timeframe combinations
4. **Ongoing Monitoring**: Regular review of performance metrics to maintain edge
## Risk Disclaimer
This indicator provides analysis tools and automation capabilities but does not guarantee profitable trading outcomes. Past performance does not predict future results. Users should thoroughly backtest and demo trade before risking live capital. The London session strategy works best during specific market conditions and may underperform during low volatility or unusual market environments.
## Support Requirements
Successful implementation requires:
- Basic understanding of London session market dynamics
- PineConnector subscription for automation features
- Patience for proper optimization process
- Realistic expectations about win rates and drawdown periods
This system is designed for serious traders willing to invest time in proper optimization and risk management rather than plug-and-play solutions.
Daytrading

DEE's Indicator v2 — Daily Range, Averages & Previous High/Low🇺🇸 English
This indicator is designed to help traders analyze market volatility and daily price ranges.
It includes the following features:
• 5-bar analysis: Shows high-low ranges and percentage changes of the last 5 bars.
• Daily Average Range: Calculates daily average ranges based on the last 5 bars.
• Daily AVG Lines: Plots expected top and bottom range levels based on the daily average.
• Previous Day High/Low: Automatically draws lines from the previous day's high and low.
• Timeframe Separators: Adds visual separators between days, months, and years.
• Optional arrows: Displays arrow markers for the last detected bars used in the calculation.
Use cases:
● Intraday traders can quickly measure daily progress compared to the average daily range.
● Swing traders can identify support/resistance levels from previous daily highs and lows.
● Risk managers can monitor when current volatility deviates significantly from the average.
⚠️ Notes:
The script does not generate buy/sell signals; it provides analytical tools only.
All displayed information is for visual/educational purposes and should be combined with your own trading strategy.
👉 Don’t forget to adjust the settings to suit your needs.
If you are using a multi-chart layout with different timeframes and apply this indicator to each chart, the 5-bar data will be calculated separately based on each chart’s TF. However, the “Daily AVG” section will always show the same value for the 1D timeframe.
🇺🇿 O‘zbekcha
Ushbu indikator treyderlarga bozor volatilligi va kundalik narx diapazonlarini tahlil qilishda yordam berish uchun mo‘ljallangan.
Unda quyidagi funksiyalar mavjud:
• 5-bar tahlili: So‘nggi 5 ta bar diapazoni (high–low) va foiz o‘zgarishini ko‘rsatadi.
• Kundalik o‘rtacha diapazon: So‘nggi 5 ta bar asosida o‘rtacha kundalik diapazonni hisoblaydi.
• AVG Lines: Daily AVGning yuqori va pastki diapazon darajalarini chizadi.
• Oldingi kunning High/Low darajalari: Avtomatik ravishda oldingi kunning high va low darajalarini chizadi.
• Vaqt ajratgichlari: Kunlar, oylar va yillar orasiga vizual ajratgich qo‘shadi.
• Ixtiyoriy strelkalar: Hisoblash uchun foydalanilgan so‘nggi barlarda strelka belgilarini ko‘rsatadi.
Qo‘llanilishi:
● Intraday treyderlar kundalik natijani o‘rtacha kundalik diapazon bilan tezda solishtira olishadi.
● Swing treyderlar oldingi kunning high va low darajalaridan qo‘llab-quvvatlash/qarshilik darajalarini aniqlashlari mumkin.
● Risk-menejerlar hozirgi volatillik o‘rtachadan sezilarli darajada og‘ib ketganini kuzatishlari mumkin.
⚠️ Eslatma:
Ushbu indikator sotib olish/sotish signallarini bermaydi; u faqat tahliliy vosita sifatida ishlatiladi.
Ko‘rsatilgan barcha ma’lumotlar vizual/ta’limiy maqsadlarda mo‘ljallangan bo‘lib, o‘z strategiyangiz bilan birgalikda qo‘llanilishi lozim.
👉 Sozlamalarni ehtiyojlaringizga qarab moslashtirishni unutmang.
Agar siz multi-chart rejimida turli timeframelar bilan ishlasangiz va ushbu indikatorni har bir grafikda qo‘llasangiz, 5 ta bar haqidagi ma’lumotlar har bir grafikning o‘z TFiga qarab hisoblanadi. Ammo “Daily AVG” bo‘limida esa faqat 1D timeframe uchun bir xil qiymat ko‘rsatiladi.
🇷🇺 Русский
Этот индикатор предназначен для помощи трейдерам в анализе волатильности рынка и дневных ценовых диапазонов.
Он включает в себя следующие функции:
• Анализ 5 свечей: Показывает диапазон high–low и процентные изменения последних 5 свечей.
• Средний дневной диапазон: Рассчитывает средний дневной диапазон на основе последних 5 свечей.
• Линии среднего диапазона (AVG Lines): Строит ожидаемые верхние и нижние уровни диапазона на основе среднего дневного значения.
• Максимум/минимум предыдущего дня: Автоматически наносит линии с уровнями high и low предыдущего дня.
• Разделители временных интервалов: Добавляет визуальные разделители между днями, месяцами и годами.
• Опциональные стрелки: Показывает стрелки на последних свечах, использованных в расчётах.
Применение:
● Интрадей-трейдеры могут быстро измерять дневное движение по сравнению со средним дневным диапазоном.
● Свинг-трейдеры могут определять уровни поддержки/сопротивления по максимумам и минимумам предыдущего дня.
● Риск-менеджеры могут контролировать ситуации, когда текущая волатильность значительно отклоняется от среднего.
⚠️ Примечания:
Этот индикатор не генерирует сигналы на покупку/продажу; он предоставляет только аналитические инструменты.
Вся отображаемая информация предназначена для визуальных/образовательных целей и должна использоваться совместно с вашей торговой стратегией.
👉 Не забудьте настроить параметры под свои нужды.
Если вы работаете в режиме мульти-графика с разными таймфреймами и применяете этот индикатор на каждом графике, данные по 5 барам будут рассчитываться отдельно для каждого ТФ. Однако в разделе “Daily AVG” всегда отображается одно и то же значение для таймфрейма 1D.
© Dilshod Nurmatov Shuhratovich | deetradesonline | 2025

Vantage-XVANTAGE-X – The Market. Decoded.
Your vantage point between bull & bear — clarity, precision, and high-probability trading signals.
VANTAGE-X is a high-probability trading system designed to cut through the noise and deliver clarity at a glance.
🔹 What It Does
• EMA 20 (1H), EMA 50 (4H), EMA 200 (chart timeframe) → Instant bullish/bearish signals
• VWAP → Bullish/Bearish/Neutral, based on last 5 candles for precision
• Daily Bias → Bullish or Bearish without switching charts
• Chop Filter → Detects if market is trending or choppy (last 10 candles)
• Works across all assets on TradingView — futures, forex, stocks, crypto, options
🔹 Why Traders Use It
• Eliminates chart clutter and analysis paralysis
• No more flipping timeframes — dashboard updates automatically
• Clear signals = faster decisions, cleaner trades
🚨 Subscription Access Only – Invite-Only Script
This indicator is available exclusively to subscribed members of VANTAGE-X. Access is tied to your TradingView username and managed manually by our team.
👉 Website coming soon

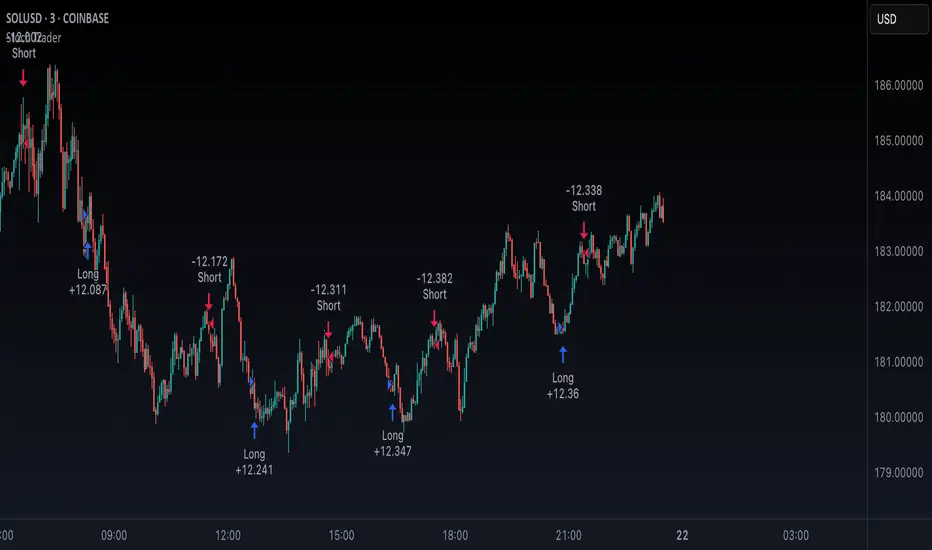
Stoch TraderSimple example strategy that has greater than 60% win rate on 1m, 3m, and 5m views. Using something as simple as this with leverage can produce decent returns within 15-30min. It's also very easy to lose money doing this.
OHLC Lines – Yesterday & Today (Minimalist Option)This indicator draws horizontal lines representing the Open, High, Low, and Close (OHLC) levels of yesterday and today directly on your chart. It automatically updates each day, showing only the lines for the previous day and the current day, keeping your chart clean and focused.
Features:
Display Yesterday’s OHLC levels.
Display Today’s OHLC levels.
Optional Minimalist Mode with customizable color, width, and line style.
Lines automatically update each day and remove old lines.
Fully customizable colors, visibility, and line width for each OHLC level.
Use Case:
Perfect for traders who want to monitor key daily price levels, identify support/resistance zones, or incorporate OHLC levels into intraday strategies.

ICT Multi-Session Hi/L/EQ
Indicator Overview: The "ICT Multi-Session Hi/L/EQ" indicator is a versatile tool designed for traders utilizing Inner Circle Trader (ICT) strategies, enabling the visualization of key price levels—High (H), Low (L), Equilibrium (EQ, the midpoint between high and low), and Optimal Trade Entry (OTE) levels at 61.8%, 70%, and 79% of the session range—across up to 6 customizable market sessions on a single chart.
Core Functionality: It dynamically tracks and plots session-specific highs, lows, and EQ, updating in real-time as price action evolves, providing traders with immediate insights into potential support, resistance, and balance zones during defined periods like the Asian, London, or New York sessions. This multi-session capability allows for comprehensive market analysis without the need for multiple indicators.
Unique OTE Auto Detection: A standout feature is the automatic detection and directional calculation of OTE levels. When a session forms a new high, OTE levels are recalculated downward from the high to the low (bearish bias), highlighting potential short entry zones. Conversely, a new low triggers upward OTE levels from the low to the high (bullish bias), signaling long opportunities. This auto-detection adapts to market momentum without manual input, making it highly unique for ICT traders seeking efficient entry signals based on range retracements. No other indicator combines this session-based auto-directionality with OTE percentages tailored for ICT methodologies.
Left-Side Trimming Innovation: Another innovative aspect is the left-side trimming option, which allows users to limit the historical extension of lines to a user-defined number of bars (e.g., the last 8 bars), reducing chart clutter and focusing attention on recent price action. This feature is particularly unique as it addresses a common issue in multi-session indicators where full historical lines can overwhelm the chart, making it ideal for scalpers or day traders who prioritize clarity.
Without trimming the left side:
And when left side trimming is enabled:
Multi-Session Customization: Support for up to 6 independent sessions, each with individual time ranges (HHMM-HHMM format), timezones, and enable/disable toggles, offers unparalleled flexibility. Traders can configure sessions for specific market phases (e.g., Asia: 2000-0000 UTC) and customize colors, line styles (solid, dashed, dotted), and label properties separately, ensuring a personalized setup for global trading environments.
Auto-Deletion at Market Close: Levels can be automatically deleted at the session's calculated market close (17:00 NY timestamp), keeping the chart clean for the next session or day, a useful feature for avoiding accumulation of outdated levels.
Label and Visual Controls: Users can toggle labels on/off, adjust text color, background color, transparency, and size (tiny, small, normal, large), with options to stick labels to the right for better visibility. This level of customization ensures the indicator integrates seamlessly with any chart style.
No External Dependencies: All calculations are performed using built-in Pine Script functions on the chart's price data, making it self-contained and reliable without needing external libraries or data sources.
Professional and Compliant Design: Developed to comply with TradingView House Rules, this indicator is original in its combination of multi-session plotting, directional OTE auto-detection, and left-side trimming, providing traders with a robust tool for ICT-based analysis.
How It Works
Session Setup: Define session times and timezones in settings; the script tracks high/low from session start.
Level Calculation: High/low update on every bar; EQ is the midpoint. OTE levels recalculate directionally upon new extremes.
Drawing Mechanism: Lines extend with user-defined padding; trimming cuts left side for cleanliness.
Update Logic: OTE direction shifts based on new high/low detection, with levels refreshed accordingly.
Deletion: Auto-deletes at session end if enabled, resetting for new sessions.
Uniqueness and Innovation
Session OTE Auto Detection: Automatically adjusts OTE direction based on new highs/lows, a feature not commonly available in other indicators, enabling hands-free bias identification.
Left-Side Trimming: Unique clutter-reduction tool that trims historical lines, improving chart readability—a rare capability in session-based indicators.
Multi-Session Support: Handles 6 sessions independently, with per-session OTE, making it a one-stop tool for global market analysis.
Directional OTE: Adapts to market bias, offering dynamic entry zones tailored to ICT strategies.
Full Customization: Extensive controls for visuals and behavior, ensuring adaptability to individual trading styles.
User Guide: How to Use the "ICT Multi-Session Hi/L/EQ" Indicator
This guide provides a comprehensive, step-by-step explanation of how to use the "ICT Multi-Session Hi/L/EQ" indicator on TradingView. The indicator is designed to help Inner Circle Trader (ICT) enthusiasts plot key price levels—High (H), Low (L), Equilibrium (EQ, the midpoint), and Optimal Trade Entry (OTE) levels at 61.8%, 70%, and 79% of the session range—across up to 6 customizable sessions. It also includes a Candle Open line for midnight or custom times. I'll break it down by settings groups, explaining each option, its purpose, how to tweak it, and tips for optimal use. All settings are accessible via the indicator's settings panel (cog icon next to the indicator name on your chart).
General Settings
These control global behaviors that apply to all sessions and levels. They allow you to customize the overall appearance and functionality of the indicator on your chart.
Line Padding (Bars Beyond Current): This integer input (default: 2, minimum: 0) extends the plotted lines beyond the current bar by the specified number of bars.
How to Use/Tweak: Increase this value (e.g., to 5) for longer forward projections of levels, useful for anticipating future price action. Decrease to 0 for no extension. It's ideal for traders who like to see levels projected ahead in volatile markets.
Tip: On lower timeframes (e.g., 5M), higher padding (4-6) helps visualize potential targets; on higher timeframes (1H), keep it low to avoid clutter.
Label Padding (Bars from Line End): An integer (default: 3, minimum: 0) that positions labels away from the end of the lines by the specified bars.
How to Use/Tweak: Adjust to move labels further right (higher value) or closer to the line end (lower value). This prevents label overlap with price action or other indicators.
Tip: If your chart has many labels, set to 5+ for better readability; use 1-2 for minimalistic setups.
Enable Left-Side Trimming: A boolean toggle (default: true) to trim lines from the left, limiting their historical extension.
How to Use/Tweak: Turn on to reduce chart clutter by showing only recent bars of the lines; turn off for full historical view. Pairs with "Left Trim Bars" for fine-tuning.
Tip: Enable for clean charts during live trading; disable for backtesting to see long-term patterns.
Left Trim Bars: An integer (default: 8, minimum: 1) specifying how many bars back from the current bar to trim lines when left trimming is enabled.
How to Use/Tweak: Set higher (e.g., 20) for more historical visibility while trimmed; lower (e.g., 4) for ultra-clean charts focusing on immediate action.
Tip: Use 8-12 for intraday trading on 15M charts; adjust based on timeframe to balance context and clarity.
Stick Labels to Right of Current Bar: A boolean toggle (default: true) to position labels at the right end of the lines.
How to Use/Tweak: Enable for labels to "stick" right, keeping them visible as the chart updates; disable for labels at the current bar position.
Tip: Keep enabled for real-time trading to avoid labels shifting left; disable for static analysis.
Delete Previous Session Lines/Labels on Market Close: A boolean toggle (default: true) to automatically delete session lines and labels at the calculated market close (17:00 NY time).
How to Use/Tweak: Enable to keep the chart clean by clearing old sessions; disable to retain historical levels for reference.
Tip: Enable for live trading to focus on active sessions; disable for educational reviews or backtesting.
Session 1 to 6 Settings
Each session has identical options, allowing independent configuration. I'll describe Session 1; replicate for others by changing the number (e.g., Session 2 uses "Session 2 Name", etc.).
Session Name: String input (default: "Asia" for Session 1) to label the session (e.g., "Asia" or "London").
How to Use/Tweak: Enter a descriptive name like "NY Open" for clarity in labels (e.g., "NY Open High").
Tip: Use short names to avoid long labels; this appears in all session labels for easy identification.
Session Time (HHMM-HHMM): Session input (default: "2000-0000" for Session 1) to define the start and end time.
How to Use/Tweak: Set the time range (e.g., "0930-1600" for NY session). Ensure start < end in 24-hour format.
Tip: Use for custom sessions like "London Kill Zone" (0800-1100); validate with the timezone setting.
Session Timezone: String selection (default: "America/New_York") from a list of options.
How to Use/Tweak: Choose the timezone matching your session (e.g., "Europe/London" for UK times).
Tip: Align with session name for accuracy; "Etc/UTC" for universal times.
Enable Session Drawings: Boolean toggle (default: true for Session 1, false for others) to activate the session's lines and labels.
How to Use/Tweak: Enable to show the session; disable to hide it without removing settings.
Tip: Enable one session at a time for focused analysis; use for multi-session overlays.
Enable EQ Line/Label: Boolean toggle (default: true) to show the EQ line and label.
How to Use/Tweak: Enable for midpoint plotting; disable to hide EQ while keeping high/low.
Tip: Useful for ICT fair value gaps; toggle off if focusing on extremes only.
Enable Labels: Boolean toggle (default: true) to show labels for high, low, EQ, and OTE levels.
How to Use/Tweak: Enable for annotated levels; disable for lines-only view.
Tip: Disable on crowded charts; customize label size for better readability.
Enable OTE Levels: Boolean toggle (default: false) to activate OTE levels (61.8%, 70%, 79%).
How to Use/Tweak: Enable for OTE plotting; disable to hide while keeping high/low/EQ.
Tip: Toggle on for entry zone identification; adjust colors for visual distinction.
Line Color: Color input (default varies by session, e.g., blue for Session 1) for lines.
How to Use/Tweak: Choose a color to differentiate sessions (e.g., green for bullish).
Tip: Use contrasting colors for multiple sessions; match your chart theme.
Line Style: String selection (default: "Dashed") from "Solid", "Dashed", "Dotted".
How to Use/Tweak: Select style for line appearance (e.g., dotted for OTE).
Tip: Use dashed for OTE to distinguish from solid high/low lines.
Label Text Color: Color input (default: white) for label text.
How to Use/Tweak: Set to contrast with background (e.g., black on white charts).
Tip: Use bright colors for visibility; match line color for cohesion.
Label Background Color: Color input (default: black) for label background.
How to Use/Tweak: Choose a semi-transparent background for readability.
Tip: Set to chart background color for subtle labels.
Label Transparency (0=opaque, 100=transparent): Integer input (default: 70) for label opacity.
How to Use/Tweak: Lower for solid labels (e.g., 0); higher for see-through (e.g., 90).
Tip: Use 50-80 for balance; 100 hides background entirely.
Label Text Size: String selection (default: "Small") from "Tiny", "Small", "Normal", "Large".
How to Use/Tweak: Choose size for label visibility (e.g., "Large" for emphasis).
Tip: "Small" for crowded charts; "Large" for main levels.
OTE 61.8% Color: Color input (default: purple) for 61.8% OTE line.
How to Use/Tweak: Customize to highlight the 61.8% level (e.g., gold for key entry).
Tip: Use distinct colors for each OTE level to differentiate (e.g., purple, orange, teal).
OTE 70% Color: Color input (default: orange) for 70% OTE line.
How to Use/Tweak: Set to a secondary color for mid-range OTE.
Tip: Coordinate with overall theme; use faded shades for less prominence.
OTE 79% Color: Color input (default: teal) for 79% OTE line.
How to Use/Tweak: Choose for the deepest OTE level (e.g., red for aggressive entries).
Tip: Make it stand out if 79% is your preferred entry zone.
Candle Open Settings
This section adds a custom open line (e.g., midnight open) with similar customization.
Use Time 1: Boolean toggle (default: true) to enable the first time setting.
How to Use/Tweak: Enable for the open line; disable to hide.
Tip: Use for midnight open in ICT setups; toggle off if not needed.
Name: String input (default: "Midnight Open") for the open line label.
How to Use/Tweak: Change to "Daily Open" or similar for context.
Tip: Keep short for clean labels.
Start Time: String input (default: "0000") for open range start.
How to Use/Tweak: Set in HHMM format (e.g., "0000" for midnight).
Tip: Ensure valid (0000-2359); pair with end time for narrow ranges.
End Time: String input (default: "0001") for open range end.
How to Use/Tweak: Set slightly after start (e.g., "0001") for precise open capture.
Tip: Use for quick ranges; start < end always.
Color: Color input (default: teal) for the open line.
How to Use/Tweak: Customize to distinguish from session lines.
Tip: Use gray for subtle open lines.
Timezone: String selection (default: "America/New_York") for the open line.
How to Use/Tweak: Choose matching your chart or session.
Tip: "Etc/UTC" for universal opens.
Enable Line/Label: Boolean toggle (default: true) for the open line/label.
How to Use/Tweak: Enable to show; disable to hide.
Tip: Use for daily opens in ICT; toggle off for session-only focus.
Enable Label: Boolean toggle (default: true) for the open label.
How to Use/Tweak: Enable for named label; disable for line-only.
Tip: Disable if labels clutter the chart.
Auto Delete at 18:00 NY: Boolean toggle (default: true) to delete at 18:00 NY.
How to Use/Tweak: Enable for cleanup; disable to retain.
Tip: Align with new day start; useful for resetting.
Stick Label to Right: Boolean toggle (default: true) for label positioning.
How to Use/Tweak: Enable for right-side labels; disable for current bar.
Tip: Keep enabled for visibility as chart updates.
Enable Left-Side Trimming: Boolean toggle (default: true) for open line trimming.
How to Use/Tweak: Enable to trim historical open line; disable for full view.
Tip: Similar to session trimming; use for clean charts.
Left Trim Bars: Integer input (default: 8) for open line trim bars.
How to Use/Tweak: Set the number of bars back to show when trimming.
Tip: Lower for more focus; higher for context.
Line Padding (Bars Beyond Current): Integer input (default: 2) for open line extension.
How to Use/Tweak: Increase for forward projection; decrease for no extension.
Tip: Match general padding for consistency.
Label Padding (Bars from Line End): Integer input (default: 3) for open label position.
How to Use/Tweak: Adjust to move label away from line end.
Tip: Higher for spaced labels; lower for compactness.
Line Style: String selection (default: "Solid") for open line style.
How to Use/Tweak: Choose "Dashed" or "Dotted" for distinction.
Tip: Use dotted for subtle opens.
Label Text Color: Color input (default: white) for open label text.
How to Use/Tweak: Set to contrast with background.
Tip: Black for light charts.
Label Background Color: Color input (default: black) for open label background.
How to Use/Tweak: Customize for visibility.
Tip: Semi-transparent for blend.
Label Transparency: Integer input (default: 70) for open label opacity.
How to Use/Tweak: 0 for opaque; 100 for transparent.
Tip: 50-80 for balance.
Label Text Size: String selection (default: "Small") for open label size.
How to Use/Tweak: "Large" for emphasis; "Tiny" for minimalism.
Tip: "Normal" for standard use.

PreviousDayHLEQCME_MINI:NQ1!
Indicator Overview: The "PreviousDayHLEQ" indicator is an essential tool for traders employing Inner Circle Trader (ICT) methodologies, designed to plot the High (H), Low (L), Equilibrium (EQ, the midpoint between high and low), and Optimal Trade Entry (OTE) levels at 61.8%, 70%, and 79% of the previous trading day's range. It provides a clear visual reference for potential support, resistance, and entry zones based on the prior day's price action, helping traders anticipate continuations or reversals in the current day. This indicator stands out by incorporating directional OTE auto-detection, adjusting levels based on whether the previous day formed a new high or low relative to the day before, offering insights into market bias without manual recalculation.
Core Functionality: It tracks and displays the previous day's high and low, calculating the EQ as the average for balance points, and OTE levels as percentage retracements of the range. The script uses a user-defined trading day definition (with timezone support) to accurately capture the day's extremes, ensuring alignment with global market sessions. This core setup allows traders to quickly identify key ICT levels like fair value gaps or liquidity pools from the prior day.
Unique OTE Auto Detection: One of the indicator's most innovative features is its automatic detection of OTE direction. If the previous day made a new high compared to the day before, OTE levels are calculated downward from the high to the low (bearish bias), highlighting potential short entries. Conversely, a new low triggers upward OTE levels from the low to the high (bullish bias), signaling long opportunities. This auto-detection is unique, as it dynamically adapts to historical price expansion without user input, a capability not found in standard previous day indicators that typically use fixed directions. It empowers ICT traders to gauge carry-over momentum from the prior day, such as in scenarios where a bullish expansion suggests buying dips to the 61.8% level.
Directional Bias Indication: Beyond plotting levels, the OTE calculation inherently indicates the previous day's bias (expansion upward or downward), providing context for current day trades. This unique bias detection helps traders align with market structure, e.g., favoring shorts if OTE is downward-oriented, enhancing decision-making in ICT frameworks like order block identification.
Left-Side Trimming Innovation: The indicator includes a highly unique left-side trimming option, allowing users to restrict the historical extension of lines to a specified number of bars (e.g., the last 8 bars). This reduces visual clutter on charts with long history, focusing attention on recent and relevant price action—a feature rarely seen in previous day indicators, where lines often span the entire chart and obscure current developments. Traders can toggle trimming on/off and adjust the bar count, making it ideal for clean, professional setups.
Customization and Visual Controls: Users can fully customize line colors (separate for high, low, EQ, and each OTE level), styles (solid, dashed, dotted), and label properties (text color, background color, transparency, size). This level of granularity ensures the indicator fits any chart theme or strategy, with options to enable/disable individual elements like EQ or OTE for minimalistic views. The stick-right label option keeps labels visible as the chart updates, preventing overlap.
Auto-Deletion at Trading Day End: Levels can be automatically cleared at the indicator's calculated market close (17:00 NY time), a unique feature that prevents accumulation of outdated data, keeping the chart fresh for the next day. This is particularly useful for day traders who reset their setups daily.
No External Dependencies: The indicator operates solely on chart price data using built-in Pine Script functions, ensuring reliability and compatibility without needing additional libraries or internet access.
How It Works
Previous Day Data Capture: The script identifies the previous trading day using the user-defined timezone and calculates high, low, EQ, and OTE levels based on that day's range.
OTE Calculation: Levels are computed as percentages of the range, with auto-detection switching direction if a new high/low was made relative to the day before.
Drawing and Trimming: Lines are plotted with user-set padding for extension, and trimming cuts the left side to focus on current action.
Update Mechanism: Levels update in real-time as the previous day's data is fixed, but the script refreshes on chart reloads or new days.
Deletion Logic: At market close, if auto-delete is enabled, all elements are removed to prepare for the next cycle.
Uniqueness and Innovation
Session OTE Auto Detection: Automatically determines OTE direction based on previous day's high/low expansion, a rare feature that provides bias insights not available in basic previous day high/low indicators, aiding ICT traders in identifying entry zones with market context.
Left-Side Trimming: This innovation allows customizable historical line length, solving chart clutter issues unique to previous day indicators that typically show full history, enhancing usability for live trading.
Directional OTE with Multi-Level Support: Combines auto-bias detection with three OTE percentages (61.8%, 70%, 79%), offering more granular entry options than single-level tools, tailored for ICT's focus on range retracements.
Independent Customization per Element: Separate controls for high, low, EQ, and OTE colors/styles, plus transparency and size, provide unmatched flexibility compared to rigid indicators.
Auto-Deletion for Cleanliness: Unique cleanup at market close prevents level buildup, a practical feature for multi-day analysis not commonly implemented in similar tools.
How to Use It
Setup: Add to chart, configure timezone (e.g., "America/New_York"), and enable the indicator.
Customization: Adjust line colors (e.g., blue for high), styles (dashed for OTE), and enable trimming (8 bars for focus).
Interpretation: Use OTE for entries (e.g., buy at 61.8% in bullish bias); EQ for reversion.
Tips: Test on historical data; combine with ICT concepts like CISD, FVG etc.
This indicator elevates ICT trading with its auto-detection and trimming. Use with risk management; trading carries risk
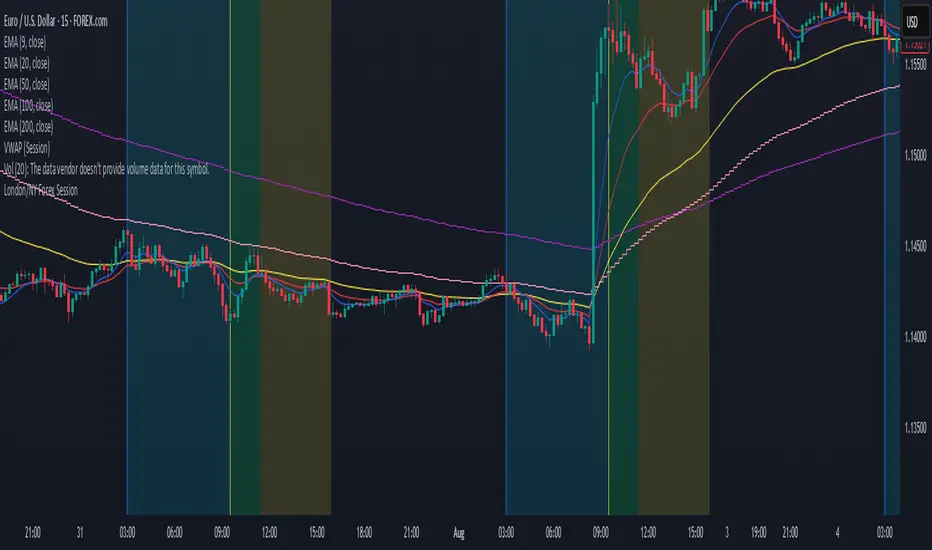
London/NY Forex SessionDesigned for Forex traders who want a clear view of market dynamics.
This tool highlights the most active trading windows of the day, helping you align with institutional moves and avoid low-liquidity periods.
Apex Edge – Liquidity RaiderApex Edge – Liquidity Raider
The Predator That Hunts Where Retail Never Looks
The Liquidity Raider is not your average liquidity line plotter.
This is an institutional-grade hunting system that tracks the pools of liquidity Smart Money algos stalk — and tells you exactly when price is circling in for the strike.
Where most retail tools simply mark lines, this one acts like a predator:
Scans the chart dynamically to detect clustered highs & lows (pivot-based liquidity zones).
Filters noise with sensitivity & price rounding so you only get real liquidity levels — not every random swing.
Plots live BSL (Buy-Side Liquidity) & SSL (Sell-Side Liquidity) lines in clean dotted format.
Auto-deletes levels when swept, so your chart stays clean and focused.
Triggers directional arrows when price comes within your specified % distance to the target liquidity pool — before the market moves.
EMA confluence layer lets you align with institutional flow (customizable Fast & Slow EMAs).
Core Power
Cluster Logic – Finds high-probability liquidity zones using repeated pivot levels.
Sweep Awareness – Lines vanish the moment liquidity is taken, keeping focus on the next pool.
Proximity Strike Detection – Arrow signals only when price is within striking range.
Directional Clarity – Red arrows = targeting BSL, Green arrows = targeting SSL.
Scalable Across Timeframes – Adapts to your chart’s timeframe with dynamic lookback scaling.
Institutional Flow Filter – Optional EMA confirmation keeps you aligned with the real trend.
How to Use
Identify liquidity pools – Dotted green = buy-side, dotted red = sell-side.
Watch proximity arrows – These mean price is in range and hunting that pool.
Align with EMA bias – Enter only in the direction of institutional momentum.
Target the sweep – Your take profit is where the liquidity is resting.
Why Liquidity Raider Wins
This is not a lagging signal system.
It’s a real-time, clean, predictive tool designed to mimic the targeting logic of high-frequency algos.
By removing swept levels and focusing only on the next available pools, Liquidity Raider keeps you one step ahead of the crowd — and perfectly positioned for the kill shot.

Previous Day High/Low Levels [OWI]📘 How to Use the “Previous Day High/Low Levels ” Indicator
This TradingView indicator automatically tracks and displays the previous day's high and low during the Regular Trading Hours (RTH) session. It’s perfect for traders who want to visualize key support/resistance levels from the prior day in futures like CME_MINI:NQ1! and COMEX:GC1! .
🛠 Setup Instructions
1. Customize RTH Session Times
- In the Settings panel, adjust the following under the Levels group:
- RTH Start Hour and RTH Start Minute: Default is 9:30 AM (New York time).
- RTH End Hour and RTH End Minute: Default is 4:15 PM.
- These define the active trading session used to calculate the day’s high and low.
2. Toggle Labels
- Use the Show PDH/PDL Labels checkbox to display or hide the “PDH” and “PDL” labels on the chart.
- Labels appear after the session ends and follow price dynamically.
📊 What the Indicator Does
- During the RTH session:
- Tracks the highest and lowest price of the day.
- After the session ends:
- Draws horizontal lines at the previous day’s high (green) and low (red).
- Optionally displays labels ("PDH" and "PDL") at those levels.
- Lines extend into the current day to help identify potential support/resistance zones.
✅ Best Practices
- Use this indicator on intraday timeframes (e.g., 5m, 15m, 1h) for best results.
- Combine with volume or price action analysis to confirm reactions at PDH/PDL levels.
- Adjust session times if trading non-US markets or custom hours.

TSD Quantum [Moeinudin Montazerfaraj] 🔸 "TSD" stands for **Trend 1-2-3 and Supply & Demand**, which is the foundation of the trading style this indicator is built upon.
🔹 TSD Quantum is a specialized indicator designed exclusively for day traders who trade EURUSD, XAUUSD (Gold), and DAX40 on the 1H, 15M, and 5M timeframes using a Supply & Demand-based strategy.
This indicator is **not suitable for other symbols** and has been tailored specifically for these three assets to ensure high precision and effectiveness.
---
### 🔍 Key Features:
✅ **Trading Checklist Panel**
A built-in checklist helps you track every rule in your trading plan. If even one condition is left unchecked, the system highlights it in red and marks the trade as "Not Allowed." This feature enhances trading discipline.
✅ **Spread & ATR Control Panel**
Supports both auto-calculated and fixed values for spread and ATR. This is especially helpful when placing stop-losses quickly and accurately.
✅ **Inside & Outside Candle Detection**
A dedicated panel highlights whether the last candle is inside or outside. Hovering your mouse over the chart elements automatically colorizes the candles:
🔵 Blue = Outside candle
🔴 Red = Inside candle
Also displays the high/low of the latest outside bar.
✅ **Weekly Trade Stats Panel**
Custom-built for the mentioned three assets. You can enter your trades using either fixed risk or floating risk models.
✅ **Performance Metrics**
Helps you build and adjust a floating risk model—so you don’t have to enter every trade with the same lot size. Improves risk management across multiple trades.
✅ **Base Candles Display**
Grey and white base candles are marked based on supply and demand zones.
✅ **EOT Candles**
Candles with a green dot underneath indicate valid EOT opportunities for potential move-outs.
✅ **RC (Rejection Candle) Detection**
RC candles are automatically detected to alert you of potential traps or weaknesses during Supply/Demand formations.
---
### ⚠️ Disclaimer
This indicator does **not** issue buy/sell signals and **cannot guarantee profit or prevent loss**. It is a **tool for discretionary trading**, not an automated expert advisor.
All decisions must be made by the trader based on their own strategy and risk tolerance.
This is the **latest tested version** of TSD Quantum. All features have been validated and function as intended. Future updates will be provided if needed.
---
🙏 Thank you for reviewing this script. We hope it becomes a valuable addition to your day trading toolkit!

Daily Weekly Monthly Highs & Lows [Dova Lazarus]Daily Weekly Monthly Highs & Lows
📊 Overview
This Pine Script indicator displays key support and resistance levels by plotting the highs and lows from Daily, Weekly, and Monthly timeframes on your current chart. It's designed as an educational tool to help traders understand multi-timeframe analysis and identify significant price levels.
🎯 Key Features
Multi-Timeframe Support & Resistance
- Daily Levels: Shows previous daily highs and lows
- Weekly Levels: Displays weekly highs and lows
- Monthly Levels: Plots monthly highs and lows
- Smart Display: Only shows relevant timeframes based on your current chart timeframe
Fully Customizable Appearance
- Individual Colors: Set unique colors for each timeframe
- Line Styles: Choose between Solid, Dashed, or Dotted lines
- Line Width: Adjust thickness from 1-4 pixels
- Lookback Periods: Control how many historical levels to display
User-Friendly Options
- Enable/Disable: Toggle any timeframe on/off
- Line Extension: Option to extend lines into the future
- Clean Interface: Organized settings groups for easy configuration
🔧 Settings
Timeframes Group
- Show Daily/Weekly/Monthly Levels: Enable or disable each timeframe
- Lookback Periods: Number of historical levels to display (1-10)
Line Settings Group
- Color: Choose custom colors for each timeframe
- Style: Select line appearance (Solid/Dashed/Dotted)
- Width: Set line thickness (1-4 pixels)
Display Options Group
- Extend Lines Forward: Project lines 20 bars into the future
📈 How to Use
1. Add to Chart: Apply the indicator to any timeframe chart
2. Configure Timeframes: Enable the timeframes you want to see
3. Customize Appearance: Set colors and line styles for easy identification
4. Identify Levels: Use the plotted levels as potential support/resistance zones
5. Plan Trades: Look for price reactions at these key levels
💡 Trading Applications
- Support & Resistance: Identify key price levels where reversals may occur
- Entry Points: Look for bounces or breaks at these levels
- Stop Loss Placement: Use levels to set logical stop losses
- Target Setting: Previous highs/lows can serve as profit targets
- Multi-Timeframe Analysis: Understand the bigger picture context
🎓 Educational Value
This indicator is perfect for:
- Learning Pine Script: Clean, well-commented code structure
- Understanding Multi-Timeframe Analysis: See how different timeframes interact
- Practicing Technical Analysis: Identify key support/resistance concepts
- Code Study: Full variable names and detailed comments for learning
⚙️ Technical Details
- Version: Pine Script v6
- Overlay: True (plots directly on price chart)
- Max Lines: 500 (handles multiple timeframes efficiently)
- Compatibility: Works on all timeframes (shows relevant levels only)
🔍 What Makes This Different
- Educational Focus: Designed for learning with clear code structure
- Simplified Interface: Easy-to-use settings without overwhelming options
- Visual Clarity: Clean line display with customizable appearance
- Practical Application: Real trading tool, not just a demonstration
📋 Requirements
- TradingView account (any plan)
- Basic understanding of support/resistance concepts
- Any chart timeframe (indicator adapts automatically)
🚀 Quick Start
1. Add indicator to your chart
2. Default settings work great out of the box
3. Customize colors if desired (Green=Daily, Orange=Weekly, Red=Monthly)
4. Watch for price reactions at the plotted levels
5. Use as part of your technical analysis toolkit
---
*This indicator is designed as an educational tool and should be used in conjunction with other forms of analysis. Past performance does not guarantee future results.*

Fair Value MSThis indicator introduces rigid rules to familiar concepts to better capture and visualize Market Structure and Areas of Support and Resistance in a way that is both rule-based and reactive to market movements.
Typical "Market Structure" or "Zig-Zag" methods determine swing points based on fixed thresholds (length or percentage). While this does provide rigid structure, the results may be lagging or confusing due to the timing, since it is fixed to static parameters.
I believe the concept of Fair Value Gaps can solve this problem.
As you will notice, there are no length settings in this indicator.
> FVG Market Structure
Fair Value Gaps are a well known concept used to indicate directional intent, forming when price moves aggressively in one direction, leaving behind an imbalance between buyers and sellers. While the term FVG was popularized by ICT, the underlying concept predates them, known historically as imbalances, inefficiencies, or liquidity voids in institutional trading.
Note: For simplicity, in this indicator they'll be called FVGs.
By reading into this, we are able to clearly and rigidly define market structure simply by "looking" at the chart, using objective price events rather than subjective interpretation, or lengths.
By using FVGs to determine structure direction, the length, and speed of identification lies entirely on the market. If an FVG Down occurs immediately after a New Higher High forms, it is reasonable to assume there was a seller at that point, so the script would indicate a New Swing High.
The script is NOT stuck, waiting for a % retrace, or # bars to pass to identify it as such.
Sometimes the market is in a steady trend in a single direction and no FVGs form; therefore, no structure forms. -> Why would we try to impose structure on a clear trend?
Ultimately, the FVG Structure Method uses real reactions from the market to determine Market structure, and is not fixed to specific parameters.
As with other market structure indicators, "Market Structure Breaks" are still identifiable when price moves outside the most recent swing points.
These are helpful to indicate larger direction. In the following section you will see how these help us determine when we should start the search for an "Area of Interest (AOI)".
> Areas of Interest (AOIs)
"Area of Interest (AOI)" is a generalized term, and could refer to many types of zones you might recognize under different names. While the AOIs in this indicator are specialized in their own way, I have chosen to simply use the term "Area of Interest" because it’s more important to understand how they behave and why they exist than to focus on what they’re called.
The goal of an AOI is to point out reasonable areas where buyers or sellers may be staging, as is typical with support and resistance.
In order to reasonably identify these areas, we look for cause and effect relationships. When considering these relationships, it's easier to understand the placement of the points to define each zone.
(Buyer Examples)
Cause: Strong Buyers step in at Swing Low
Effect: Fair Value Gap Forms
Cause: Sustained Buying Pressure
Effect: Market Structure Breaks
In this example, The zone is drawn from the Swing Low, to the Bottom of the FVG closest to the swing point.
In theory, the participation at the swing point was strong and aggressive enough to create the FVG imbalance. Which then found acceptance and continued into a Market Structure Break. So with these AOIs, we are trying to locate the aggressive Buyers or Sellers which were positioned BEFORE the FVG.
These Zones are intended to act as areas to look for reactions from market participants, to judge where price may be going. When revisiting these zones, we look for a reaction or a break, to further provide us information to if the buyers or sellers are still there.
As seen in the screenshot above, The information we gain is not from the creation of these zones, but from the behavior we witness when these zones are revisited.
Technical Note: In this indicator, Market Structure Breaks are only considered when price closes outside the recent swing points. Wicks are not considered as confirmation, therefore are not used to detect structural breaks.
Inside each AOI you can optionally display a readout of the volume which accumulated during the time starting at the swing point and going until the closing bar of the FVG.
Note: We are counting volume until the closing bar of the FVG since the FVG is a 3 bar formation, and aggressive volume is required throughout to create the imbalance.
There are multiple FVGs that typically occur in a single direction, but we do not look to every single one to be indicative of structure, only the first FVG in the opposite direction of the previous direction (which is determined by previous FVGs)
You will probably notice, the AOIs do not form from the closest swing or FVG to the break, this is because we are targeting larger directional changes to draw these AOIs from.
Since they do not always happen perfectly every time, the AOI formation waits for an FVG to occur AND a Market structure break to happen. One without the other will result in no Zone displaying.
> Reflection Lines
While they may seem slightly redundant, Reflection Lines serve as reminders of previous support and resistance pivots. They are drawn at the same Pivots where and AOI is formed, and extend beyond the mitigation of the AOI.
These lines are often points of price to look for "Support Flips", a re-test pattern where price trades through previous support (or resistance) then returns to it and rejects, continuing into a larger move or trend.
Their namesake is based on the behavior of price, "reflecting" at these levels.
The Reflection lines are simple and change color based on price's location.
If price is above, we would typically look to a reflection line in with support in mind.
As a basic filter, these lines use an average price to determine their color, this way they will not change their color as frequently in choppy situations.
> Session Start/End Lines
For analysis purposes and trade review, it is helpful to analyze with context.
For that reason, I have implemented start and end session lines into the indicator, these are helpful when reviewing historical charts to not provide additional context.
By default, they are set to the NYSE Session, but can be changed to fit any needs.
These lines are not advanced, and simply draw a line as the chart passes the start and end of the sessions. It's very likely that you may need to adjust the session for your specific needs.
Note: The Timezone can be adjusted within the code if needed. By Default, the indicator uses "America/New_York" Timezone.
> Conclusion
If you’ve ever felt like your structure tools were confusing or lagging, drawing zones too late, or zones that simply don't make sense, this should feel like a breath of fresh air.
By removing arbitrary length settings and instead using FVGs to define structure and as a basis for AOIs, you're getting a more accurate look at what price is doing and where it's reacting from.
This indicator is rule-based, reactive, and aims to keep things logical without fluff or false confidence.
Enjoy!

day trading check indicatorDay Trading Check Indicator
By Trades per Minute · Creator: Trader Malik
Overview
The Day Trading Check Indicator is an on‐chart status panel that gives you a quick “go/no-go” snapshot of four key metrics—MACD, VWAP, Float, and Bearish Sell-Off—directly in TradingView’s top-right corner. It’s designed for fast decision-making during high-velocity intraday sessions, letting you instantly see whether each metric is “bullish” (green) or “bearish” (red), plus live float data.
What It Shows
Column Description
Metric The name of each metric: MACD, VWAP, Float, Bearish Sell-Off
Status/Value A color-coded status (“GREEN”/“RED” or “YES”/“NO”) or the float value formatted in K/M/B
Metrics & Calculations
MACD (1-Minute)
Calculation: Standard MACD using EMA (12) – EMA (26) with a 9-period signal line, all fetched from the 1-minute timeframe via request.security().
Status:
GREEN if MACD ≥ Signal
RED if MACD < Signal
VWAP (Session-Anchored)
Calculation: Built-in session VWAP (ta.vwap(close)) resets each new trading session.
Status:
GREEN if current price ≥ VWAP
RED if current price < VWAP
Float
Calculation: Retrieves syminfo.shares_outstanding_float (total float), then scales it into thousands (K), millions (M), or billions (B), e.g. “12.3 M.”
Display: Always shown as the absolute float value, white on semi-transparent black.
Bearish Sell-Off
Calculation: Checks the last five 1-minute bars for any “high-volume down” candle (volume above its 20-bar SMA and close < open).
Status:
YES if at least one such bar occurred in the past 5 minutes
NO otherwise
Key Features
Dynamic Table: Automatically shows only the metrics you enable via the Display Options group.
Size Selector: Choose Small, Medium, or Large text for easy visibility.
Clean Styling: Distinct header row with custom background, consistent row shading, centered status text, and a subtle gray border.
Lightweight Overlay: No cluttering plots—just a concise status panel in the corner.
Published by Trader Malik / Trades per Minute
Version: Pine Script v5

Super MTF Clouds (4x3 Pairs)Overview:
This script is based on Ripster's MTF clouds, which transcends the standard moving average cloud indicator by offering a powerful and deeply customizable Multi-Timeframe (MTF) analysis. Instead of being limited to the moving averages of your current charts from the current timeframe, this tool allows you to project and visualize the trend and key support/resistance zones from up to 4 different timeframes simultaneously. User can input up to 6 different EMA values which will form 3 pairs of EMA clouds, for each of the timeframes.
The primary purpose is to provide traders with immediate confluence. By observing how price interacts with moving average clouds from higher timeframes (e.g., Hourly, Daily, Weekly), you can make more informed decisions on your active trading timeframe (e.g., 10 Minute). It's designed as a complete MTF Cloud toolkit, allowing you to display all necessary MTFs in a single script to build a comprehensive view of the market structure without having to flick to different timeframe to look for cloud positions.
Key features:
Four Independent Multi-Timeframe Slots: Each slot can be assigned any timeframe available on TradingView (e.g., D, W, M, 4H).
Three MA Pairs Per Timeframe: For each timeframe, configure up to three separate MA clouds (e.g., a 9/12 EMA pair, a 20/50 EMA pair, and a 100/200 SMA pair).
Complete Customisation: For every single moving average (24 in total), you can independently control:
MA Type: Choose between EMA or SMA.
Length: Any period you require.
Line Color: Full colour selection.
Line Thickness: Adjust the visual weight of each line.
Cloud Control: For every pair (12 in total), you can set the fill colour and transparency.
How To Use This Script:
This tool is best used for confirmation and context. Here are some practical strategies that one can adopt:
Trend Confluence: Before taking a trade based on a signal on your current timeframe, glance at the higher timeframe clouds. If you see a buy signal on the 15-minute chart and the price is currently trading above a thick, bullish Daily cloud, the probability of that trade succeeding is significantly higher. Conversely, shorting into strong HTF support is a low-probability trade.
Dynamic Support & Resistance: The edges of the higher timeframe clouds often act as powerful, dynamic levels of support and resistance. A pullback to the 4-Hour 50 EMA on your 15-minute chart can be a prime area to look for entries in the direction of the larger trend.
Gauging Market Regimes: Use the toggles in the settings to quickly switch between different views. You can have a "risk-on" view with short-term clouds and a "macro" view with weekly and monthly clouds. This helps you adapt your trading style to the current market conditions.
Key Settings:
1. Global Setting
Source For All MAs: This determines the price data point used for every single moving average calculation.
Default: hl2 (an average of the High and Low of each bar). This gives a smooth midpoint price.
Options: You can change this to Close (the most common method), Open, High, Low, or ohlc4 (an average of the open, high, low, and close), among others.
Recommendation: For most standard trend analysis, the default hl2 is the common choice.
2. The Timeframe Group Structure
The rest of the settings are organized into four identical, collapsible groups: "Timeframe 1 Settings" through "Timeframe 4 Settings". Each group acts as a self-contained control panel for one multi-timeframe view.
Within each timeframe group, you have two master controls:
Enable Timeframe: This is the main power switch for the entire group. Uncheck this box to instantly hide all three clouds and lines associated with this timeframe. This is perfect for quickly decluttering your chart or focusing on a different set of analyses.
Timeframe: This dropdown menu is the heart of the MTF feature. Here, you select the higher timeframe you want to analyse (e.g., 1D for Daily, 1W for Weekly, 4H for 4-Hour). All calculations for the three pairs within this group will be based on the timeframe you select here.
3. Pair-Specific Controls
Inside each timeframe group, there are three sections for "Pair 1", "Pair 2", and "Pair 3". These control each individual moving average cloud.
Enable Pair: Just like the master switch for the timeframe, this checkbox turns a single cloud and its two MA lines on or off.
For each pair, the settings are further broken down:
Moving Average Lines (A and B): These two rows control the two moving averages that form the cloud. 'A' is typically used for the shorter-period MA and 'B' for the longer-period one.
Type (A/B): A dropdown menu to select either EMA (Exponential Moving Average) or SMA (Simple Moving Average). EMAs react more quickly to recent price changes, while SMAs are smoother and react more slowly.
Length (A/B): The lookback period for the moving average (e.g., 21, 50, 200).
Color (A/B): Sets the specific colour of the MA line itself on your chart.
Cloud Fill Settings
Fill Color: This controls the colour of the shaded area (the "cloud") between the two moving average lines. For a consistent look, you can set this to the same colour as your shorter MA line.
Transparency: Controls how see-through the cloud is, on a scale of 0 to 100. 0 is a solid, opaque colour, while 100 is completely invisible. The default of 85 provides a light, "cloud-like" appearance that doesn't obscure the price action.
----------------------------------------------------------------------
If anything is not clear please let me know!

Auto-Fibonacci Levels [ChartWhizzperer]Auto-Fibonacci Levels
Discover one of the most elegant and flexible Fibonacci indicators for TradingView – fully automatic, tastefully understated, and built entirely in Pine Script V6.
Key Features:
- Automatically detects the most recent swing high and swing low.
- Plots Fibonacci retracement levels and extensions (including 161.8%, 261.8%) perfectly aligned
to the prevailing trend.
- Distinctive, dashed lines with crystal-clear price labels right at the price scale
for maximum clarity.
- Line length and label offset are fully customisable for your charting preference.
- Absolutely no repainting: Only confirmed swings are used for reliable signals.
- Parameter: "Swing Detection Length"
The “Swing Detection Length” parameter determines how many bars must appear to the left and right of a potential high or low for it to be recognised as a significant swing point.
- Higher values make the script less sensitive (only major turning points are detected).
- Lower values make it more responsive to minor fluctuations (more fibs, more signals).
For best results, adjust this setting according to your preferred timeframe and trading style.
Pro Tip:
Fibonacci levels refresh automatically whenever a new swing is confirmed.
Ideal for price action enthusiasts and Fibonacci purists alike.
Licence:
// Licence: CC BY-NC-SA 4.0 – Non-commercial use only, attribution required.
// © ChartWhizzperer
SAFE Leverage Pro x50Safe Leverage Pro x50 — Safe leverage based on timeframes
Description:
Safe Leverage Pro x50 is an indicator designed to help traders choose prudent and realistic leverage, tailored to the timeframe being traded and the asset chosen.
Based on rigorous statistical research, this indicator provides a visual recommendation of the maximum typical leverage by timeframe and automatically suggests a more conservative value (by default, half) for trading with greater peace of mind and risk control.
* The goal is not for the indicator to make decisions for you, but rather to support your pre-defined entry strategies, allowing you to clearly understand how much leverage you can use without compromising your account against normal price fluctuations.
*The indicator does not calculate based on real-time volatility or ATR, but rather relies on statistical historical patterns obtained by analyzing price behavior after entry, differentiating between average movements in long and short entries by timeframe.
Important: Before following the recommendations of this indicator, check the maximum leverage your broker or exchange allows for the asset you are trading, as it can vary significantly between platforms.
* Philosophy behind the indicator:
This project arises as a response to the simplistic discourse that condemns leverage without distinguishing nuances.
Leverage is not intrinsically bad. What is dangerous is leveraging without method, without awareness, and without risk management.
Safe Leverage Pro x50 is designed to change that narrative:
** It's not about whether or not to use leverage, but when, how much, and how to use it intelligently.

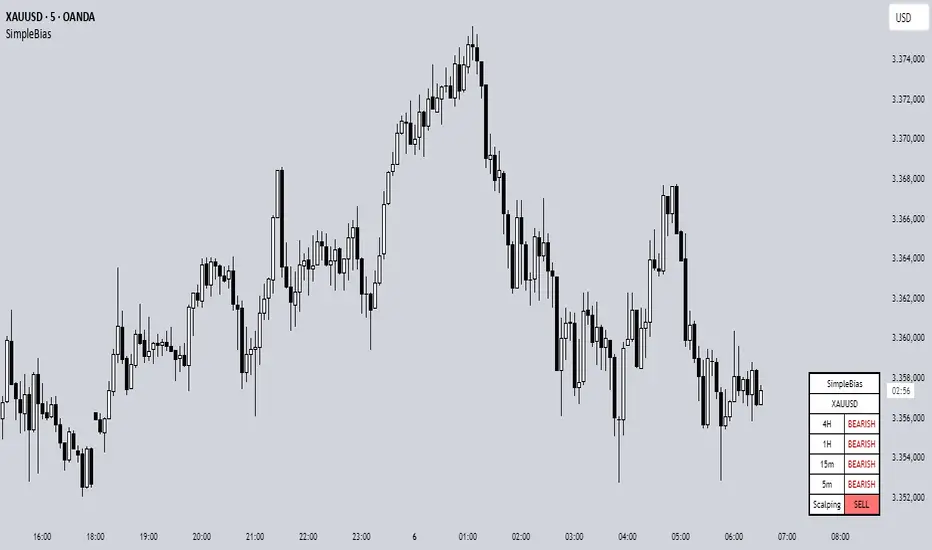
SimpleBiasSimpleBias - Multi-Timeframe Bias Analysis Indicator
Overview
SimpleBias is a comprehensive multi-timeframe bias analysis indicator designed to help traders make informed trading decisions by displaying market bias across multiple timeframes in a clean, organized table format.
Key Features
Multi-Timeframe Analysis
8 Timeframes Supported : 1M, 1W, 1D, 4H, 1H, 15m, 5m, 1m
Adaptive Display : Shows only relevant timeframes based on current chart timeframe
Real-time Bias Detection : Compares current open price with previous period's open price
Signal Generation
Day Trading Mode : Ideal for 15-minute timeframe analysis
Scalping Mode : Optimized for 5-minute timeframe trading
Signal OFF : Pure bias analysis without trade signals
Customization Options
Theme Support : Light mode and dark mode with automatic color adaptation
Position Control : Table can be positioned at top-right, middle-right, or bottom-right
Size Options : Tiny, small, or normal text size
Color Customization : Full control over bias colors, signal colors, and interface elements
Transparency : Optional transparent background for cleaner chart appearance
How It Works
Bias Calculation
The indicator determines market bias by comparing the current timeframe's open price with the previous period's open price:
BULLISH : Current open > Previous open
BEARISH : Current open < Previous open
NEUTRAL : Current open = Previous open
Adaptive Timeframe Display
The indicator intelligently shows only relevant timeframes based on your current chart:
On 1M chart: Shows 1M bias only
On 1W chart: Shows 1M, 1W bias
On 1D chart: Shows 1M, 1W, 1D bias
And so on...
Signal Logic
Day Trading : Compares current price with 4H open price
Scalping : Compares current price with 1H open price
Usage Instructions
Add to Chart : Apply the indicator to any timeframe chart
Configure Settings :
- Choose table position and text size
- Select signal mode (OFF/Day Trade/Scalping)
- Customize colors and theme
Interpret Results :
- Green/Blue text = Bullish bias
- Red text = Bearish bias
- Gray text = Neutral bias
Customization Guide
Theme Settings
Light Mode : Traditional white background with dark text
Dark Mode : Dark background with light text, optimized for dark charts
Transparent Background : Clean overlay without background color
Color Schemes
Bias Colors : Separate customization for bullish, bearish, and neutral bias
Signal Colors : Distinct colors for buy, sell, and neutral signals
Interface : Control table background and border colors
Best Practices
For Day Trading
Use 15-minute or 1-hour charts
Enable "Day Trade" signal mode
Focus on 4H and higher timeframe bias alignment
For Scalping
Use 5-minute charts
Enable "Scalping" signal mode
Watch for 1H and 4H bias alignment
For Swing Trading
Use 4H or daily charts
Keep signal mode OFF
Focus on weekly and monthly bias alignment
Important Notes
This indicator is for educational and analysis purposes only
Not financial advice - always do your own research
Past performance does not guarantee future results
Risk management is essential in all trading activities
Technical Specifications
Pine Script Version : v6
Overlay : True (displays on price chart)
Performance : Optimized with cached security requests
Compatibility : Works on all TradingView timeframes and instruments
---
SimpleBias - Indikator Analisis Bias Multi-Timeframe
Gambaran Umum
SimpleBias adalah indikator analisis bias multi-timeframe yang komprehensif, dirancang untuk membantu trader membuat keputusan trading yang tepat dengan menampilkan bias pasar di berbagai timeframe dalam format tabel yang bersih dan terorganisir.
Fitur Utama
Analisis Multi-Timeframe
8 Timeframe Didukung : 1M, 1W, 1D, 4H, 1H, 15m, 5m, 1m
Tampilan Adaptif : Hanya menampilkan timeframe yang relevan berdasarkan timeframe chart saat ini
Deteksi Bias Real-time : Membandingkan harga open saat ini dengan harga open periode sebelumnya
Mode Sinyal Trading
Mode Day Trading : Ideal untuk analisis timeframe 15 menit
Mode Scalping : Dioptimalkan untuk trading timeframe 5 menit
Mode OFF : Analisis bias murni tanpa sinyal trading
Opsi Kustomisasi
Dukungan Theme : Mode terang dan gelap dengan adaptasi warna otomatis
Kontrol Posisi : Tabel dapat diposisikan di kanan-atas, kanan-tengah, atau kanan-bawah
Opsi Ukuran : Ukuran teks kecil, sedang, atau normal
Kustomisasi Warna : Kontrol penuh atas warna bias, warna sinyal, dan elemen interface
Transparansi : Background transparan opsional untuk chart yang lebih bersih
Cara Kerja
Perhitungan Bias
Indikator menentukan bias pasar dengan membandingkan harga open timeframe saat ini dengan harga open periode sebelumnya:
BULLISH : Open saat ini > Open sebelumnya
BEARISH : Open saat ini < Open sebelumnya
NEUTRAL : Open saat ini = Open sebelumnya
Petunjuk Penggunaan
Tambahkan ke Chart : Terapkan indikator ke chart timeframe apapun
Konfigurasi Settings :
- Pilih posisi tabel dan ukuran teks
- Pilih mode sinyal (OFF/Day Trade/Scalping)
- Sesuaikan warna dan theme
Interpretasi Hasil :
- Teks hijau/biru = Bias bullish
- Teks merah = Bias bearish
- Teks abu-abu = Bias neutral
Best Practices
Untuk Day Trading
Gunakan chart 15 menit atau 1 jam
Aktifkan mode sinyal "Day Trade"
Fokus pada alignment bias timeframe 4H ke atas
Untuk Scalping
Gunakan chart 5 menit
Aktifkan mode sinyal "Scalping"
Perhatikan alignment bias 1H dan 4H
Catatan Penting
Indikator ini hanya untuk tujuan edukasi dan analisis
Bukan nasihat keuangan - selalu lakukan riset sendiri
Performa masa lalu tidak menjamin hasil masa depan
Manajemen risiko sangat penting dalam semua aktivitas trading
SimpleBias membantu trader mempertahankan kesadaran terhadap bias pasar di berbagai timeframe, mendukung timing dan pengambilan keputusan yang lebih baik dalam strategi trading mereka.
Cumulative Intraday Volume with Long/Short LabelsThis indicator calculates a running total of volume for each trading day, then shows on the price chart when that total crosses levels you choose. Every day at 6:00 PM Eastern Time, the total goes back to zero so it always reflects only the current day’s activity. From that moment on, each time a new candle appears the indicator looks at whether the candle closed higher than it opened or lower. If it closed higher, the candle’s volume is added to the running total; if it closed lower, the same volume amount is subtracted. As a result, the total becomes positive when buyers have dominated so far today and negative when sellers have dominated.
Because futures markets close at 6 PM ET, the running total resets exactly then, mirroring the way most intraday traders think in terms of a single session. Throughout the day, you will see this running total move up or down according to whether more volume is happening on green or red candles. Once the total goes above a number you specify (for example, one hundred thousand contracts), the indicator will place a small “Long” label at that candle on the main price chart to let you know buying pressure has reached that level. Similarly, once the total goes below a negative number you choose (for example, minus one hundred thousand), a “Short” label will appear at that candle to signal that selling pressure has reached your chosen threshold. You can set these threshold numbers to whatever makes sense for your trading style or the market you follow.
Because raw volume alone never turns negative, this design uses candle direction as a sign. Green candles (where the close is higher than the open) add volume, and red candles (where the close is lower than the open) subtract volume. Summing those signed volume values tells you in a single number whether buying or selling has been stronger so far today. That number resets every evening, so it does not carry over any buying or selling from previous sessions.
Once you have this indicator on your chart, you simply watch the “summed volume” line as it moves throughout the day. If it climbs past your long threshold, you know buyers are firmly in control and a long entry might make sense. If it falls past your short threshold, you know sellers are firmly in control and a short entry might make sense. In quieter markets or times of low volume, you might use a smaller threshold so that even modest buying or selling pressure will trigger a label. During very active periods, a larger threshold will prevent too many signals when volume spikes frequently.
This approach is straightforward but can be surprisingly powerful. It does not rely on complex formulas or hidden statistical measures. Instead, it simply adds and subtracts daily volume based on candle color, then alerts you when that total reaches levels you care about. Over several years of historical testing, this formula has shown an ability to highlight moments when intraday sentiment shifts decisively from buyers to sellers or vice versa. Because the indicator resets every day at 6 PM, it always reflects only today’s sentiment and remains easy to interpret without carrying over past data. You can use it on any intraday timeframe, but it works especially well on five-minute or fifteen-minute charts for futures contracts.
If you want a clear gauge of whether buyers or sellers are dominating in real time, and you prefer a rule-based method rather than a complex model, this indicator gives you exactly that. It shows net buying or selling pressure at a glance, resets each session like most intraday traders do, and marks the moments when that pressure crosses the levels you decide are important. By combining a daily reset with signed volume, you get a single number that tells you precisely what the crowd is doing at any given moment, without any of the guesswork or hidden calculations that more complicated indicators often carry.

Momentum Fusion v1Momentum Fusion v1
Overview
Momentum Fusion v1 (MFusion) is a multi-oscillator indicator that combines several components to analyze market momentum and trend strength. It incorporates modified versions of classic indicators such as PVI (Positive Volume Index), NVI (Negative Volume Index), MFI (Money Flow Index), RSI, Stochastic, and Bollinger Bands Oscillator. The indicator displays a histogram that changes color based on momentum strength and includes "FUSION🔥" signal labels when extreme values are reached.
Indicator Settings
Parameters:
EMA Length – Smoothing period for the moving average (default: 255).
Smoothing Period – Internal calculation smoothing parameter (default: 15).
BB Multiplier – Standard deviation multiplier for Bollinger Bands (default: 2.0).
Show verde / marron / media lines – Toggles the display of auxiliary lines.
Show FUSION🔥 label – Enables/disables signal labels.
Indicator Components
1. PVI (Positive Volume Index)
Formula:
pvi := volume > volume ? nz(pvi ) + (close - close ) / close * sval : nz(pvi )
Description:
PVI increases when volume rises compared to the previous bar and accounts for price percentage change. The stronger the price movement with increasing volume, the higher the PVI value.
2. NVI (Negative Volume Index)
Formula:
nvi := volume < volume ? nz(nvi ) + (close - close ) / close * sval : nz(nvi )
Description:
NVI tracks price movements during declining volume. If the price rises on low volume, it may indicate a "stealth" trend.
3. Money Flow Index (MFI)
Formula:
100 - 100 / (1 + up / dn)
Description:
An oscillator measuring money flow strength. Values above 80 suggest overbought conditions, while values below 20 indicate oversold conditions.
4. Stochastic Oscillator
Formula:
k = 100 * (close - lowest(low, length)) / (highest(high, length) - lowest(low, length))
Description:
A classic stochastic oscillator showing price position relative to the selected period's range.
5. Bollinger Bands Oscillator
Formula:
(tprice - BB midline) / (upper BB - lower BB) * 100
Description:
Indicates the price position relative to Bollinger Bands in percentage terms.
Key Lines & Histogram
1. Verde (Green Line)
Calculation:
verde = marron + oscp (normalized PVI)
Interpretation:
Higher values indicate stronger bullish momentum. A FUSION🔥 signal appears when the value reaches 750+.
2. Marron (Brown Line)
Calculation:
marron = (RSI + MFI + Bollinger Osc + Stochastic / 3) / 2
Interpretation:
A composite oscillator combining multiple indicators. Higher values suggest overbought conditions.
3. Media (Red Line)
Calculation:
media = EMA of marron with smoothing period
Interpretation:
Acts as a signal line for trend confirmation.
4. Histogram
Calculation:
histo = verde - marron
Colors:
Bright green (>100) – Strong bullish momentum.
Light green (>0) – Moderate bullish momentum.
Orange (<0) – Bearish momentum.
Red (<-100) – Strong bearish momentum.
Signals & Alerts
1. FUSION🔥 (Strong Momentum)
Condition:
verde >= 750
Visualization:
A "FUSION🔥" label appears below the chart.
Alert:
Can be set to trigger notifications when the condition is met.
2. Background Aura
Condition:
verde > 850
Visualization:
The chart background turns teal, indicating extreme momentum.
Usage Recommendations
FUSION🔥 Signal – Can be used as a long entry point when confirmed by other indicators.
Histogram:
1. Green bars – Potential long entry.
2. Red/orange bars – Potential short entry.
3. Media & Marron Crossover – Can serve as an additional trend filter.
4. Suitable for a 5-15 minute time frame
Conclusion
Momentum Fusion v1 is a powerful tool for momentum analysis, combining multiple indicators into a unified system. It is suitable for:
Trend traders (catching strong movements).
Scalpers (identifying short-term impulses).
Swing traders (filtering entry points).
The indicator features customizable settings and visual signals, making it adaptable to various trading styles.

MACD + RSI + EMA + BB + ATR Day Trading StrategyEntry Conditions and Signals
The strategy implements a multi-layered filtering approach to entry conditions, requiring alignment across technical indicators, timeframes, and market conditions .
Long Entry Requirements
Trend Filter: Fast EMA (9) must be above Slow EMA (21), price must be above Fast EMA, and higher timeframe must confirm uptrend
MACD Signal: MACD line crosses above signal line, indicating increasing bullish momentum
RSI Condition: RSI below 70 (not overbought) but above 40 (showing momentum)
Volume & Volatility: Current volume exceeds 1.2x 20-period average and ATR shows sufficient market movement
Time Filter: Trading occurs during optimal hours (9:30-11:30 AM ET) when market volatility is typically highest
Exit Strategies
The strategy employs multiple exit mechanisms to adapt to changing market conditions and protect profits :
Stop Loss Management
Initial Stop: Placed at 2.0x ATR from entry price, adapting to current market volatility
Trailing Stop: 1.5x ATR trailing stop that moves up (for longs) or down (for shorts) as price moves favorably
Time-Based Exits: All positions closed by end of trading day (4:00 PM ET) to avoid overnight risk
Best Practices for Implementation
Settings
Chart Setup: 5-minute timeframe for execution with 15-minute chart for trend confirmation
Session Times: Focus on 9:30-11:30 AM ET trading for highest volatility and opportunity

Open-Based Percentage Levelsv2
This is an updated version of my original script.
Changes:
I took off the displacement levels since there served no purpose on this script.
I also fixed it to where the percentage level lines are visible continually throughout the entire trading day. Old version had these lines disappearing.
I also updated the name to better reflect its purpose.
Now only works on 30 min and below as the higher time frames are meaningless. The older version allow higher time frames and the code is open source to adjust as desired

Open-Based Adjustable LevelsThis indicator gives signals for levels where the buy or sell volume is above adjustable levels (ex, volume at 100,000). And these levels will only signal after the price has gone above/below a certain 'adjustable' percentage of the stocks opening price.
Example: Signal sell when the price action is 0.7% above market opening price and when sell volume is above 120,000
or
Signal buy when buy volume is above 80,000 and the price is 0.5% below market opening price.
Great for day trading and detecting potential swings in the market. Above image is on a 3min chart.
Doesn't work as well on daily time frames or above.
Should be combined with other indicators like buy/sell channels, for the best confirmations