ATR ZigZag BreakoutATR ZigZag Breakout
This strategy uses my ATR ZigZag indicator (powered by the ZigZagCore library) to scalp breakouts at volatility-filtered highs and lows.
Everyone knows stops cluster around clear swing highs and lows. Breakout traders often pile in there, too. These levels are predictable areas where aggressive orders hit the tape. The idea here is simple:
→ Let ATR ZigZag define clean, volatility-filtered pivots
→ Arm a stop market order at those pivots
→ Join the breakout when the crowd hits the level
The key to greater success in this simple strategy lies in the ZigZag. Because the pivots are filtered by ATR instead of fixed bar counts or fractals, the levels tend to be more meaningful and less noisy.
This approach is especially suited for intraday trading on volatile instruments (e.g., NQ, GC, liquid crypto pairs).
How It Works
1. Pivot detection
The ATR ZigZag uses an ATR-based threshold to confirm swing highs and lows. Only when price has moved far enough in the opposite direction does a pivot become “official.”
2. Candidate breakout level
When a new swing direction is detected and the most recent high/low has not yet been broken in the current leg, the strategy arms a stop market order at that pivot.
• Long candidate → most recent swing high
• Short candidate → most recent swing low
These “candidate trades” are shown as dotted lines.
3. Entry, SL, and TP
If price breaks through the level, the stop order is filled and a bracket is placed:
• Stop loss = ATR × SL multiplier
• Take profit = SL distance × RR multiplier
Once a level has traded, it is not reused in the same swing leg.
4. Cancel & rotate
If the market reverses and forms a new swing in the opposite direction before the level is hit, the pending order is cancelled and a new candidate is considered in the new direction.
Additional Features
• Optional session filter for backtesting specific trading hours
Daytrading

SMC Phase & Smart ORB Bias [TWS]🚀 SMC Phase & Smart ORB Bias – The Ultimate Bias & Phase Indicator! 🔥
Unlock the power of Smart Money Concepts (SMC) combined with the classic Opening Range Breakout (ORB) strategy—all in one powerhouse indicator! Perfect for traders who want high-probability bias detection with visual clarity and multi-timeframe confirmation.
💡 Features
✅ SMC Phase Detection – Automatically identifies the current market phase:
- Accumulation 📦
- Distribution 📤
- Bullish Markup 📈
- Bearish Markdown 📉
- Manipulation 🕵️
- Consolidation ⚖️
✅ Smart ORB Bias – Know immediately if price is bullish or bearish pre-ORB and post-ORB, based on:
- 1-minute EMA for micro-bias
- Multi-timeframe HTF analysis (15m & 60m)
- ORB high/low breakout confirmation
✅ Multi-Timeframe Support – Combines lower timeframe (1-min EMA) and higher timeframe (15m & 60m) analysis to give you a crystal-clear market bias.
✅ ORB High/Low Lines – Automatically draws ORB session high and low with optional visibility 🌈
✅ Customizable Labels – See SMC Phase, ORB Bias, HTF & M1 EMA Bias, and ORB High/Low at a glance.
- Choose multi-color labels (default) or single color 🎨
- Fully configurable colors for bullish, bearish, neutral, and text
✅ Alerts – Get notified instantly when bias changes!
- Bullish 🚀
- Bearish 🛑
- Neutral/Mixed ⚖️
✅ Flexible ORB Settings – Set ORB start time ⏰, duration ⏱, and label offsets for ultimate precision
⚡ Why This Indicator is Next-Level
This script is perfect for traders who want to see the market like the pros:
- Instantly know which SMC phase the market is in
- Identify bias before and after the ORB session
- Multi-timeframe bias confirmation
- Fully customizable visuals to match your chart style
- Works for scalpers, intraday traders, and swing traders alike
🎯 Perfect For
- Day Traders looking to trade ORB breakouts
- Smart Money Concept enthusiasts
- Traders wanting multi-timeframe bias clarity
- Anyone who wants visual clarity and actionable bias at a glance
💎 Get ready to trade smarter, not harder! This is the ORB + SMC combo you’ve been waiting for! 💎

NYSE Session📌 NYSE Open–Close Session Map — by o0psi
This tool marks the exact candles where the New York Stock Exchange opens and closes, and automatically tracks the true session high and low.
Everything is locked to the exact bar where it happened — no drifting, no extended rays, no repainting.
🔹 Features
NYSE OPEN marker (9:30 EST)
NYSE CLOSE marker (16:00 EST)
Faint background highlight showing the full regular session
Real session high/low detection
High/low candles update live as the session forms
High/low markers stay attached to the exact candle that created them
Perfect for futures, indices, and equities traders
🔹 Why traders use this
The NYSE open and close create some of the most important liquidity events of the day.
This indicator makes them obvious — clean visuals, no clutter, no guessing.
🔹 Ideal for
SPY / ES / NQ scalpers
US30 / SPX traders
Liquidity + session-based traders
Intraday momentum and volatility setups
Anyone who uses NY open/close as key decision points
Made with precision by o0psi.

Sen Channel LiteSen Channel Lite
Sen Channel Lite calculates a robust, median-based regression channel using the Theil–Sen slope method. This visual tool helps traders identify trend direction and potential breakout zones in real time.
Key Features
Dynamic Trend Line: The median-based regression line adapts to price movement, providing a central reference for trend direction.
Upper and Lower Bands: Automatically updated bands highlight potential breakout or reversal areas.
Breakout Markers: Optional triangles indicate when price crosses above the upper band or below the lower band.
Midline (EMA/SMA): Toggleable trend line for additional context on price direction.
VWAP Anchor: Optional VWAP plot to visualize volume-weighted average price levels.
Customizable Inputs:
Lookback Period for slope calculation
Band Multiplier to adjust sensitivity
Option to use Standard Deviation or ATR for band width
Midline type, length, and color
VWAP visibility and color
Channel cloud transparency
How to Read Signals (Educational Use Only):
Trend Context: The midline provides a reference for general trend direction. Price above the midline suggests bullish bias; below indicates bearish bias.
Breakouts:
Triangle up → price crossed above the upper band; potential strong move upward.
Triangle down → price crossed below the lower band; potential strong move downward.
Channel Interpretation:
Price near the upper band → market may be overextended.
Price near the lower band → market may be oversold.
Price moving within the channel → trend is balanced; use additional analysis for direction.
VWAP Context: Compare price to VWAP for intraday support/resistance insights.
Usage Notes:
Fully visual tool; no trading or financial advice.
All calculations are protected to preserve intellectual property.
Results reflect real-time calculations; no repainting.
Suitable for intraday to daily timeframes.
Important: This script is published as protected/closed-source to safeguard GammaBulldog intellectual property.
Session Volume Profile – Asia, London, NYSession Volume Profile – Asia, London, New York
Product Description
This tool displays intraday volume distribution for the Asian, London, and New York trading sessions.
It provides a visual breakdown of where trading activity concentrated during each session, helping users study volume structure across global market phases.
What the Tool Shows
1. Session Levels
Each session plots three main reference levels:
Point of Control (POC) — the price level with the highest volume traded during that session
Value Area High (VAH) — upper boundary of the primary volume region
Value Area Low (VAL) — lower boundary of the primary volume region
Each session is assigned its own color for easier differentiation.
2. Session Volume Histogram
A horizontal volume histogram displays how activity is distributed within each session.
Longer bars indicate higher relative volume at that price.
3. Session Highlighting (Optional)
Background shading can be enabled to visually identify the current active session.
4. Session Countdown (Optional)
A small text label shows how much time is left in the current session. This is for chart awareness only.
How to Read the Display (Educational Use Only)
POC is often viewed by many traders as a key reference point when studying intraday balance or activity clusters.
VAH / VAL can help users observe where the majority of volume occurred within a session.
Comparing session profiles may help identify how participation shifts from Asia → London → New York.
Observing how price interacts with these historical volume areas can provide context when studying intraday structure.
This panel does not generate trading signals. It is intended for chart analysis, market study, and understanding how volume distributes across global sessions.
Customization Options
Accessible via Settings → Inputs:
Enable/disable any session
Adjust value area percentage
Modify histogram density
Adjust visual opacity
Toggle countdown timer or session shading
These options allow users to tailor the display to different chart styles and timeframes.
Notes
This tool is for educational and informational purposes only.
It does not provide trading or financial advice.
No signals are produced; all outputs are historical/analytical.
Code is published as protected/closed-source to preserve the structure of the underlying calculations.

Options Fusion Core - Lite v6Options Fusion Core – Lite v6
A dual-engine oscillator designed to provide clear, confidence-driven market reads. OFC – Lite v6 combines two high-signal components into a single 0–100 panel to help traders interpret momentum strength and liquidity flow at a glance.
Core Components
Momentum Engine (Solid Line)
Above 50: Bullish bias (green shades)
Below 50: Bearish bias (red shades)
Near 20 or 80: Potential exhaustion zones where trends may pause or reverse
Liquidity Gauge (Dotted Line)
Above 55: Strong buying pressure
Below 45: Selling pressure
Around 50: Neutral flow
How to Use (Educational Purpose Only)
Alignment Signals: Watch for Momentum Engine and Liquidity Gauge moving in the same direction.
Example: Momentum >50 and Liquidity >55 → constructive environment
Example: Momentum <50 and Liquidity <45 → weakening conditions
Extremes: Momentum near 20 or 80 indicates potential trend exhaustion. Paired with strong Liquidity changes, these zones may highlight possible reversals or pauses.
Neutral Line (50): Many false moves occur around 50. Wait for a clear break above or below before interpreting as a signal.
Use in Context: Combine with price action, volume, or other indicators for confirmation.
User Inputs
Fast Momentum Length — controls how quickly Momentum reacts
VFI Length — smooths the Liquidity Gauge
VFI Cutoff — adjusts sensitivity to flow spikes
Lite Version:
Oscillator panel only
No automated signals or multi-ticker table
Educational and visualization purposes only
Important Notice
This script is educational and informational only. Not trading, financial, or investment advice.
Calculations are proprietary and protected to safeguard intellectual property.
No repainting; all results reflect real-time calculation.

Gamma Conviction Oscillator LiteGamma Conviction Oscillator Lite
A volume-weighted momentum oscillator designed to help traders visualize conviction in gamma-heavy instruments (SPY, TSLA, NVDA, MSTR, COIN, HOOD, etc.). This LITE edition is fully functional and educational, focusing on reading market momentum without offering trading signals.
Core Features (LITE Version):
Dynamic oscillator panel with volatility-adjusted overbought/oversold levels
Long-term trend filter: 200-period moving average selectable as SMA, EMA, or HMA
Conviction-based coloring system:
Bright Lime → high-conviction oversold (price above long-term MA)
Bright Red → high-conviction overbought (price below long-term MA)
Teal / Maroon → low-conviction extremes (counter-trend)
User Inputs:
Base Oscillator Length, Volatility Smoothing Length, and Sensitivity Factor are adjustable in Settings → Inputs
Long-Term Trend Length and MA Type are selectable for trend confirmation
How to Read Signals (Educational Use Only):
Oscillator Level: Observe the main VWPS line relative to overbought/oversold levels:
Above the red overbought line → price may be stretched
Below the green oversold line → price may be compressed
Trend Context: Compare the oscillator reading to the long-term MA:
Oscillator above oversold + price above MA → potential bullish conviction
Oscillator below overbought + price below MA → potential bearish conviction
Color Coding: The line color communicates conviction strength and trend alignment:
Bright Lime / Bright Red indicate strong alignment with trend extremes
Teal / Maroon indicate weaker, counter-trend extremes
Use the oscillator in conjunction with your own analysis; consider confirming with price action, volume, or other indicators.
LITE Version:
Oscillator panel only
No divergence detection
No multi-ticker gamma table
Important Notice:
This script is educational and informational only. Not trading, financial, or investment advice.
All calculations are proprietary and protected to preserve intellectual property.
No repainting: results reflect real-time calculations.
Source Code:
This script is published as protected/closed-source to safeguard GammaBulldog intellectual property.

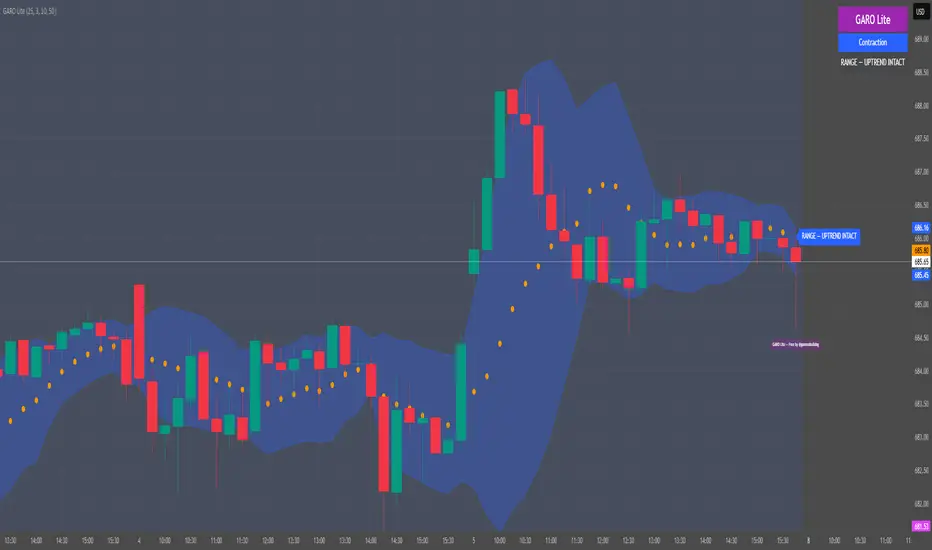
GARO Lite - Free Regime EngineGARO — Gamma Regime Engine
Overview
GARO (Gamma Regime Oscillator) is a visual regime engine that shows market conditions in real-time. This free edition is for educational and charting purposes only.
Key Features
Regime Detection: Highlights Expansion, Contraction, and Spike conditions using trend, volatility, and volume-based calculations.
Core and Bands: Central reference line with upper and lower bands.
Visual Alerts: Orange dots appear under candles during compressions; background colors indicate current regime.
Signal Labels: Labels provide visual guidance based on regime and trend slope.
Gamma Exposure (GEX) Proxy & Zero Gamma Flip: Optional visual overlays for contextual awareness.
User Inputs: Some settings are visible in the input panel but are disabled in this free edition.
How to Use
Regime Colors:
Expansion (green background): Market trending/expanding; core line indicates direction.
Contraction (blue background): Market range-bound; orange dots indicate compression.
Spike (red background): High volatility; visual alert only.
Labels & Signals:
Labels highlight potential regime moves; not trade advice.
Combine colors, core/band positions, and label cues with your own analysis.
Core Line & Bands:
Core line shows central reference per regime.
Upper/lower bands provide context for potential support/resistance zones.
Orange Dots:
Indicate compressions or regime-specific signals; visual only.
Gamma Exposure & Zero Gamma Flip (Optional):
Illustrates potential price sensitivity; charting/educational use only.
Important:
Protected code; underlying calculations are not visible.
For educational and visual guidance only; not financial or trading advice.
Works on any timeframe; free edition gives visual regime insights.
Liquidity Pulse Oscillator LITETitle:
Liquidity Pulse Oscillator LITE
Description:
This indicator provides an observational view of market activity by measuring intra-bar price and volume dynamics. It is fully informational and educational, and does not constitute financial, trading, or investment advice.
Key Features:
Fast and Slow Pulse lines: Dual EMAs of volume-weighted pressure to highlight crossover points.
Histogram: Displays the difference between fast and slow pulses with color-coded bars (green for positive, red for negative).
Scaled 0–100 line: Provides a normalized perspective for easier interpretation of relative activity levels.
EXP/CON markers: Indicate expansions and contractions in observed market activity.
How It Works:
Pressure is calculated as the absolute open-to-close movement divided by the candle range, multiplied by volume. Safeguards handle zero-range bars. The resulting values are smoothed using fast and slow EMAs. Crossovers generate EXP and CON markers, helping users visualize changes in market activity.
Why This Approach:
Traditional volume indicators often overlook intra-bar dynamics and range normalization. This oscillator emphasizes price movement relative to bar range combined with volume, offering an additional perspective on shifts in market activity.
How to Use:
EXP marker + positive histogram: Indicates potential expansion in observed market activity.
CON marker + negative histogram: Indicates potential contraction in observed market activity.
Can be applied on any timeframe to help confirm breakouts, reversals, or shifts in market behavior.
Notes:
For informational and educational purposes only. Not financial advice.

TradeAxis Trendlines [XAUUSD]Rule-based trendline framework for XAUUSD built specifically for intraday trendline traders on TradingView.
This script automatically maps filtered trendlines and uses several internal algorithms to evaluate and organize key structures. The indicator includes a range of settings so you can test what works best for your own approach, and it also provides a pre-tested configuration as a recommended starting point.
Important notes:
• Designed and tested for XAUUSD, 15-minute timeframe.
• The script does not execute trades or manage orders – it only plots structure.
• This is not financial or investment advice. All trading decisions and risk remain your responsibility.
This is an invite-only script.

Empire OS Automated Trading • Institutional-grade executionEmpire OS – 9/40 EMA Dynamic Momentum Strategy
This strategy isn’t just EMAs — it’s a dynamic entry and exit system built around real-time price behavior. The 9/40 EMA setup gives the base trend direction, and the internal engine calculates every entry, stop, and target using recent price action and a 14-ATR volatility model.
Everything adjusts automatically:
• Entries react to momentum shifts based on the 9/40 EMA separation
• Stops tighten or widen based on the current 14-ATR reading
• Targets scale with real market volatility (not fixed numbers)
• Risk-to-Reward is calculated on the fly for cleaner, stronger trades
• Exits are based on structure + volatility, not random lines
Most strategies use fixed stops, fixed R:R, or standard EMA pairs that anyone can copy.
This one adapts to the market in real time — making every trade unique to current conditions.
It’s rare because almost nobody builds a retail strategy that:
Uses a non-standard 9/40 EMA combo
Calculates stops + targets off real volatility
Adjusts risk reward based on live price activity
Filters entries through momentum AND price structure
Keeps drawdown tight while catching high-quality moves
This is the official Empire OS version — built for consistency, momentum accuracy, and prop-firm scalability.

Session Opening Range Breakout (ORBO)This strategy automates a classic Opening Range Breakout (ORBO) approach: it builds a price range for the first minutes after the market opens, then looks for strong breakouts above or below that range to catch early directional moves.
Concept
The idea behind ORBO is simple:
The first minutes after the session open are often highly informative.
Price forms an “opening range” that acts as a mini support/resistance zone.
A clean breakout beyond this zone can lead to high-momentum moves.
This script turns that logic into a fully backtestable strategy in TradingView.
How the strategy works
Opening Range Session
Default session: 09:30–09:50 (exchange time)
During this window, the script tracks:
orHigh → highest high within the session
orLow → lowest low within the session
This forms your Opening Range for the day.
Breakout Logic (after the window ends)
Once the defined session ends:
Long Entry:
If the close crosses above the Opening Range High (orHigh),
→ strategy.entry("OR Long", strategy.long) is triggered.
Short Entry:
If the close crosses below the Opening Range Low (orLow),
→ strategy.entry("OR Short", strategy.short) is triggered.
Only one opening range per day is considered, which keeps the logic clean and easy to interpret.
Daily Reset
At the start of a new trading day, the script resets:
orHigh := na
orLow := na
A fresh Opening Range is then built using the next session’s 09:30–09:50 candles.
This ensures entries are always based on today’s structure, not yesterday’s.
Visuals & Inputs
Inputs:
Opening range session → default: "0930-0950"
Show OR levels → toggle visibility of OR High / Low lines
Fill range body → optional shaded zone between OR High and OR Low
Chart visuals:
A green line marks the Opening Range High.
A red line marks the Opening Range Low.
Optional yellow fill highlights the entire OR zone.
Background shading during the session shows when the range is currently being built.
These visuals make it easy to see:
Where the OR sits relative to current price
How clean / noisy the breakout was
How often price respects or rejects the opening zone
Backtesting & Optimization
Because this is written as a strategy():
You can use TradingView’s Strategy Tester to view:
Win rate
Net profit
Drawdown
Profit factor
Equity curve
Ideas to experiment with:
Change the session window (e.g., 09:15–09:45, 10:00–10:30)
Apply to different:
Markets: indices, FX, crypto, stocks
Timeframes: 1m / 5m / 15m
Add your own:
Stop Loss & Take Profit levels
Time filters (only trade certain days / times)
Volatility filters (e.g., ATR, range size thresholds)
Higher-timeframe trend filter (e.g., only take longs above 200 EMA)

Ultimate Swing Setup Ultimate Swing Setup is designed to educate traders by scoring each bar on a 0-100 scale, helping you identify high-quality long entry opportunities. It simplifies complex market conditions into clear signals—Strong Buy, Buy, Hold, or Avoid—so you can learn to recognise strong setups and make better-informed trading decisions. The indicator highlights only the most promising moments, providing a visual strength band and an easy-to-understand dashboard with live scores and nearby support/resistance levels to guide your learning.
Disclaimer: This script is for educational purposes only and does not constitute financial advice. Trading involves risk, and past performance is not indicative of future results. Users should exercise caution and conduct their own research before making any trading decisions.

Institutional Edge Pro v1.0 - 9.3/10 ConfidenceEducational 5-layer confirmation system combining institutional order flow concepts, trend analysis, and risk management principles. Features Order Block detection, adaptive stop losses (EMA 9x21), and probability scoring. For educational purposes only.
## ⚡ KEY FEATURES
### 🔍 5-Layer Confirmation System
- **Layer 0:** Market Regime Detection (30% weight) - ADX, Choppiness Index, Volatility, Volume
- **Layer 1:** Golden/Death Cross Trend Filter (20% weight) - EMA 50/200 with gradient confirmation
- **Layer 1.5:** Fast Death Cross Stop Loss - EMA 9/21 dynamic exits
- **Layer 2:** Smart Order Block Detection (20% weight) - Institutional footprint tracking
- **Layer 3:** Probabilistic Confirmations (20% weight) - RSI, MACD, Volume, Structure, Volatility
- **Layer 4:** Dynamic Risk Management (10% weight) - ATR-based adaptive stops
### 📊 Visual Dashboard
- **Regime Score:** 0-100 market health indicator
- **Trend Status:** Real-time BULL/BEAR/NONE classification
- **Trend Quality:** Freshness metric (degrades over time)
- **Order Block Status:** Active OB tracking with validation
- **Probability Scores:** Live Long/Short setup probabilities

Finlu CONTINUACIÓN PRO V3.4.7
Finlu Continuation PRO is an invite–only indicator designed to detect high–probability continuation zones after a strong impulse.
It helps you filter out noise, avoid random entries and stay aligned with the real trend.
The script was built to work together with Finlu Momentum PRO and with a structured trading plan.
You can use it on any asset (indices, forex, crypto, stocks) and on multiple timeframes, as long as you follow a clear process.
What it does
• Highlights momentum impulses and the areas where a continuation move is more likely.
• Filters many false signals that usually appear after overextended moves.
• Helps you synchronize your continuation entries with the main trend instead of fighting it.
• Can be integrated into any strategy based on structure, impulses and pullbacks.
This is not a “buy/sell” toy or a get–rich–quick tool.
It is meant for traders who value risk management, process and clarity.
Access
This is an invite–only script. If you want to use it as part of the full Finlu method, you can:
• Send me a message on Instagram @finlu_trading with the text “Quiero Continuación PRO”, or
• Join the Finlu Founders Group, where you get access to Finlu Momentum PRO, Finlu Continuation PRO and exclusive risk–management material.

NeuraEdge Block Trades v1.0NEURAEDGE BLOCK TRADES
═══════════════════════════════════════════════════════════════════════
We are excited to release Block Trades!
WHY THIS INDICATOR EXISTS?
Retail traders face a fundamental challenge: institutions move markets, but their activity is hidden. When smart money accumulates at support or distributes at resistance, retail traders often find themselves on the wrong side of the move.
Understanding where institutions are actively buying or selling is crucial for:
• Validating trade setups with volume confirmation
• Identifying supply and demand zones that actually hold
• Avoiding false breakouts driven by retail sentiment
• Spotting accumulation before major moves up
• Detecting distribution before major moves down
Most volume indicators simply show size without context. Block Trades was created to bridge this gap by detecting abnormally large volume bars and determining their directional bias, giving retail traders insight into institutional activity.
═══════════════════════════════════════════════════════════════════════
WHAT IT DOES:
Block Trades identifies volume spikes that likely represent institutional order flow and classifies them as buying pressure, selling pressure, or contested zones. The indicator then validates these prints against directional flow analysis and groups nearby prints into accumulation or distribution clusters.
This helps you answer critical questions:
• Is this support level being defended by institutions?
• Are smart money players distributing into this rally?
• Is heavy volume confirming my trade or warning against it?
• Where are institutional interest zones forming?
KEY FEATURES:
• Multi-tier volume detection (Large: 2x, Huge: 3x, Massive: 5x average)
• Directional classification with flow validation
• Accumulation/distribution zone detection
• Print clustering for institutional interest areas
• Confluence scoring system (0-10 points)
• Real-time statistics dashboard
• Clean, minimal chart labels
═══════════════════════════════════════════════════════════════════════
HOW IT WORKS:
VOLUME SPIKE DETECTION
The indicator monitors volume against a moving average baseline. When current volume significantly exceeds this average (default thresholds: 2x, 3x, 5x), it flags the bar as a potential institutional print.
DIRECTIONAL CLASSIFICATION
Buy Print: Large volume + closes in top 70% of range
Sell Print: Large volume + closes in bottom 70% of range
Neutral Print: Large volume + mid-range close (absorption/contested)
The close position within the bar's range reveals who won the battle. A bar with massive volume that closes near its high indicates aggressive buying. The same volume closing near the low indicates aggressive selling.
FLOW VALIDATION
Each print is validated against underlying institutional flow calculations. This filters out volume spikes that don't align with directional pressure, significantly reducing false signals. Buy prints require bullish flow, sell prints require bearish flow.
ACCUMULATION & DISTRIBUTION ZONES
When multiple prints occur at similar price levels with consistent direction:
• Repeated buy prints + bullish trend = Accumulation (institutions building positions)
• Repeated sell prints + bearish trend = Distribution (institutions unloading positions)
These zones often become powerful support/resistance levels because institutions have established significant positions there.
PRINT CLUSTERING
The indicator groups nearby prints (within configurable ATR distance) into clusters. When 3 or more prints form a cluster, it marks an institutional interest zone. These clusters frequently act as price magnets and reversal points.
PRINT CLUSTERING
The indicator groups nearby prints (within configurable ATR distance) into clusters. When 3 or more prints form a cluster, it marks an institutional interest zone. These clusters frequently act as price magnets and reversal points.
CONFLUENCE SCORING
Each print receives a confluence score (0-10 points) based on:
• Volume size (Massive: +3, Huge: +2, Large: +1)
• Flow alignment (+2 points, configurable)
• Trend alignment (+1)
• New high/low made (+1)
• Extreme close position (+1)
Prints with 5+ points receive a star marker, indicating ultra-high conviction setups.
═══════════════════════════════════════════════════════════════════════
HOW TRADERS USE IT:
USE CASE 1: TRADE VALIDATION
Your system signals a long entry at support. Check Block Trades:
• Buy prints present at this level? Institutions defending = Take the trade
• Sell prints present? Institutions distributing = Skip or wait
• No prints? Proceed with normal risk management
USE CASE 2: IDENTIFYING EXHAUSTION
Price rallies to resistance with heavy volume:
• Sell prints appear = Distribution, institutions unloading into strength
• Likely reversal coming, consider shorts or exit longs
• Confirmed by multiple sell prints = High conviction reversal setup
USE CASE 3: FINDING SUPPORT/RESISTANCE
Accumulation cluster forms at 450 level:
• Multiple buy prints over several sessions
• Institutions building positions at this price
• 450 becomes high-probability support for future pullbacks
• Use for entries or stop placement
USE CASE 4: BREAKOUT CONFIRMATION
Price breaks above key resistance:
• Buy print on breakout bar = Real institutional participation
• High confluence score (5+) = Ultra-high conviction
• Fake breakout would show sell prints or no prints
USE CASE 5: AVOIDING TRAPS
Price spikes up on huge volume:
• Sell print appears (closes low in range) = Trap
• Institutions selling into retail FOMO
• Avoid chasing, prepare for reversal
═══════════════════════════════════════════════════════════════════════
VISUAL ELEMENTS:
ON-CHART LABELS
Buy Print: Green label below bar showing size (LARGE/HUGE/MASSIVE)
Sell Print: Red label above bar showing size
Contested Print: Orange label at bar high (large volume, mid-range close)
Accumulation: Green "ACCUM" label with diamond symbol
Distribution: Red "DISTRIB" label with diamond symbol
WHAT CONTESTED MEANS:
When a bar has massive volume but closes in the middle of its range (neither top nor bottom 70%), it indicates a battle between buyers and sellers with no clear winner. This often occurs at:
• Major support/resistance levels where institutions are absorbing supply/demand
• Transition zones before a directional move
• Areas of genuine price discovery and uncertainty
Contested prints can signal absorption (institutions quietly building positions) or genuine indecision. Watch for follow-through on the next bar to determine which side won.
LABEL MODIFIERS
∆ checkmark = Flow validated (institutional flow aligns with print)
Star symbol = High confluence (5+ points, ultra-high conviction)
CLUSTER ZONES
Semi-transparent boxes marking areas where multiple prints occurred
Extend to the right to show ongoing institutional interest zones
Color-coded: green for bullish clusters, red for bearish clusters
DASHBOARD (TOP RIGHT)
• Current volume state and ratio
• Institutional flow direction
• Cumulative trend direction
• Recent print count (last 20 bars)
• Active cluster count
• Volume thresholds
STATISTICS (BOTTOM LEFT)
• Total session prints
• Buy/sell percentage split
═══════════════════════════════════════════════════════════════════════
SETTINGS:
PRINT DETECTION
• Volume Lookback Period: 20 bars (for average calculation)
• Large Print Threshold: 2.0x average
• Huge Print Threshold: 3.0x average
• Massive Print Threshold: 5.0x average
• Min Candle Size: 0.3x ATR (filters doji bars)
CLASSIFICATION
• Directional Threshold: 70% (how far in range to qualify as buy/sell)
• Show Neutral Prints: Toggle contested zones
• Require New High/Low: Optional stricter filter
INSTITUTIONAL FLOW
• Enable Flow Confluence: On/Off toggle
• Flow Confluence Weight: 2 points (adjustable 1-5)
CLUSTERING
• Enable Clustering: On/Off
• Cluster Distance: 1.0x ATR (how close prints must be)
• Min Prints for Cluster: 3 prints
• Show Cluster Zones: On/Off
DISPLAY
• Show Print Labels: Toggle all labels
• Show Accumulation/Distribution/Contested Labels: Toggle special labels
• Label Size: Tiny/Small/Normal
• Colors: Customizable buy/sell/neutral colors
FILTERS
• Minimum Volume: 0 (set threshold to ignore low volume bars)
• Session Filter: Avoid first/last 15 minutes (low liquidity)
═══════════════════════════════════════════════════════════════════════
BEST PRACTICES:
DO:
✓ Use as confluence with your primary trading system
✓ Pay attention to accumulation/distribution zones
✓ Look for high confluence prints (5+ stars)
✓ Validate breakouts with print direction
✓ Use cluster zones as future support/resistance
✓ Combine with higher timeframe analysis
✓ Works best on liquid instruments (major pairs, indices, large cap stocks)
DON'T:
✗ Trade prints as standalone buy/sell signals
✗ Ignore the directional classification (context matters)
✗ Use on low-volume instruments (prints less reliable)
✗ Chase every print without confluence confirmation
✗ Trade during low liquidity hours (first/last 15 min)
✗ Expect 100% accuracy (it's a confluence tool, not crystal ball)
OPTIMAL TIMEFRAMES:
• 5-minute to 1-hour charts for intraday trading
• 1-hour to 4-hour charts for swing trading
• Daily charts for position trading
BEST INSTRUMENTS:
• Major forex pairs (EUR/USD, GBP/USD, etc.)
• Index futures (ES, NQ, YM)
• High-volume stocks (SPY, QQQ, TSLA, AAPL, etc.)
• Major cryptocurrencies (BTC, ETH)
═══════════════════════════════════════════════════════════════════════
IMPORTANT DISCLAIMERS
METHODOLOGY DISCLAIMER
This indicator identifies abnormally large volume bars and estimates their directional bias based on price action and flow analysis. It does NOT have access to:
• Actual dark pool transaction data
• Off-exchange Alternative Trading System (ATS) prints
• Level 2 order book data
• Individual trade sizes or timestamps
• Institutional order identification
The prints detected are estimates based on publicly available volume and price data from TradingView. They indicate probable institutional activity patterns but are not confirmed block trades or dark pool executions.
USAGE DISCLAIMER
Block Trades is designed as a CONFLUENCE tool to validate trade setups - not as a standalone trading system. The indicator does not:
• Generate specific entry/exit signals
• Provide stop loss or take profit levels
• Constitute a complete trading strategy
• Guarantee profitable trades
Prints should be interpreted within the context of:
• Your overall trading strategy
• Market structure and trend
• Support/resistance levels
• Risk management rules
• Multiple timeframe analysis
RISK DISCLAIMER
Trading involves substantial risk of loss and is not suitable for every investor. Past performance is not indicative of future results. This indicator is a tool for technical analysis only and does NOT constitute financial advice, investment advice, trading advice, or a recommendation to buy or sell any securities or financial instruments.
You should not make any investment decision without conducting your own research and due diligence. The accuracy, completeness, and timeliness of the information provided by this indicator is not guaranteed. No representation is being made that using this indicator will guarantee profits or prevent losses.
By using this indicator, you acknowledge that you understand and accept all risks associated with trading, and you agree that the developer is not liable for any losses you may incur.
═══════════════════════════════════════════════════════════════════════
ALERTS
Available alert conditions:
• Massive Buy Print
• Massive Sell Print
• Huge Buy Print
• Huge Sell Print
• Accumulation Detected
• Distribution Detected
• High Confluence Buy (5+ points)
• High Confluence Sell (5+ points)
Happy Trading!

NeuraEdge Delta Flow Pro V1.0INSTITUTIONAL ORDER FLOW ANALYSIS
NeuraEdge Delta Flow Pro reveals the hidden battle between buyers and sellers that traditional indicators miss. While price shows you WHAT happened, Delta Flow shows you WHO won the fight.
═══════════════════════════════════════════════
⚡ WHAT MAKES THIS UNIQUE?
Unlike basic volume indicators that just show size, Delta Flow analyzes:
- Bar-by-bar order flow direction (buying vs selling pressure)
- Cumulative Volume Delta (CVD) for institutional accumulation/distribution tracking
- Normalized strength metrics (0-100%) for conviction measurement
- Hidden divergences that predict reversals before they happen
Most order flow tools require expensive data feeds. Delta Flow uses advanced price action algorithms to estimate institutional flow on ANY timeframe, ANY market - all within TradingView.
═══════════════════════════════════════════════
📊 VISUAL COMPONENTS
DELTA HISTOGRAM
- Green bars = Buying pressure dominates
- Red bars = Selling pressure dominates
- Bright colors = Strong conviction (>70% threshold)
- Faded colors = Weak/normal pressure
CVD LINE (Blue)
- Rising = Buyers accumulating (institutions buying dips)
- Falling = Sellers distributing (institutions selling rallies)
- Divergence from price = Early reversal warning
DIVERGENCE SIGNALS
- Green Triangle = Bullish divergence (price LL, delta HL)
- Red Triangle = Bearish divergence (price HH, delta LH)
REAL-TIME DASHBOARD
- Current delta state (Strong Buy/Sell/Neutral)
- Normalized strength percentage
- CVD trend direction
- 20-bar pressure statistics
═══════════════════════════════════════════════
🎯 HOW TO USE IT:
1. SIGNAL CONFIRMATION
Your indicator says BUY → Check delta → Green = Take it ✅ | Red = Skip ⚠️
2. DETECT WEAK MOVES
Price rallies but delta is red = Distribution (sellers unloading into strength)
Price drops but delta is green = Accumulation (buyers absorbing weakness)
3. SPOT REVERSALS EARLY
Divergence triangles often precede major turning points by several bars
4. GAUGE CONVICTION
Strong delta (bright colors) = High probability the move continues
Weak delta (near zero) = Chop zone, reduce size or stay flat
═══════════════════════════════════════════════
💎 WHY CLOSED SOURCE?
Delta Flow uses a proprietary calculation method developed through extensive testing to provide the most accurate order flow estimation possible within TradingView's data limitations.
The closed-source model protects the methodology and ensures consistent results for all users, while preventing modifications that could lead to confusion or misinterpretation of signals.
═══════════════════════════════════════════════
⚙️ CUSTOMIZABLE SETTINGS
DELTA CALCULATION
- 3 estimation methods (Price Action, Candle Body, Wick Weighted)
- Smoothing options (1-10 periods)
CUMULATIVE DELTA
- CVD line toggle
- Auto-reset period (0-100 bars, or never)
- Custom line color
DISPLAY OPTIONS
- Toggle histogram on/off
- Toggle divergence signals
- Toggle dashboard
- Custom buying/selling/neutral colors
THRESHOLDS
- Strong delta percentage (50-95%, default 70%)
- Threshold line display toggle
DIVERGENCES
- Pivot lookback length (2-15 bars)
- Sensitivity control
═══════════════════════════════════════════════
📊 REAL MARKET EXAMPLE: EXHAUSTION PATTERN
The chart above shows SPY on the 1-hour timeframe with two critical exhaustion points where Delta Flow provided early reversal warnings:
Exhaustion Point 1 (Left):
- Price: Made higher high
- Delta: RED bars (selling pressure)
- CVD: Falling (net sellers)
- Signal: Green divergence triangle
- Outcome: Reversal down
Exhaustion Point 2 (Right):
- Price: Pushed to new high
- Delta: RED bars persist (weak buyers)
- CVD: Continued bearish
- Signal: Red divergence triangle
- Outcome: Sharp decline
The Pattern:
When price makes new highs but delta remains negative with falling CVD, it indicates:
1. Institutional selling into retail buying
2. Weak hands driving price (exhaustion)
3. Smart money distributing (preparing for reversal)
The divergence triangles appeared BEFORE the major moves down, giving traders advance notice to either exit longs or prepare shorts.
This is why Delta Flow is most powerful when used to FILTER signals from other indicators - it reveals when rallies/selloffs lack conviction.
═══════════════════════════════════════════════
📈 BEST PRACTICES
✅ Use with your primary trading system as confirmation
✅ Works on all timeframes (best on 15m+)
✅ Most effective on liquid markets (major pairs, indices, popular crypto)
✅ Pay attention to CVD trend for bigger picture
✅ Divergences are powerful but wait for price confirmation
❌ Not a standalone system - designed for confluence
❌ Less reliable on low-volume instruments
❌ Avoid trading when delta is near zero (indecision zone)
═══════════════════════════════════════════════
🔔 ALERT SYSTEM
6 customizable alerts:
- Strong Buying Pressure
- Strong Selling Pressure
- Bullish Divergence
- Bearish Divergence
- Delta Flip Bullish
- Delta Flip Bearish
═══════════════════════════════════════════════
🎓 INCLUDED RESOURCES
Upon invite approval, you receive:
- Complete user guide (PDF)
═══════════════════════════════════════════════
⚠️ IMPORTANT NOTES
- This is an ESTIMATION of order flow based on price action and volume
- TradingView does not provide tick-by-tick data required for true order flow
- Works as a highly effective proxy for institutional pressure
- Designed for traders who understand order flow concepts
- Best results when combined with structure-based analysis
═══════════════════════════════════════════════
💬 TO REQUEST INVITE ACCESS FOR 7 DAYS TRIAL
write email to support@neura-edge.com with your username
═══════════════════════════════════════════════
💬 Questions or feedback? Leave a comment below.
🌐 Check out our full Indicator Suite: neura-edge.com/
📧 Support: support@neura-edge.com
INSTITUTIONAL PRECISION. RETAIL EXECUTION.

Day Trading Astra by Pooja📌 Day Trading Astra by Pooja
Day Trading Astra by Pooja is specily designed for F&O Traders, a clean and fast momentum-shift indicator designed to support day traders with clear entry signals and structured filtering.
It uses a refined RSI–MA crossover engine, allowing traders to visualize momentum transitions directly on the price chart with minimal clutter.
✨ Key Features
🔶 1. RSI–MA Crossover Engine
Identifies potential momentum shifts using a fast RSI and smoothed RSI-MA baseline.
🔶 2. Clean BUY/SELL Chart Signals
Markers appear directly on the candle chart—easy to read, no extra panes.
🔶 3. Smart Filtering System (Optional)
To help reduce low-quality signals in uncertain conditions:
ADX trend-strength filter
ATR volatility check
Slope validation
Minimum bars between two signals
🔶 4. Alert + Webhook Ready
Supports TradingView alerts and webhook integration for automation tools.
Each alert includes symbol, direction, price, timestamp, unique ID, and an optional secret key for secure execution.
🔶 5. Multi-Timeframe Flexible
Works across all timeframes; users can apply it according to their day-trading style.
📝 How to Use
Add indicator to chart.
Select your preferred filters or use default settings.
Enable alerts if automated notifications are needed.
Combine with your own risk management and trading framework.
This tool is meant to support analysis, not replace personal judgment.
⚠️ Disclaimer
This script is a technical analysis tool and not financial advice.
Results vary depending on market conditions and user settings.
No indicator can guarantee profits or eliminate risk.
Always test settings before applying them in live markets.
The user is fully responsible for all trading decisions.
⭐ Summary
A clean, fast, and structured momentum-entry tool designed to help day traders identify potential intraday shifts with clarity and alert support.

HybridWhales DAY TRADINGThis indicator offers a streamlined view of prevailing market trends on lower timeframes, empowering day traders to execute their strategies with greater precision
It incorporates two widely used exponential moving averages (EMAs)—the 50-period and 200-period—alongside an 800-period EMA, which effectively mirrors the 200-period EMA on the next higher timeframe. This setup provides enhanced flexibility, delivering multi-timeframe insights without the need to switch charts manually.
In addition, the indicator highlights essential intraday levels for quick reference:
Daily Open, denoted in yellow
Monday Highs, marked in red
Monday Lows, indicated in green
The indicator's core strength lies in its ability to detect market maker activity through color-coded candlesticks, based on volume analysis. Candles exhibiting significantly higher volume than the average of the prior eight candles are colored green (for bullish closes) or red (for bearish closes), signaling active market maker positioning—either entering shorts or longs.
Candles with moderately elevated volume (above average but not extreme) are shaded blue (bullish) or pink (bearish), suggesting market makers are accumulating short or long positions.
Interpretation is key: Red or pink candles (bearish) imply that market makers have initiated long positions, with price likely to revisit and fill these areas in the future. Conversely, green or blue candles (bullish) indicate market makers establishing shorts, anticipating a eventual pullback to these levels
To pinpoint the precise zones where price may return, the indicator places a white marker on each colored candle at its 50% retracement level, representing a fair value gap or imbalance.
Overall, this tool enables traders to spot market maker footprints, identify critical support and resistance zones, gauge weekly ranges, and assess potential momentum. While it fosters stronger confluence in analysis, results are not guaranteed and depend on individual trading execution.

GT3_Trades Sessions Highs & LowsThis indicator automatically identifies and displays the session highs and lows for the three major global market sessions: Asia, London, and New York. It is designed for intraday traders who rely on session-based structure, liquidity levels, and volatility windows. The script dynamically tracks and plots the highest and lowest price reached during each session and extends these levels forward on the chart for strong visual clarity.
Key Features
Session-Based Highs & Lows
Calculates and updates the high and low for each session (Asia, London, New York) in real time as price develops within the session window.
Fully Customizable Display Options
Traders can individually toggle the visibility of each session’s high and low levels.
Line colors, styles (Solid, Dashed, Dotted), and thickness are also user-configurable.
Accurate Timezone Handling
Session times are defined using user-selected timezone settings (default UTC+3), ensuring session boundaries match the trader’s desired market timing.
Automatic Daily Reset
At the start of each new trading day, the indicator clears the previous levels and begins tracking fresh highs and lows for the new day.
Dynamic Line Drawing
Each level is plotted using real Pine Script line objects, which update automatically as new highs or lows form. Once created, each line extends forward to the right—providing clear, persistent references for potential liquidity zones, breakouts, and reversions.
Efficient Tracking Logic
The script keeps track of the bar index where each high/low occurs and updates the line endpoints in real time. Historical levels are not reused, ensuring clean, uncluttered visuals.
How It Helps Traders
Identifies liquidity pools and sweep areas based on session extremes.
Highlights intraday structure shifts when price breaks or respects session highs/lows.
Provides a clear overview of volatility cycles across the global trading day.
Helps detect potential reversal or continuation setups when interacting with session boundaries.
Ideal For
Intraday and scalping strategies
ICT-based session analysis
Liquidity, sweep, and FVG traders
Forex, indices, crypto, and commodities

VWAP TrendSignalVWAP TrendSignal
VWAP (Volume-Weighted Average Price) is the market’s true fair value — the benchmark institutions use to see when price is balanced, extended, or trending with real intent.
Price often snaps back when it moves too far (mean reversion), and only shows genuine strength when it holds above or below VWAP.
VWAP TrendSignal makes this insight effortless by color-coding VWAP direction:
Yellow = VWAP rising → bullish pressure
Red = VWAP falling → bearish pressure
No bands. No noise. Just pure directional clarity.
Anchor VWAP to the Session, Week, Month, Quarter, or Year, and tailor the Slope Smoothing Filter to your timeframe:
1–2 smoothing → fast & reactive (1–5m scalping)
3–5 smoothing → clean & stable (5–15m intraday)
6–10 smoothing → slow flips (1H–4H swings)
10–15 smoothing → macro bias only (Daily/Weekly)
The line adapts to how you trade.
How to Use It
Mean Reversion
When price stretches far from VWAP, expect pullbacks or snapbacks.
Trend Direction
Yellow supports long bias, red supports short bias.
Simple, reliable, instantly visible.
Balance Zones
Price sitting near VWAP = compression, buildup, or chop.
A perfect signal to wait or prepare for a breakout.
Why It Works
VWAP TrendSignal distills institutional logic into a clean, single-line tool.
It shows fair value, trend slope, and balance all at once — making your chart clearer and your decisions faster.
Once you get used to reading it, trading without it feels blind.

MOMO – Imbalance Trend (SIMPLE BUY/SELL)MOMO – Imbalance Trend (SIMPLE BUY/SELL)
This strategy combines trend breaks, imbalance detection, and first-tap supply/demand entries to create a clean and disciplined trading model.
It automatically highlights imbalance candles, draws fresh zones, and waits for the first retest to deliver precise BUY and SELL signals.
Performance
On optimized settings, this strategy shows an estimated 57%–70% win-rate, depending on the asset and timeframe.
Actual performance may vary, but the model is built for consistency, discipline, and improved decision-making.
How it works
Detects trend structure shifts (BOS / Break of Trend)
Identifies displacement (imbalance) candles
Creates supply and demand zones from imbalance origin
Waits for first tap only (no second chances)
Confirms direction using trend logic
Generates clean BUY/SELL arrows
Automatic SL/TP based on user settings
Features
Clean BUY/SELL markers
Auto-drawn supply & demand zones
Trend break markers
Imbalance tags
Smart first-tap confirmation
Customizable stop loss & take profit
Works on crypto, gold, forex, indices
Best on M5–H1 for day trading
Note
This strategy is designed for day traders who want clarity, structure, and zero emotional trading.
Use it with discipline — and it will serve you well.
Good luck, soldier.

Average Volume Corner BoxAn indicator that anchors a single info box to the chart’s top right corner. It compares the current volume to a selectable moving average (SMA, EMA, WMA) and displays a status (VOL > AVG or VOL < AVG), the current volume, the average volume, and percent difference. The color switches between red and green backgrounds so you can read volume at a glance without cluttering the chart with those stinky volume rectangles.
Features
• Fixed corner box anchored to the chart top right
• Choose MA type: SMA, EMA, WMA
• Selectable MA length
• Optional percent difference display
• Threshold multiplier to only flag meaningful spikes (e.g., vol > avg * 1.5)
• Configurable colors and font size
