ETH Dynamic Risk Strategy# ETH Dynamic Risk Strategy - Publication Description
## Overview
The ETH Dynamic Risk Strategy is a systematic approach to accumulating Ethereum during bear markets and distributing during bull markets. It combines multiple risk indicators into a single composite metric (0-1 scale) that identifies optimal buying and selling zones based on market conditions.
## Key Features
• **Multi-Component Risk Metric**: Combines 4 weighted indicators to assess market conditions
• **Tiered Buy/Sell System**: 3 levels of buy signals (L1, L2, L3) and 3 levels of sell signals based on risk thresholds
• **Configurable Filters**: Optional buy filters to reduce signal frequency by 30-50%
• **Visual Risk Zones**: Color-coded risk metric plot with clear threshold lines
• **Comprehensive Dashboard**: Real-time statistics including position size, P/L, and component scores
## How It Works
### Risk Components (Configurable Weights)
1. **Log Return from ATH** (Default: 35%)
- Tracks drawdown from all-time high over lookback period
- Deep drawdowns (-70% to -90%) = low risk / buying opportunity
- Near ATH (0% to -20%) = high risk / selling opportunity
2. **ETH/BTC Ratio** (Default: 25%)
- Measures ETH strength relative to Bitcoin
- Below historical average = ETH undervalued = low risk
- Above historical average = ETH overvalued = high risk
3. **Volatility Regime** (Default: 20%)
- Compares current volatility to long-term average
- Compressed volatility at lows = opportunity
- Expanded volatility at highs = danger
4. **Trend Strength** (Default: 20%)
- Uses multiple EMA alignment and slope analysis
- Strong downtrends = low risk scores
- Strong uptrends = high risk scores
### Trading Logic
**Buy Signals:**
- L1: Risk ≤ 0.30 → Buy $100 (default)
- L2: Risk ≤ 0.20 → Buy $250 total
- L3: Risk ≤ 0.10 → Buy $450 total
**Sell Signals (Sequential):**
- L1: Risk ≥ 0.75 → Sell 25% of position
- L2: Risk ≥ 0.85 → Sell 35% of remaining
- L3: Risk ≥ 0.95 → Sell 40% of remaining
**Buy Filters (Optional):**
- Minimum days between buys (prevents clustering)
- Minimum risk drop required (ensures falling risk)
- Toggle on/off to compare performance
## Settings Guide
### Risk Components
Toggle individual components on/off and adjust their weights. Total weight is automatically normalized. Experiment with different combinations to match your market view.
### Advanced Settings
- ATH Lookback: How far back to look for all-time highs (500-2000 recommended)
- Volatility Period: Window for volatility calculations (40-100 recommended)
- ETH/BTC MA Period: Moving average for ratio comparison (100-300 recommended)
- Trend Period: Base period for trend calculations (50-150 recommended)
### Trading Thresholds
Customize buy/sell trigger points and position sizes. Lower buy thresholds = more aggressive accumulation. Higher sell thresholds = holding longer into bull markets.
### Buy Filters
- Enable/disable filtering system
- Min Days Between Buys: Spacing between purchases (1-3 recommended)
- Min Risk Drop: How much risk must fall (-0.001 to -0.01 range)
## Best Practices
• **Timeframe**: Works best on daily (1D) and 3-day (3D) charts
• **Initial Capital**: Set based on your DCA budget (default $10,000)
• **Backtest First**: Test different parameter combinations on historical data
• **Position Sizing**: Adjust buy amounts to match your risk tolerance
• **Monitor Filters**: Check "Filtered Buys" stat to ensure filter isn't too strict
## Use Cases
- Long-term ETH accumulation strategy
- Systematic DCA with market-adaptive buying
- Risk-based portfolio rebalancing
- Educational tool for understanding crypto market cycles
## Disclaimer
This strategy is for educational purposes only. Past performance does not guarantee future results. Cryptocurrency trading involves substantial risk. The strategy uses historical price action and technical indicators which may not predict future movements. Always do your own research and never invest more than you can afford to lose.
## Credits
Strategy concept and development by nakphanan with assistance from Claude AI (Anthropic). Built using Pine Script v5....Mostly from Claude AI!!!
## Version History
v7.0 - Initial release with 4-component risk metric, tiered trading system, and optional buy filters
DCA

ALT Risk Metric StrategyHere's a professional write-up for your ALT Risk Strategy script:
ALT/BTC Risk Strategy - Multi-Crypto DCA with Bitcoin Correlation Analysis
Overview
This strategy uses Bitcoin correlation as a risk indicator to time entries and exits for altcoins. By analyzing how your chosen altcoin performs relative to Bitcoin, the strategy identifies optimal accumulation periods (when alt/BTC is oversold) and profit-taking opportunities (when alt/BTC is overbought). Perfect for traders who want to outperform Bitcoin by strategically timing altcoin positions.
Key Innovation: Why Alt/BTC Matters
Most traders focus solely on USD price, but Alt/BTC ratios reveal true altcoin strength:
When Alt/BTC is low → Altcoin is undervalued relative to Bitcoin (buy opportunity)
When Alt/BTC is high → Altcoin has outperformed Bitcoin (take profits)
This approach captures the rotation between BTC and alts that drives crypto cycles
Key Features
📊 Advanced Technical Analysis
RSI (60% weight): Primary momentum indicator on weekly timeframe
Long-term MA Deviation (35% weight): Measures distance from 150-period baseline
MACD (5% weight): Minor confirmation signal
EMA Smoothing: Filters noise while maintaining responsiveness
All calculations performed on Alt/BTC pairs for superior market timing
💰 3-Tier DCA System
Level 1 (Risk ≤ 70): Conservative entry, base allocation
Level 2 (Risk ≤ 50): Increased allocation, strong opportunity
Level 3 (Risk ≤ 30): Maximum allocation, extreme undervaluation
Continuous buying: Executes every bar while below threshold for true DCA behavior
Cumulative sizing: L3 triggers = L1 + L2 + L3 amounts combined
📈 Smart Profit Management
Sequential selling: Must complete L1 before L2, L2 before L3
Percentage-based exits: Sell portions of position, not fixed amounts
Auto-reset on re-entry: New buy signals reset sell progression
Prevents premature full exits during volatile conditions
🤖 3Commas Automation
Pre-configured JSON webhooks for Custom Signal Bots
Multi-exchange support: Binance, Coinbase, Kraken, Bitfinex, Bybit
Flexible quote currency: USD, USDT, or BUSD
Dynamic order sizing: Automatically adjusts to your tier thresholds
Full webhook documentation compliance
🎨 Multi-Asset Support
Pre-configured for popular altcoins:
ETH (Ethereum)
SOL (Solana)
ADA (Cardano)
LINK (Chainlink)
UNI (Uniswap)
XRP (Ripple)
DOGE
RENDER
Custom option for any other crypto
How It Works
Risk Metric Calculation (0-100 scale):
Fetches weekly Alt/BTC price data for stability
Calculates RSI, MACD, and deviation from 150-period MA
Normalizes MACD to 0-100 range using 500-bar lookback
Combines weighted components: (MACD × 0.05) + (RSI × 0.60) + (Deviation × 0.35)
Applies 5-period EMA smoothing for cleaner signals
Color-Coded Risk Zones:
Green (0-30): Extreme buying opportunity - Alt heavily oversold vs BTC
Lime/Yellow (30-70): Accumulation range - favorable risk/reward
Orange (70-85): Caution zone - consider taking initial profits
Red/Maroon (85-100+): Euphoria zone - aggressive profit-taking
Entry Logic:
Buys execute every candle when risk is below threshold
As risk decreases, position sizing automatically scales up
Example: If risk drops from 60→25, you'll be buying at L1 rate until it hits 50, then L2 rate, then L3 rate
Exit Logic:
Sells only trigger when in profit AND risk exceeds thresholds
Sequential execution ensures partial profit-taking
If new buy signal occurs before all sells complete, sell levels reset to L1
Configuration Guide
Choosing Your Altcoin:
Select crypto from dropdown (or use CUSTOM for unlisted coins)
Pick your exchange
Choose quote currency (USD, USDT, BUSD)
Risk Metric Tuning:
Long Term MA (default 150): Higher = more extreme signals, Lower = more frequent
RSI Length (default 10): Lower = more volatile, Higher = smoother
Smoothing (default 5): Increase for less noise, decrease for faster reaction
Buy Settings (Aggressive DCA Example):
L1 Threshold: 70 | Amount: $5
L2 Threshold: 50 | Amount: $6
L3 Threshold: 30 | Amount: $7
Total L3 buy = $18 per candle when deeply oversold
Sell Settings (Balanced Exit Example):
L1: 70 threshold, 25% position
L2: 85 threshold, 35% position
L3: 100 threshold, 40% position (final exit)
3Commas Setup
Bot Configuration:
Create Custom Signal Bot in 3Commas
Set trading pair to your altcoin/USD (e.g., ETH/USD, SOL/USDT)
Order size: Select "Send in webhook, quote" to use strategy's dollar amounts
Copy Bot UUID and Secret Token
Script Configuration:
Paste credentials into 3Commas section inputs
Check "Enable 3Commas Alerts"
Save and apply to chart
TradingView Alert:
Create Alert → Condition: "alert() function calls only"
Webhook URL: api.3commas.io
Enable "Webhook URL" checkbox
Expiration: Open-ended
Strategy Advantages
✅ Outperform Bitcoin: Designed specifically to beat BTC by timing alt rotations
✅ Capture Alt Seasons: Automatically accumulates when alts lag, sells when they pump
✅ Risk-Adjusted Sizing: Buys more when cheaper (better risk/reward)
✅ Emotional Discipline: Systematic approach removes fear and FOMO
✅ Multi-Asset: Run same strategy across multiple altcoins simultaneously
✅ Proven Indicators: Combines RSI, MACD, and MA deviation - battle-tested tools
Backtesting Insights
Optimal Timeframes:
Daily chart: Best for backtesting and signal generation
Weekly data is fetched internally regardless of display timeframe
Historical Performance Characteristics:
Accumulates heavily during bear markets and BTC dominance periods
Captures explosive altcoin rallies when BTC stagnates
Sequential selling preserves capital during extended downtrends
Works best on established altcoins with multi-year history
Risk Considerations:
Requires capital reserves for extended accumulation periods
Some altcoins may never recover if fundamentals deteriorate
Past correlation patterns may not predict future performance
Always size positions according to personal risk tolerance
Visual Interface
Indicator Panel Displays:
Dynamic color line: Green→Lime→Yellow→Orange→Red as risk increases
Horizontal threshold lines: Dashed lines mark your buy/sell levels
Entry/Exit labels: Green labels for buys, Orange/Red/Maroon for sells
Real-time risk value: Numerical display on price scale
Customization:
All threshold lines are adjustable via inputs
Color scheme clearly differentiates buy zones (green spectrum) from sell zones (red spectrum)
Line weights emphasize most extreme thresholds (L3 buy and L3 sell)
Strategy Philosophy
This strategy is built on the principle that altcoins move in cycles relative to Bitcoin. During Bitcoin rallies, alts often bleed against BTC (high sell, accumulate). When Bitcoin consolidates, alts pump (take profits). By measuring risk on the Alt/BTC chart instead of USD price, we time these rotations with precision.
The 3-tier system ensures you're always averaging in at better prices and scaling out at better prices, maximizing your Bitcoin-denominated returns.
Advanced Tips
Multi-Bot Strategy:
Run this on 5-10 different altcoins simultaneously to:
Diversify correlation risk
Capture whichever alt is pumping
Smooth equity curve through rotation
Pairing with BTC Strategy:
Use alongside the BTC DCA Risk Strategy for complete portfolio coverage:
BTC strategy for core holdings
ALT strategies for alpha generation
Rebalance between them based on BTC dominance
Threshold Calibration:
Check 2-3 years of historical data for your chosen alt
Note where risk metric sat during major bottoms (set buy thresholds)
Note where it peaked during euphoria (set sell thresholds)
Adjust for your risk tolerance and holding period
Credits
Strategy Development & 3Commas Integration: Claude AI (Anthropic)
Technical Analysis Framework: RSI, MACD, Moving Average theory
Implementation: pommesUNDwurst
Disclaimer
This strategy is for educational purposes only. Cryptocurrency trading involves substantial risk of loss. Altcoins are especially volatile and many fail completely. The strategy assumes liquid markets and reliable Alt/BTC price data. Always do your own research, understand the fundamentals of any asset you trade, and never risk more than you can afford to lose. Past performance does not guarantee future results. The authors are not financial advisors and assume no liability for trading decisions.
Additional Warning: Using leverage or trading illiquid altcoins amplifies risk significantly. This strategy is designed for spot trading of established cryptocurrencies with deep liquidity.
Tags: Altcoin, Alt/BTC, DCA, Risk Metric, Dollar Cost Averaging, 3Commas, ETH, SOL, Crypto Rotation, Bitcoin Correlation, Automated Trading, Alt Season
Feel free to modify any sections to better match your style or add specific backtesting results you've observed! 🚀Claude is AI and can make mistakes. Please double-check responses. Sonnet 4.5

BTC DCA Risk Metric StrategyBTC DCA Risk Strategy - Automated Dollar Cost Averaging with 3Commas Integration
Overview
This strategy combines the proven Oakley Wood Risk Metric with an intelligent tiered Dollar Cost Averaging (DCA) system, designed to help traders systematically accumulate Bitcoin during periods of low risk and take profits during high-risk conditions.
Key Features
📊 Multi-Component Risk Assessment
4-Year SMA Deviation: Measures Bitcoin's distance from its long-term mean
20-Week MA Analysis: Tracks medium-term momentum shifts
50-Day/50-Week MA Ratio: Captures short-to-medium term trend strength
All metrics are normalized by time to account for Bitcoin's maturing market dynamics
💰 3-Tier DCA Buy System
Level 1 (Low Risk): Conservative entry with base allocation
Level 2 (Lower Risk): Increased allocation as opportunity improves
Level 3 (Extreme Low Risk): Maximum allocation during rare buying opportunities
Buys execute every bar while risk remains below thresholds, enabling true DCA accumulation
📈 Progressive Profit Taking
Sell Level 1: Take initial profits as risk increases
Sell Level 2: Scale out further positions during elevated risk
Sell Level 3: Final exit during extreme market conditions
Sell levels automatically reset when new buy signals occur, allowing flexible re-entry
🤖 3Commas Integration
Fully automated webhook alerts for Custom Signal Bots
JSON payloads formatted per 3Commas API specifications
Supports multiple exchanges (Binance, Coinbase, Kraken, Gemini, Bybit)
Configurable quote currency (USD, USDT, BUSD)
How It Works
The strategy calculates a composite risk metric (0-1 scale):
0.0-0.2: Extreme buying opportunity (green zone)
0.2-0.5: Favorable accumulation range (yellow zone)
0.5-0.8: Neutral to cautious territory (orange zone)
0.8-1.0+: High risk, profit-taking zone (red zone)
Buy Logic: As risk decreases, position sizes increase automatically. If risk drops from L1 to L3 threshold, the strategy combines all three tier allocations for maximum exposure.
Sell Logic: Sequential profit-taking ensures you capture gains progressively. The system won't advance to Sell L2 until L1 completes, preventing premature full exits.
Configuration
Risk Metric Parameters:
All calculations use Bitcoin price data (any BTC chart works)
Time-normalized formulas adapt to market maturity
No manual parameter tuning required
Buy Settings:
Set risk thresholds for each tier (default: 0.20, 0.10, 0.00)
Define dollar amounts per tier (default: $10, $15, $20)
Fully customizable to your risk tolerance and capital
Sell Settings:
Configure risk thresholds for profit-taking (default: 1.00, 1.50, 2.00)
Set percentage of position to sell at each level (default: 25%, 35%, 40%)
3Commas Setup:
Create a Custom Signal Bot in 3Commas
Copy Bot UUID and Secret Token into strategy inputs
Enable 3Commas Alerts checkbox
Create TradingView alert: Condition → "alert() function calls only", Webhook → api.3commas.io
Backtesting Results
Strengths:
Systematically buys dips without emotion
Averages down during extended bear markets
Captures explosive bull run profits through tiered exits
Pyramiding (1000 max orders) allows true DCA behavior
Considerations:
Requires sufficient capital for multiple buys during prolonged downtrends
Backtest on Daily timeframe for most reliable signals
Past performance does not guarantee future results
Visual Design
The indicator pane displays:
Color-coded risk metric line: Changes from white→red→orange→yellow→green as risk decreases
Background zones: Green (buy), yellow (hold), red (sell) areas
Dashed threshold lines: Clear visual markers for each buy/sell level
Entry/Exit labels: Green buy labels and orange/red sell labels mark all trades
Credits
Original Risk Metric: Oakley Wood
Strategy Development & 3Commas Integration: Claude AI (Anthropic)
Modifications: pommesUNDwurst
Disclaimer
This strategy is for educational and informational purposes only. Cryptocurrency trading carries substantial risk of loss. Always conduct your own research and never invest more than you can afford to lose. The authors are not financial advisors and assume no responsibility for trading decisions made using this tool.

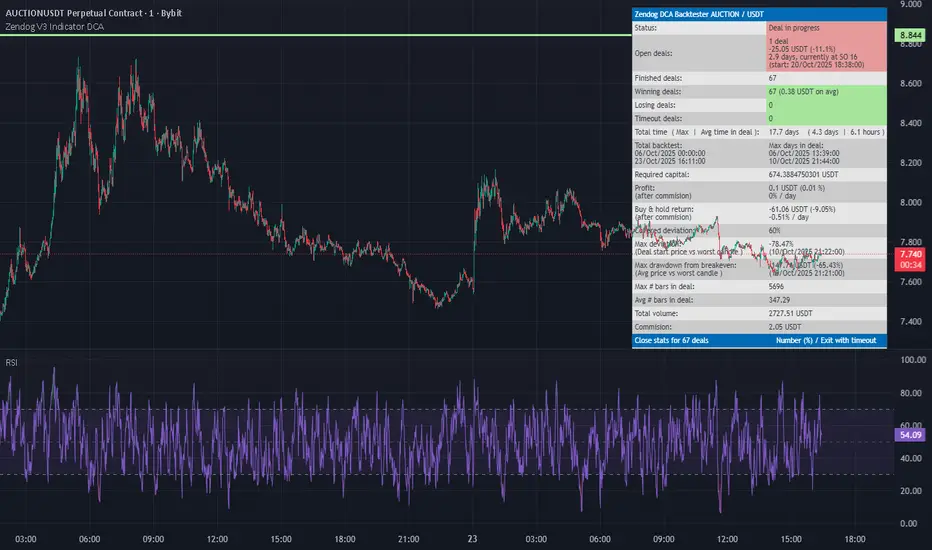
Zendog V3 Indicator DCAThis strategy is same as Zendog v3 but edited to be backtest compatible for SO additions through indicator
for Longs
Safety order type = External indicator
External indicator = RSI 30/70 : Long Trigger
Safety Order Value = 1
for Shorts
Safety order type = External indicator
External indicator = RSI 30/70 : Short Trigger
Safety Order Value = 2
Adaptive MVRV & RSI Strategy V6 (Dynamic Thresholds)Strategy Explanation
This is an advanced Dollar-Cost Averaging (DCA) strategy for Bitcoin that aims to adapt to long-term market cycles and changing volatility. Instead of relying on fixed buy/sell signals, it uses a dynamic, weighted approach based on a combination of on-chain data and classic momentum.
Core Components:
Dual-Indicator Signal: The strategy combines two powerful indicators for a more robust signal:
MVRV Ratio: An on-chain metric to identify when Bitcoin is fundamentally over or undervalued relative to its historical cost basis.
Weekly RSI: A classic momentum indicator to gauge long-term market strength and identify overbought/oversold conditions.
Dynamic, Self-Adjusting Thresholds: The core innovation of this strategy is that it avoids fixed thresholds (e.g., "sell when RSI is 70"). Instead, the buy and sell zones are dynamically calculated based on a long-term (2-year) moving average and standard deviation of each indicator. This allows the strategy to automatically adapt to Bitcoin's decreasing volatility and changing market structure over time.
Weighted DCA (Scaling In & Out): The strategy doesn't just buy or sell a fixed amount. The size of its trades is scaled based on conviction:
Buying: As the MVRV and RSI fall deeper into their "undervalued" zones, the percentage of available cash used for each purchase increases.
Selling: As the indicators rise further into "overvalued" territory, the percentage of the current position sold also increases.
This creates an adaptive system that systematically accumulates during periods of fear and distributes during periods of euphoria, with the intensity of its actions directly tied to the extremity of market conditions.

SmartScale Envelope DCA This is a Dollar-Cost Averaging (DCA) long strategy that buys when price dips below a moving average envelope and adds to the position in a stepwise, risk-controlled way. It uses up to 8 buy-ins, applies a cooldown between entries, and exits based on either a take profit from average entry price or a stop loss. Backtest range limits trades to the last 365 days for backtest control.
All input settings can and should be adjusted to the chart, as volatility in price action varies. Simply go into the inputs settings, and start from the top and move down to get better backtest results. Moving from the top down has been proven to give the best results. Then, move to properties and set your order size, pyramiding, and so on. It may be necessary to then fine tune your adjustments a second time to dial it in.
Works well on 1 hour time frames and in volatility.
Happy Trading!

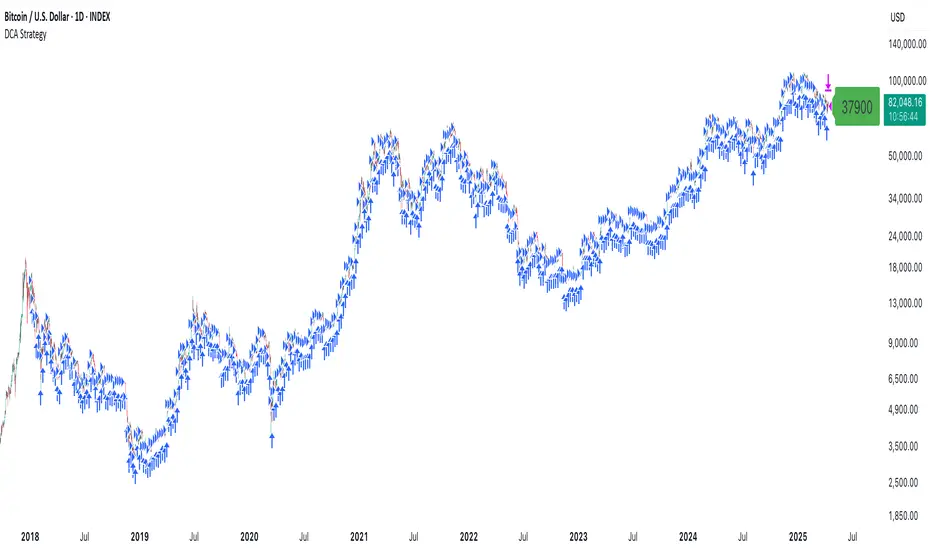
DCA StrategyThis strategy makes it easy for you to backtest and automate the DCA strategy based on 2 triggers:
Day of the week
Every X candles
This way you can set up your DCA strategy the way you like and automate on any exchange or even a DEX, which offers an API.
The strategy is auto selling on the last candle, otherwise you won't see any performance numbers because all positions will still be open (non conclusive).
Settings
Start Date & End Date
Use those dates to help you with your backtest period. It also helps when automating, to start at a specific time to mimic what you have already done on your own portfolio and thus be in sync in TV as well.
Capital to invest per trade
Set how capital to use per DCA buy signal. Hover over the tooltip to understand, which currency is used.
Close All on last candle
When backtesting, you must close open positions, otherwise the Strategy Tester won't show you any numbers. This is why the strategy automatically closes all positions on the last candle for your convenience (ON per default).
BUT, when automating, you cannot have this checked because it would sell all of your asset on every candle open. So turn this OFF when automating.
Use Day of Week Mode
This checkbox switches between the "Day of Week" mode or the "Every X Candles" mode.
Day of Week
Opens a long position at the start of the weekday you have set it to.
Hover over the tooltip to understand, which number to use for the day of the week you need.
Every X Candles
Opens a long position after every x candles. Always at the start of every such candle.
On the daily chart, this number represents "1 day", on the 1h chart, it's "1 hour" and so on.
Properties
Initial Capital
DCA has a special quirk and that is that it invests more and more and more funds the longer it runs. But TradingView takes the Initial Capital number to calculate Net Profit, thus the Initial Capital number has to grow with every additional dollar (money) that is being invested over time, otherwise the Net Profit number will be wrong.
Sadly PineScript does not allow to set the Initial Capital number dynamically. So you have to set it manually.
To that end, this strategy shows a Label on the last candle, which shows the Invested Capital. You must take that number and put it into the Initial Capital input and click Ok .
If you don't do this, your Net Profit Number will be totally wrong!
The label must show green .
If it shows red it means you need to change the Initial Capital number before looking at the performance numbers.
After every timeframe or settings change, you must adapt the Initial Capital, otherwise you will get wrong numbers.
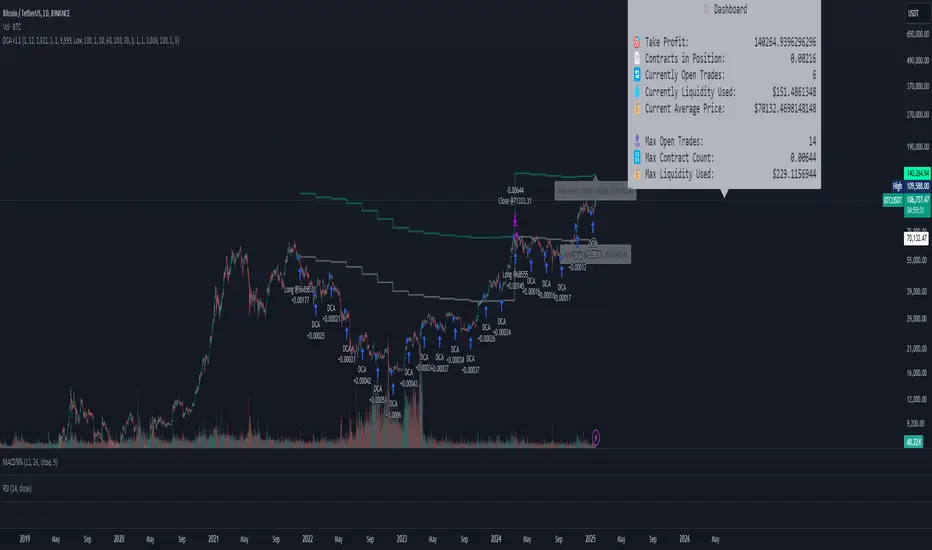
DCA Simulation for CryptoCommunity v1.1Overview
This script provides a detailed simulation of a Dollar-Cost Averaging (DCA) strategy tailored for crypto traders. It allows users to visualize how their DCA strategy would perform historically under specific parameters. The script is designed to help traders understand the mechanics of DCA and how it influences average price movement, budget utilization, and trade outcomes.
Key Features:
Combines Interval and Safety Order DCA:
Interval DCA: Regular purchases based on predefined time intervals.
Safety Order DCA: Additional buys triggered by percentage price drops.
Interactive Visualization:
Displays buy levels, average price, and profit-taking points on the chart.
Allows traders to assess how their strategy adapts to price movements.
Comprehensive Dashboard:
Tracks money spent, contracts acquired, and budget utilization.
Shows maximum amounts used if profit-taking is active.
Dynamic Safety Orders:
Resets safety orders when a new higher high is established.
Customizable Parameters:
Adjustable buy frequency, safety order settings, and profit-taking levels.
Suitable for traders with varying budgets and risk tolerances.
Default Strategy Settings:
Account Size: Default account size is set to $10,000 to represent a realistic budget for the average trader.
Commission & Slippage: Includes realistic trading fees and slippage assumptions to ensure accurate backtesting results.
Risk Management: Defaults to risking no more than 5% of the account balance per trade.
Sample Size: Optimized to generate a minimum of 100 trades for meaningful statistical analysis. Users can adjust parameters to fit longer timeframes or different datasets.
Usage Instructions:
Configure Your Strategy: Set the base order, safety order size, and buy frequency based on your preferred DCA approach.
Analyze Historical Performance: Use the chart and dashboard to understand how the strategy performs under different market conditions.
Optimize Parameters: Adjust settings to align with your risk tolerance and trading objectives.
Important Notes:
This script is for educational and simulation purposes. It is not intended to provide financial advice or guarantee profitability.
If the strategy's default settings do not meet your needs, feel free to adjust them while keeping risk management in mind.
TradingView limits the number of open trades to 999, so reduce the buy frequency if necessary to fit longer timeframes.
00 Averaging Down Backtest Strategy by RPAlawyer v21FOR EDUCATIONAL PURPOSES ONLY! THE CODE IS NOT YET FULLY DEVELOPED, BUT IT CAN PROVIDE INTERESTING DATA AND INSIGHTS IN ITS CURRENT STATE.
This strategy is an 'averaging down' backtester strategy. The goal of averaging/doubling down is to buy more of an asset at a lower price to reduce your average entry price.
This backtester code proves why you shouldn't do averaging down, but the code can be developed (and will be developed) further, and there might be settings even in its current form that prove that averaging down can be done effectively.
Different averaging down strategies exist:
- Linear/Fixed Amount: buy $1000 every time price drops 5%
- Grid Trading: Placing orders at price levels, often with increasing size, like $1000 at -5%, $2000 at -10%
- Martingale: doubling the position size with each new entry
- Reverse Martingale: decreasing position size as price falls: $4000, then $2000, then $1000
- Percentage-Based: position size based on % of remaining capital, like 10% of available funds at each level
- Dynamic/Adaptive: larger entries during high volatility, smaller during low
- Logarithmic: position sizes increase logarithmically as price drops
Unlike the above average costing strategies, it applies averaging down (I use DCA as a synonym) at a very strong trend reversal. So not at a certain predetermined percentage negative PNL % but at a trend reversal signaled by an indicator - hence it most closely resembles a dynamically moving grid DCA strategy.
Both entering the trade and averaging down assume a strong trend. The signals for trend detection are provided by an indicator that I published under the name '00 Parabolic SAR Trend Following Signals by RPAlawyer', but any indicator that generates numeric signals of 1 and -1 for buy and sell signals can be used.
The indicator must be connected to the strategy: in the strategy settings under 'External Source' you need to select '00 Parabolic SAR Trend Following Signals by RPAlawyer: Connector'. From this point, the strategy detects when the indicator generates buy and sell signals.
The strategy considers a strong trend when a buy signal appears above a very conservative ATR band, or a sell signal below the ATR band. The conservative ATR is chosen to filter ranging markets. This very conservative ATR setting has a default multiplier of 8 and length of 40. The multiplier can be increased up to 10, but there will be very few buy and sell signals at that level and DCA requirements will be very high. Trade entry and DCA occur at these strong trends. In the settings, the 'ATR Filter' setting determines the entry condition (e.g., ATR Filter multiplier of 9), and the 'DCA ATR' determines when DCA will happen (e.g., DCA ATR multiplier of 6).
The DCA levels and DCA amounts are determined as follows:
The first DCA occurs below the DCA Base Deviation% level (see settings, default 3%) which acts as a threshold. The thick green line indicates the long position avg price, and the thin red line below the green line indicates the 3% DCA threshold for long positions. The thick red line indicates the short position avg price, and the thin red line above the thick red line indicates the short position 3% DCA threshold. DCA size multiplier defines the DCA amount invested.
If the loss exceeds 3% AND a buy signal arrives below the lower ATR band for longs, or a sell signal arrives above the upper ATR band for shorts, then the first DCA will be executed. So the first DCA won't happen at 3%, rather 3% is a threshold where the additional condition is that the price must close above or below the ATR band (let's say the first DCA occured at 8%) – this is why the code resembles a dynamic grid strategy, where the grid moves such that alongside the first 3% threshold, a strong trend must also appear for DCA. At this point, the thick green/red line moves because the avg price is modified as a result of the DCA, and the thin red line indicating the next DCA level also moves. The next DCA level is determined by the first DCA level, meaning modified avg price plus an additional +8% + (3% * the Step Scale Multiplier in the settings). This next DCA level will be indicated by the modified thin red line, and the price must break through this level and again break through the ATR band for the second DCA to occur.
Since all this wasn't complicated enough, and I was always obsessed by the idea that when we're sitting in an underwater position for days, doing DCA and waiting for the price to correct, we can actually enter a short position on the other side, on which we can realize profit (if the broker allows taking hedge positions, Binance allows this in Europe).
This opposite position in this strategy can open from the point AFTER THE FIRST DCA OF THE BASE POSITION OCCURS. This base position first DCA actually indicates that the price has already moved against us significantly so time to earn some money on the other side. Breaking through the ATR band is also a condition for entry here, so the hedge position entry is not automatic, and the condition for further DCA is breaking through the DCA Base Deviation (default 3%) and breaking through the ATR band. So for the 'hedge' or rather opposite position, the entry and further DCA conditions are the same as for the base position. The hedge position avg price is indicated by a thick black line and the Next Hedge DCA Level is indicated by a thin black line.
The TPs are indicated by green labels for base positions and red labels for hedge positions.
No SL built into the strategy at this point but you are free to do your coding.
Summary data can be found in the upper right corner.
The fantastic trend reversal indicator Machine learning: Lorentzian Classification by jdehorty can be used as an external indicator, choose 'backtest stream' for the external source. The ATR Band multiplicators need to be reduced to 5-6 when using Lorentz.
The code can be further developed in several aspects, and as I write this, I already have a few ideas 😊

TTP Intelligent AccumulatorThe intelligent accumulator is a proof of concept strategy. A hybrid between a recurring buy and TA-based entries and exits.
Distribute the amount of equity and add to your position as long as the TA condition is valid.
Use the exit TA condition to define your exit strategy.
Decide between adding only into losing positions to average down or take a riskier approach by allowing to add into a winning position as well.
Take full profit or distribute your exit into multiple take profit exists of the same size.
You can also decide if you allow your exit conditions to close your position in a loss or require a minimum take profit %.
The strategy includes a default built-in TA conditions just for showcasing the idea but the final intent of this script is to delegate the TA entries and exists to external sources.
The internal conditions use RSI length 7 crossing below the BB with std 1 for entries and above for exits.
To control the number of orders use the properties from settings:
- adjust the pyramiding
- adjust the percentage of equity
- make sure that pyramiding * % equity equals 100 to prevent over use of equity (unless using leverage)
The script is designed as an alternative to daily or weekly recurring buys but depending on the accuracy of your TA conditions it might prove profitable also in lower timeframes.
The reason the script is named Intelligent is because recurring buy is most commonly used without any decision making: buy no matter what with certain frequency. This strategy seeks to still perform recurring buys but filtering out some of the potential bad entries that can delay unnecessarily seeing the position in profits. The second reason is also securing an exit strategy from the beginning which no recurring buy option offers out-of-the-box.

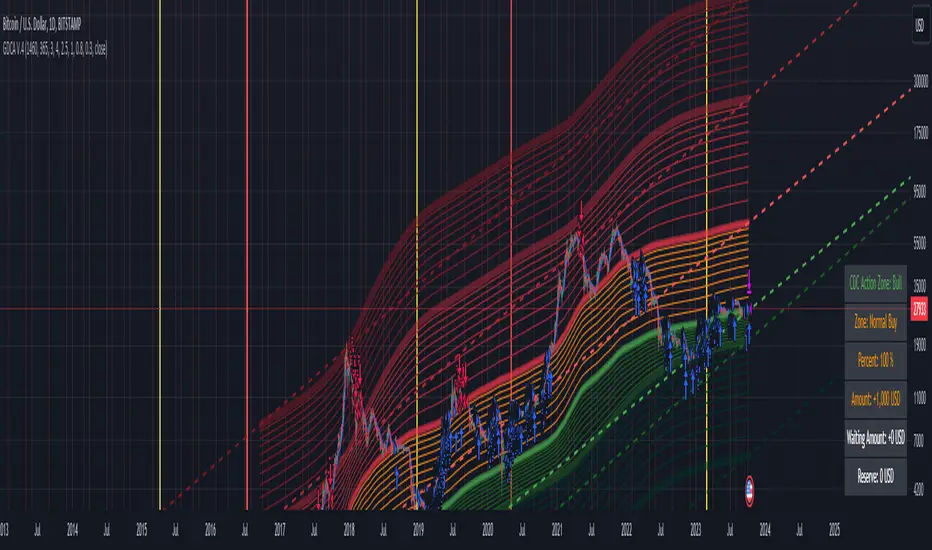
Grospector DCA V.4This is system for DCA with strategy and can trade on trend technique "CDC Action Zone".
We upgrade Grospector DCA V.3 by minimizing unnecessary components and it is not error price predictions.
This has 5 zone Extreme high , high , normal , low , Extreme low. You can dynamic set min - max percent every zone.
Extreme zone is derivative short and long which It change Extreme zone to Normal zone all position will be closed.
Every Zone is splitted 10 channel. and this strategy calculate contribution.
and now can predict price in future.
Idea : Everything has average in its life. For bitcoin use 4 years for halving. I think it will be interesting price.
Default : I set MA is 365*4 days and average it again with 365 days.
Input :
len: This input represents the length of the moving average.
strongLen: This input represents the length of the moving average used to calculate the strong buy and strong sell zone.
shortMulti: This input represents the multiplier * moveing average used to calculate the short zone.
strongSellMulti: This input represents the multiplier used to calculate the strong sell signal.
sellMulti: This input represents the multiplier * moveing average used to calculate the sell zone.
strongBuyMulti: This input represents the multiplier used to calculate the strong sell signal.
longMulti: This input represents the multiplier * moveing average used to calculate the long zone.
*Diff sellMulti and strongBuyMulti which is normal zone.
useDerivative: This input is a boolean flag that determines whether to use the derivative display zone. If set to true, the derivative display zone will be used, otherwise it will be hidden.
zoneSwitch: This input determines where to display the channel signals. A value of 1 will display the signals in all zones, a value of 2 will display the signals in the chart pane, a value of 3 will display the signals in the data window, and a value of 4 will hide the signals.
price: Defines the price source used for the indicator calculations. The user can select from various options, with the default being the closing price.
labelSwitch: Defines whether to display assistive text on the chart. The user can select a boolean value (true/false), with the default being true.
zoneSwitch: Defines which areas of the chart to display assistive zones. The user can select from four options: 1 = all, 2 = chart only, 3 = data only, 4 = none. The default value is 2.
predictFuturePrice: Defines whether to display predicted future prices on the chart. The user can select a boolean value (true/false), with the default being true.
DCA: Defines the dollar amount to use for dollar-cost averaging (DCA) trades. The user can input an integer value, with a default value of 5.
WaitingDCA: Defines the amount of time to wait before executing a DCA trade. The user can input a float value, with a default value of 0.
Invested: Defines the amount of money invested in the asset. The user can input an integer value, with a default value of 0.
strategySwitch: Defines whether to turn on the trading strategy. The user can select a boolean value (true/false), with the default being true.
seperateDayOfMonth: Defines a specific day of the month on which to execute trades. The user can input an integer value from 1-31, with the default being 28.
useReserve: Defines whether to use a reserve amount for trading. The user can select a boolean value (true/false), with the default being true.
useDerivative: Defines whether to use derivative data for the indicator calculations. The user can select a boolean value (true/false), with the default being true.
useHalving: Defines whether to use halving data for the indicator calculations. The user can select a boolean value (true/false), with the default being true.
extendHalfOfHalving: Defines the amount of time to extend the halving date. The user can input an integer value, with the default being 200.
Every Zone: It calculate percent from top to bottom which every zone will be splited 10 step.
To effectively make the DCA plan, I recommend adopting a comprehensive strategy that takes into consideration your mindset as the best indicator of the optimal approach. By leveraging your mindset, the task can be made more manageable and adaptable to any market
Dollar-cost averaging (DCA) is a suitable investment strategy for sound money and growth assets which It is Bitcoin, as it allows for consistent and disciplined investment over time, minimizing the impact of market volatility and potential risks associated with market timing
Simple_RSI+PA+DCA StrategyThis strategy is a result of a study to understand better the workings of functions, for loops and the use of lines to visualize price levels. The strategy is a complete rewrite of the older RSI+PA+DCA Strategy with the goal to make it dynamic and to simplify the strategy settings to the bare minimum.
In case you are not familiar with the older RSI+PA+DCA Strategy, here is a short explanation of the idea behind the strategy:
The idea behind the strategy based on an RSI strategy of buying low. A position is entered when the RSI and moving average conditions are met. The position is closed when it reaches a specified take profit percentage. As soon as the first the position is opened multiple PA (price average) layers are setup based on a specified percentage of price drop. When the price hits the layer another position with the same position size is is opened. This causes the average cost price (the white line) to decrease. If the price drops more, another position is opened with another price average decrease as result. When the price starts rising again the different positions are separately closed when each reaches the specified take profit. The positions can be re-opened when the price drops again. And so on. When the price rises more and crosses over the average price and reached the specified Stop level (the red line) on top of it, it closes all the positions at once and cancels all orders. From that moment on it waits for another price dip before it opens a new position.
This is the old RSI+PA+DCA Strategy:
The reason to completely rewrite the code for this strategy is to create a more automated, adaptable and dynamic system. The old version is static and because of the linear use of code the amount of DCA levels were fixed to max 6 layers. If you want to add more DCA layers you manually need to change the script and add extra code. The big difference in the new version is that you can specify the amount of DCA layers in the strategy settings. The use of 'for loops' in the code gives the possibility to make this very dynamic and adaptable.
The RSI code is adapted, just like the old version, from the RSI Strategy - Buy The Dips by Coinrule and is used for study purpose. Any other low/dip finding indicator can be used as well
The distance between the DCA layers are calculated exponentially in a function. In the settings you can define the exponential scale to create the distance between the layers. The bigger the scale the bigger the distance. This calculation is not working perfectly yet and needs way more experimentation. Feel free to leave a comment if you have a better idea about this.
The idea behind generating DCA layers with a 'for loop' is inspired by the Backtesting 3commas DCA Bot v2 by rouxam .
The ideas for creating a dynamic position count and for opening and closing different positions separately based on a specified take profit are taken from the Simple_Pyramiding strategy I wrote previously.
This code is a result of a study and not intended for use as a full functioning strategy. To make the code understandable for users that are not so much introduced into pine script (like myself), every step in the code is commented to explain what it does. Hopefully it helps.
Enjoy!

DCA Simulator A simple yet powerful Dollar Cost Averaging (DCA) simulator.
You just add the script to your chart, and you'll be able to see:
- Every single entry with its size
- The evolution of you average price in time (blue line)
- The profit and loss areas (where market price < average price the DCA is at loss, and the background is colored in red. At the contrary, where mkt price is > average price, it's profit area and the background is green).
- Max drawdown: the point in price and time where the DCA loss is maximum in the considered time interval. The drawdown amount is specified.
- Profit (or loss) and total cost at the end of the time interval or at the present day: the script shows how much the DCA is netting at a profit or loss, as well as the total cost of the DCA itself.
The parameters are:
- Date start and date end: time interval of the DCA simulation
- DCA period (you can choose between daily, weekly and monthly)
- Week day or month day if you choose those periods
- Single operation size (in base currency)
- Option to choose a DCA LONG or DCA SHORT (for uber bears)
- Option to include an exit strategy that partially closes your position (the % size closed can be chosen as well with the parameter "exit_close_perc") every time the DCA realizes a specific gain (choosable with the parameter "exit_gain_threshold"). If you choose "none" as an exit strategy, the script will assume to never close positions until the end of the period or the present day for simulation purpose.
NB: just ignore the TV strategy tester results, all the data are visible on the chart.

Linear EDCA v1.2Strategy Description:
Linear EDCA (Linear Enhanced Dollar Cost Averaging) is an enhanced version of the DCA fixed investment strategy. It has the following features:
1. Take the 1100-day SMA as a reference indicator, enter the buy range below the moving average, and enter the sell range above the moving average
2. The order to buy and sell is carried out at different "speed", which are set with two linear functions, and you can change the slope of the linear function to achieve different trading position control purposes
3. This fixed investment is a low-frequency strategy and only works on a daily level cycle
----------------
Strategy backtest performance:
BTCUSD (September 2014~September 2022): Net profit margin 26378%, maximum floating loss 47.12% (2015-01-14)
ETHUSD (August 2018~September 2022): Net profit margin 1669%, maximum floating loss 49.63% (2018-12-14)
----------------
How the strategy works:
Buying Conditions:
The closing price of the day is below the 1100 SMA, and the ratio of buying positions is determined by the deviation of the closing price from the moving average and the buySlope parameter
Selling Conditions:
The closing price of the day is above the 1100 SMA, and the ratio of the selling position is determined by the deviation of the closing price and the moving average and the sellSlope parameter
special case:
When the sellOffset parameter>0, it will maintain a small buy within a certain range above the 1100 SMA to avoid prematurely starting to sell
The maximum ratio of a single buy position does not exceed defInvestRatio * maxBuyRate
The maximum ratio of a single sell position does not exceed defInvestRatio * maxSellRate
----------------
Version Information:
Current version v1.2 (the first officially released version)
v1.2 version setting parameter description:
defInvestRatio: The default fixed investment ratio, the strategy will calculate the position ratio of a single fixed investment based on this ratio and a linear function. The default 0.025 represents 2.5% of the position
buySlope: the slope of the linear function of the order to buy, used to control the position ratio of a single buy
sellSlope: the slope of the linear function of the order to sell, used to control the position ratio of a single sell
sellOffset: The offset of the order to sell. If it is greater than 0, it will keep a small buy within a certain range to avoid starting to sell too early
maxSellRate: Controls the maximum sell multiple. The maximum ratio of a single sell position does not exceed defInvestRatio * maxSellRate
maxBuyRate: Controls the maximum buy multiple. The maximum ratio of a single buy position does not exceed defInvestRatio * maxBuyRate
maPeriod: the length of the moving average, 1100-day MA is used by default
smoothing: moving average smoothing algorithm, SMA is used by default
useDateFilter: Whether to specify a date range when backtesting
settleOnEnd: If useDateFilter==true, whether to close the position after the end date
startDate: If useDateFilter==true, specify the backtest start date
endDate: If useDateFilter==true, specify the end date of the backtest
investDayofweek: Invest on the day of the week, the default is to close on Monday
intervalDays: The minimum number of days between each invest. Since it is calculated on a weekly basis, this number must be 7 or a multiple of 7
The v1.2 version data window indicator description (only important indicators are listed):
MA: 1100-day SMA
RoR%: floating profit and loss of the current position
maxLoss%: The maximum floating loss of the position. Note that this floating loss represents the floating loss of the position, and does not represent the floating loss of the overall account. For example, the current position is 1%, the floating loss is 50%, the overall account floating loss is 0.5%, but the position floating loss is 50%
maxGain%: The maximum floating profit of the position. Note that this floating profit represents the floating profit of the position, and does not represent the floating profit of the overall account.
positionPercent%: position percentage
positionAvgPrice: position average holding cost
--------------------------------
策略说明:
Linear EDCA(Linear Enhanced Dollar Cost Averaging)是一个DCA定投策略的增强版本,它具有如下特性:
1. 以1100日SMA均线作为参考指标,在均线以下进入定买区间,在均线以上进入定卖区间
2. 定买和定卖以不同的“速率”进行,它们用两条线性函数设定,并且你可以通过改变线性函数的斜率,以达到不同的买卖仓位控制的目的
3. 本定投作为低频策略,只在日级别周期工作
----------------
策略回测表现:
BTCUSD(2014年09月~2022年09月):净利润率26378%,最大浮亏47.12%(2015-01-14)
ETHUSD(2018年08~2022年09月):净利润率1669%,最大浮亏49.63%(2018-12-14)
----------------
策略工作原理:
买入条件:
当日收盘价在 1100 SMA 之下,由收盘价和均线的偏离度,以及buySlope参数决定买入仓位比例
卖出条件:
当日收盘价在 1100 SMA之上,由收盘价和均线的偏离度,以及sellSlope参数决定卖出仓位比例
特例:
当sellOffset参数>0,则在 1100 SMA以上一定范围内还会保持小幅买入,避免过早开始卖出
单次买入仓位比例最大不超过 defInvestRatio * maxBuyRate
单次卖出仓位比例最大不超过 defInvestRatio * maxSellRate
----------------
版本信息:
当前版本v1.2(第一个正式发布的版本)
v1.2版本设置参数说明:
defInvestRatio: 默认定投比例,策略会根据此比例和线性函数计算得出单次定投的仓位比例。默认0.025代表2.5%仓位
buySlope: 定买的线性函数斜率,用来控制单次买入的仓位倍率
sellSlope: 定卖的线性函数斜率,用来控制单次卖出的仓位倍率
sellOffset: 定卖的偏移度,如果大于0,则在一定范围内还会保持小幅买入,避免过早开始卖出
maxSellRate: 控制最大卖出倍率。单次卖出仓位比例最大不超过 defInvestRatio * maxSellRate
maxBuyRate: 控制最大买入倍率。单次买入仓位比例最大不超过 defInvestRatio * maxBuyRate
maPeriod: 均线长度,默认使用1100日MA
smoothing: 均线平滑算法,默认使用SMA
useDateFilter: 回测时是否要指定日期范围
settleOnEnd: 如果useDateFilter==true,在结束日之后是否平仓所持有的仓位平仓
startDate: 如果useDateFilter==true,指定回测开始日期
endDate: 如果useDateFilter==true,指定回测结束日期
investDayofweek: 每次在周几定投,默认在每周一收盘
intervalDays: 每次定投之间的最小间隔天数,由于是按周计算,所以此数字必须是7或7的倍数
v1.2版本数据窗口指标说明(只列出重要指标):
MA:1100日SMA
RoR%: 当前仓位的浮动盈亏
maxLoss%: 仓位曾经的最大浮动亏损,注意此浮亏代表持仓仓位的浮亏情况,并不代表整体账户浮亏情况。例如当前仓位是1%,浮亏50%,整体账户浮亏是0.5%,但仓位浮亏是50%
maxGain%: 仓位曾经的最大浮动盈利,注意此浮盈代表持仓仓位的浮盈情况,并不代表整体账户浮盈情况。
positionPercent%: 仓位持仓占比
positionAvgPrice: 仓位平均持仓成本

3Commas Bot DCA Backtester & Signals FREEThis is a DCA Strategy backtester + signals, built to emulate the 3Commas DCA bots. It uses your choice of 4 different buy signals, 2 of which can be adjusted in the settings. Everything is customizable so you can backtest specific settings with different buy signals and find the best performing strategy for your risk tolerance and capital. It can be used to backtest strategies on stocks as well, but just make sure your base order is larger than the share price for the entire backtesting range or it will not calculate properly.
You can use this template to code your own buy signals and then backtest them as a DCA strategy if you know some basic pine script.
The indicator shows all of your backtesting orders on the chart. The red line is your take profit level, the blue line is your average price level, the white line is your first order and the green lines are your average down orders. If you enable a stop loss in the settings your stop loss will be shown as an orange line once all of your average down orders have been hit, it will not be set until price has dipped below your covered trading range.
These levels update when things change during backtesting so you can visualize your strategy and how it would perform as well as see if your percentage deviation is large enough to cover dips. When backtesting trades are taken, the chart will show where they were taken(in backtesting) along with info on those trades such as the number each order is, the size of that order and the percentage deviation that order is from the initial buy.
SENDING SIGNALS TO 3COMMAS
Tradingview cannot sync this backtester to 3Commas and with the way alerts are setup for strategies on Tradingview, the best option for you to give signals to your bot would be to use this backtester to figure out what trigger you want to use and then setup that indicator separately to send alerts to your bot. All of the indicators used for signals in this backtester are available for free and can be configured to match this backtester and send alerts to 3Commas for you. Just make sure you set your alerts to once per bar close and don’t use less than a 15 second timeframe because then you could trigger the Tradingview threshold for alerts and get your alerts shut off.
You can also use this backtester with your own buy triggers if you know a little pine script. Just make copy of the script and code in your own buy signals and see how it backtests.
INFO PANEL FOR ANALYZING YOUR STRATEGY
The right hand side of the screen will show an info panel that shows a lot of different information so you can quickly see your bot settings and how it performed right on the screen.
In the top right corner you will see in purple your bot settings. These include your stoploss % if turned on, take profit %, average down order %, average down order % multiplier, volume multiplier, max number of orders allowed and size of your base order.
The top section of the first column “Current Trade” shows these stats: the open trade’s average price, the open trade’s take profit price, the open trade’s PNL, how far price is from your open tarde’s take profit level in percentage, your open position size and number of open orders.
The bottom section of the first column “Overall Performance” shows these stats: total number of trades taken during backtesting range, the largest amount of trades that were open at one time during backtesting, the max drawdown, the average number of bars per trade, gross profit, net profit, percent profit from your initial capital, current portfolio value and your initial capital.
CUSTOMIZABLE OPTIONS TO FIND THE PERFECT STRATEGY
Stoploss On/Off
This will turn your stoploss on or off. By default it is set to off and will not affect anything unless turned on.
Stoploss Percentage
This is the percentage below your final average down order price that will be set as a stoploss to keep your account from going too far in the red on big dips.
Take Profit Percentage - This is the percentage of profit you want the trade to hit before taking profit on your entire DCA trade. This level updates everytime you average down.
Average Down Percentage - This is the percentage that price has to drop from your initial order to initiate your first safety order. If the Average Down Percent Multiplier is set to 1 then this percentage will be the same for every average down order.
Average Down Percentage Multiplier - This multiplies your Average Down Percentage so each safety order needs a larger percentage deviation than the previous one. This keeps your buys closer together at the beginning and further apart when you hit more orders so you can extend your trading range but still be aggressive when price is going sideways.
Volume Multiplier Per New Order - This multiplies the size of each trade based on your base order. If you set it to a 2x multiplier then each average down order will be 2 times the size of the last one. So for example, a $100 base order with a 2x multiplier would have these values for the first 3 average down orders: 200, 400, 800.
Size Of Base Order - This is the size of your first position entry and will be used as a starting point for the volume multiplier. If your base order is $100 then it will buy $100 worth of whatever crypto you are backtesting this on. If you are looking at stock charts, you need to make sure your base order is higher than the share price across the entire backtesting range or it will not perform correctly.
Max Number Of Orders - This is the maximum number of orders the bot can take, including your base order. Adjust this to suit the amount of capital you are willing to allocate to your bot based on how much money it will require to run according to your bot settings.
TIPS ON HOW TO USE FOR BEST RESULTS
If you don’t have a lot of capital to work with, then use longer timeframes with a reasonable take profit percentage so that you don’t need a lot of average down orders. You can also try keeping the volume multiplier close to 1.
You can use the 3Commas dca bot settings page to see how much capital you will need for your strategy if you match it to the settings you have on this indicator. You can also check to see how much of a percentage deviation your bot is covering to make sure you have a reasonable range to trade in and orders to cover big dips. You can also check your coverage by seeing how far down the chart the green lines cover, which are your average down orders.
Make sure the initial capital in the properties tab of the settings has enough to cover all of your orders otherwise you will get unrealistic backtesting results. Also, make sure you leave the order size in the properties tab on contracts so it calculates your trades correctly. The only settings you need to touch in the properties tab is the initial capital. Unless you are trading somewhere that has lower commission fees, then you can change that to match, but leave all the other settings as is for it to function properly.
Increasing the volume multiplier will make your average price and take profit target follow the price action a lot closer as price falls, but it can also lead to having very large orders very quickly once you get into the 1.5-3x multiple range. Try using a high volume multiplier with less safety orders and you will get better results, however you need to have money on the sidelines to add on major dips to keep your bot turning a profit. Be very careful with this as greed and impatience will hurt your overall performance. This bot is meant to make money with lots of small wins so don’t get greedy and make sure you have enough money to cover large dips. If you are being aggressive with your bot, then I recommend only using 25% or less of your portfolio to trade aggressively and then use the smart trade feature on 3commas to add chunks of funds to your trades when price dips below your last safety order. Or if you want it to run without any supervision, then use lower volume multipliers and have lots of safety orders that can cover entire bear markets and still keep buying lower.
It’s a good idea to have some capital on the sidelines that you can add in when price dips quickly. This will help lower your average price and allow your bot to get out in profit quicker. 3Commas bot has a smart trade feature that will allow you to track your average price when adding extra funds and it will automatically update your other orders which is very convenient. Look at the longer timeframes when price dips and only add chunks at major areas where price is very likely to bounce. Or you can be aggressive when trading and add to your position when price dips and is at a likely bounce zone to maximize profits.
Only trade coins that have a good amount of liquidity as the larger your orders get, the harder it will be to sell if there isn’t much liquidity. Also, beware of how large your first order is as it will usually be a market order and can move the market if there is not much liquidity.
Since this bot takes a lot of trades and performs best when taking small profits consistently, you will need to factor in exchange fees. The bot is set to .5% commission(you can change this) on the buy and sell orders as most exchanges charge that amount. Some exchanges offer no fee trading on certain coins so be sure to look around for those so you can keep the commissions and maximize profits.
I strongly encourage you to try out a lot of different setting combinations across multiple different coins and do it across a few months to see how it would have performed under various market conditions. This will help you get a better idea of how much of a percentage deviation you’ll need to be able to cover to keep your bot running and making constant profits. You can also use the deep backtesting feature of the strategy panel to see how it would have done, but just beware that the info panel of the indicator will not reflect deep backtesting results, only the normal backtesting range.
MARKETS
This backtester can be used on any market including crypto, stocks, forex & futures. You just need to make sure your base order is larger than the share price when using this on things besides crypto.
TIMEFRAMES
This backtester can be used on all timeframes.

DCA After Downtrend v2 (by BHD_Trade_Bot)The purpose of the strategy is to identify the end of a short-term downtrend . So that you can easily to DCA certain amount of money for each month.
ENTRY
The buy orders are placed on a monthly basis for assets at the end of a short-term downtrend:
- Each month condition: In 1-hour time frame, each month has 24 * 30 candles
- The end of short-term downtrend condition: use MACD for less delay
CLOSE
The sell orders are placed when:
- Is last bar
The strategy use $1000 and trading fee is 1.1% for each order.
Pro tip: The 1-hour time frame has the best results on average:
- Total spent: $1000 x 33 = $33,000
- Total profit: $65,578

DCA After Downtrend (by BHD_Trade_Bot)The purpose of the strategy is to identify the end of a short-term downtrend . So that you can easily to DCA certain amount of money for each month.
ENTRY
The buy orders are placed on a monthly basis for assets at the end of a short-term downtrend:
- Each month condition: In 1-hour time frame, each month has 240 candles
- The end of short-term downtrend condition: use MACD for less delay
CLOSE
The sell orders are placed when:
- Is last bar
The strategy use $1000 and trading fee is 0.1% for each order.
Pro tip: The 1-hour time frame for TSLA has the best results on average:
- Total spent: $1000 x 85 = $85,000
- Total profit: $790,556

3C QFL Mean reversalWhat is QFL trading strategy?
QFL stands for Quickfingersluc, and sometimes it is referred to as the Base Strategy or Mean Reversals. Its main idea is about identifying the moment of panic selling and buying below the base level and utilizing Safety orders.
What is Base level or Support Level?
Base level or Support Level refers to the lowest price level that was reached before the moment the price started increasing again. At that level, you can notice that buyers of some cryptocurrencies make a strong reaction.
In this strategy we can also reverse the strategy and go short. But i must warn you that that is alot riskier.
QFL is meant to be used on higher TF's like 1hr, 2hr and 4hr. But this strategy also work well on lower Timeframes.
The script also simulates DCA strategy with parameters used in 3commas DCA bots for futures trading.
Experiment with parameters to find your trading setup.
Beware how large your total leveraged position is and how far can market go before you get liquidated!
Do that with the help of futures liquidation calculators you can find online!
Included:
An internal average price and profit calculating, instead of TV`s native one, which is subject to severe slippage.
A graphic interface, so levels are clearly visible and back-test analyzing made easier.
Long & Short direction of the strategy.
Table display a summary of past trades
Vertical colored lines appear when the new maximum deviation from the original price has
been reached
All the trading happens with total account capital, and all order sizes inputs are expressed in percent.

Buy and hold strategyA simple buy and hold strategy. A short or a long position can be chosen. The start date will determine the date where your position will start and end date is the date it will end. This works well as a baseline to your other existing strategies since buy and hold is just the simplest strategy available.

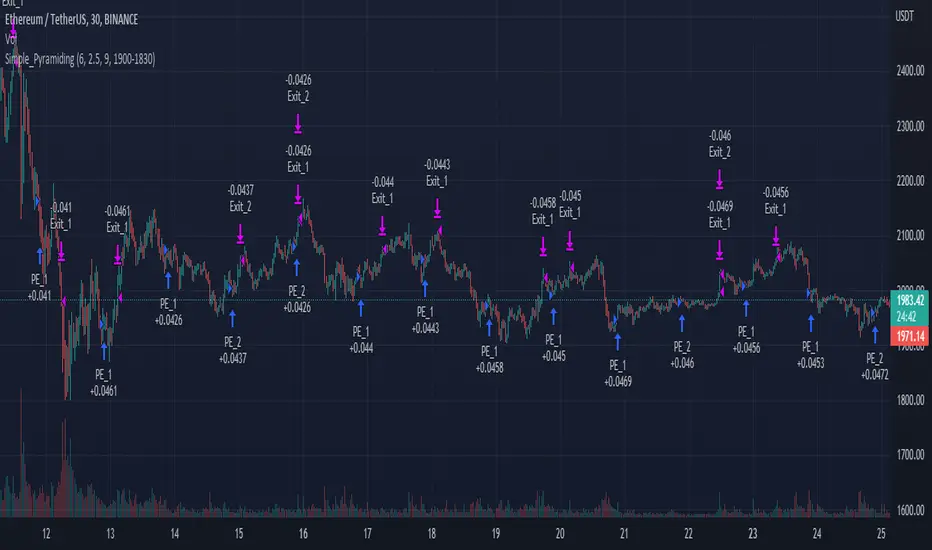
Simple_PyramidingA simple Pyramiding / DCA Strategy. Everyday at a specified time a position is opened. The individual position is closed when a take profit is triggered. Optionally a stop loss can be activated, or the option to close the position at the and of the time frame. You can specify the max amount of open positions. The equity will be divided through the max amount of open positions.
This strategy is a result of an exploration into working with time sessions, pyramiding, for loops and possibilities to trigger individual take profits (profit) and stop loss levels (stop). This strategy is by no means a worked out and reliable strategy. Please feel free to experiment with the code in your indicators and strategies.
Co-relation and St-deviation Strategy - BNB/USDT 15minThis indicator based on statistical analysis. it uses standard deviation and its co-relation to price action to generate signals. and following indicators has been used to calculate standard deviation and its co-relation values. finally it is capable to identify market changes in bottoms to pic most suitable points.
1. Parabolic SAR (parabolic stop and reverse)
2. Supertrend
3. Relative strength index (RSI)
4. Money flow index (MFI)
5. Balance of Power
6. Chande Momentum Oscillator
7. Center of Gravity (COG)
8. Directional Movement Index (DMI)
9. Stochastic
10. Symmetrically weighted moving average with fixed length
11. True strength index (TSI)
12. Williams %R
13. Accumulation/distribution index
14. Intraday Intensity Index
15. Negative Volume Index
16. Positive Volume Index
17. On Balance Volume
18. Price-Volume Trend
19. True range
20. Volume-weighted average price
21. Williams Accumulation/Distribution
22. Williams Variable Accumulation/Distribution
23. Simple Moving Average
24. Exponential Moving Average
25. CCI (commodity channel index)
26. Chop Zone
27. Ease of Movement
28. Detrended Price Oscillator
29. Advance Decline Line
30. Bull Bear Power

Same high/low + DCA (only long)This is an update of the previous "same high/low" strategy. This strategy can be helpful for those who look for entrance price points after level retest based on the dollar cost averaging approach.
The retest of the level is defined by two candles with the same low.
4 entrance points were calculated based on volatility (not based on ATR though) and the weights were averaged in the middle of the volatility level.
As previously, stop loss is just one tick away from a level of support and take profit based on the ATR multiplier.

3RSI 3CCI BB 5orders DCA strategy+This strategy is just an attempt to find the indicator values for the trading bot service that I use (link in profile). Due to the use of the “request.security” function in the code, the indicators can be redrawn, but this is not important in history. The strategy used only 5 orders for the "DCA" - bot, located at the same distance in the price overlap range. I only use this strategy when trading in pairs against bitcoin.
Эта стратегия – просто попытка подобрать значения индикаторов для сервиса торговых ботов, который я использую (ссылка в профиле). Из-за использования в коде функции «request.security» возможна перерисовка индикаторов, но на истории это не важно. В стратегии использовано всего 5 ордеров для «DCA» - бота, находящихся на одинаковом расстоянии в диапазоне перекрытия цены. Я использую данную стратегию только при торговле в парах к биткоину.
