Directional Movement Index (DMI)


[RS]Volume Rsidmi This indicator has the following:
1. volume rsi based on Ricardo Santos great work
2.DMI
3.fib candle
the buy points are based on volume break of rsi (not rsi) filter by DMI and the candle fib based on fibo points
sell point the same just in reverse
this indicator give you volume based on rsi to gether with other stuff so the buy points seems to be more accurate and it not repainting.
I hope you will like it

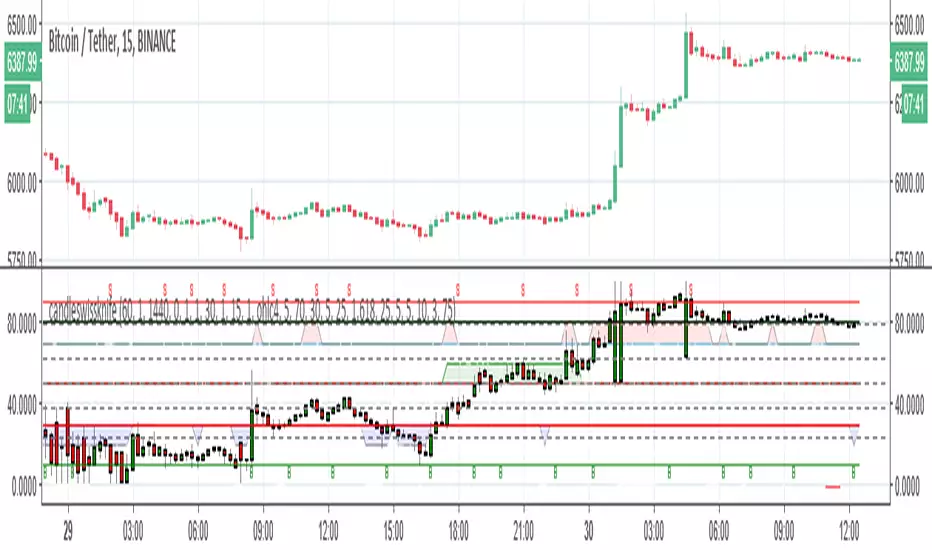
candleswissknifethere are two system to buy and sell in this indicator
system 1 is based on long ema and short ema with heiken candle and macd filter (green=buy and red=sell) line bellow the candles)
system 2 is based on fib candle and fast rsi and fast adx crossing (blue=buy line and gray=sell line bellow candle)
B and S are points of stoch rsi crossing
inside there are points of divergence based on ATR and rsi
swissknife system all in oneSO how this system work
1. B and S top and button are stoch cross points
2.the area highlighted in blue and red are zone where RSI DMI and ATR are in agreement
3. The candles are based on fibonaci so if the candle are below 10 is low fib and if above 90 its high fib
so how to find best buy points
1. search for B points the fall in blue area =RSI low and D- high
2.sell points =s that fall in red area =high rsi + D+ high
3. the candle based on fib so it easy to see if the points potential buy and sell fall in high or low fib
4. potential buy and sell points can also be found on base of cross of D- and D+ adding adx make it easy
in this version no alert but in next version I try to put something on it :)

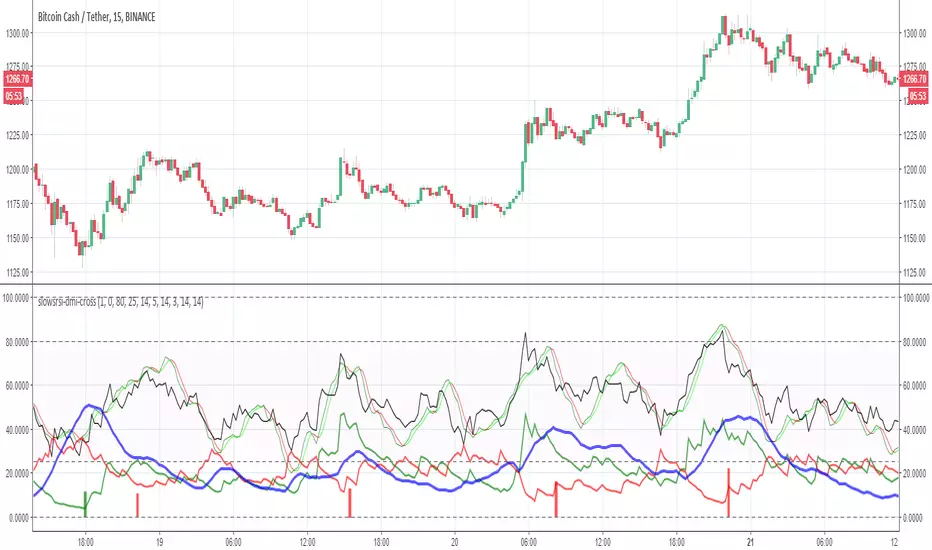
slowsrsi-dmi-crossThis model is based on buy and sell points according to rsi +DMI and the cross up of slow stoch
dmi-srsi-candle v1very similar to previous version only here instead of using rsi dmi system , I use only dmi srsi cross up as seen as green and red trinangular on top or buttom. fib candles are the same no modification best buy if candles bellow 10 and sell if candles above 90

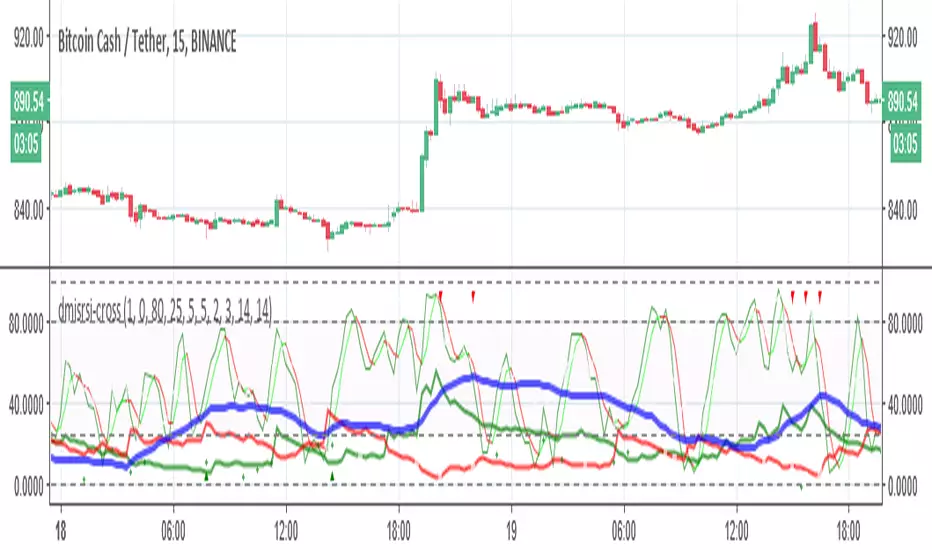
dmi-srsi-crossthis indicator show you the best buy points and sell points on a combination of DMI and SRSI cross up or down represented in green or red triangular dots
dmi-srsi-candleThe indicator has 3 part
1. buy sell pints based on rsi and stoch and DMI = green red trinagukar
2. crossing up of srsi =green cross points
3. fibonaci candels= below 10 best buy ,above 90 =best sell according to candles

DMI-RSI-candlesthis system is based on RSI+DMI and special candle based on fibonacci levels, best buy poiny is RSI + indicated in green triangle, DMI above 30 (red line) and low fib level ( bellow 30 better bellow 10) ..have fun

Geek's DMINot an upgrade as much as a tweek.
DMI+/- are slightly smoother.
ADX was modified to be a field that is negative or positive, the value of which was multiplied to be highly visible.
Hope you like it.

Millenium Falcon BOT SETUP ALTCOINSA new script I am currently using for autoview. Based on Directional Movement Index.
I will grant access to people willing to make a small donation.
Here is my BTC 2.27% address : 19sVQvCDmVfEACq7BiMnWSMqFPZ8qfSQ2K
If you prefer ETH : 0xc8a5d3a63a05db0c2363ea1c08b37a01cce9ebfb
Send me a Private Message with the ID of the transaction
If you want to do some forward testing first, send me a message.
This script comes with an Alert Setup.
I am also taking commissions if you want me to code something for you, or do some reverse engineering.
Also you can ask me anything in the comments.
Thanks and see you next time !
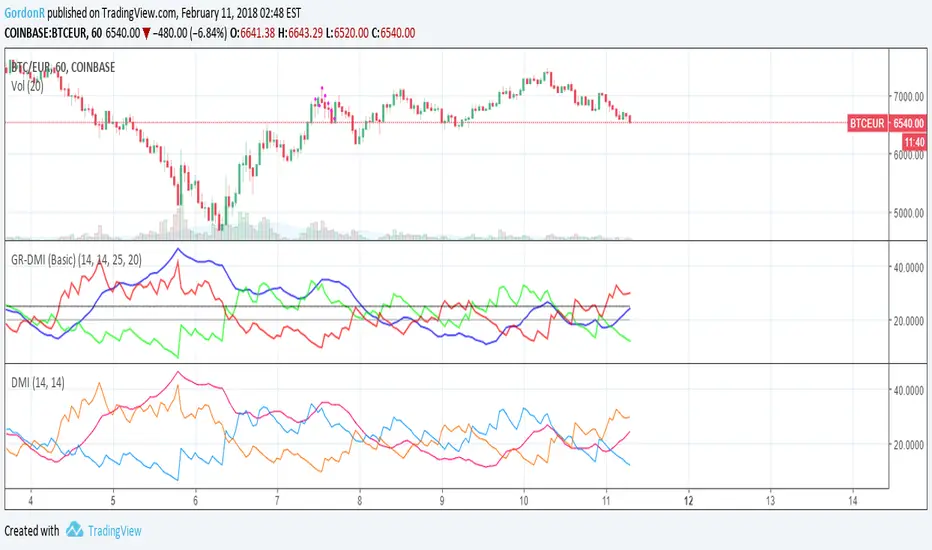
GR-DMI (Directional Movement Indicator with better colours)Standard DMI indicator, but with easier to understand colours and threshold lines.
I found myself constantly changing the colours every time I added the DMI indicator to a chart, so this indicator should fix that issue.
Green = Plus Directional Indicator ( +DI )
Red = Minus Directional Indicator ( -DI )
Blue = Average Directional Index ( ADX )
Comments and suggestions are most welcome.
I'm available for hire, to create custom indicators or to work on more complex software projects.
From (www.investopedia.com):
The directional movement index, or DMI, is a momentum indicator use to determine the existence of a trend and trend strength, and it can be utilized in forex trading as well as in stock or futures trading. It may even prove a more useful indicator in forex trading, as momentum indicators are popular with forex traders. The DMI calculates a moving average of range expansion over a given time period and is shown by two lines: the positive directional movement indicator, or +DMI , and the negative directional movement indicator, or -DMI .
The two DMI lines show the respective strengths of buying and selling pressure in a market. As with the popular Average Directional Index , or ADX , indicator, the use of both lines provides traders with the ability to assess buying and selling strength, indicating which is stronger, and also giving a relative indication of the amount of strength contained in a price movement by means of a scale going from zero to 100. A strong trend is revealed by a reading above 25 that occurs following one of the DMI lines crossing over above the other.
In a forex trading strategy, traders might make use of the DMI as a supporting, or confirming, indicator combined with a strategy primarily focused on price action and moving averages. It could also be used along with another momentum or range indicator to provide additional confirmation and help in choosing a good trade entry point. Once a trader's overall analysis suggests taking a position in a market, a possible trade entry point is provided when there is a crossover of the DMI lines or when, as mentioned above, the establishment of a firm trend is indicated by a DMI reading over 25.
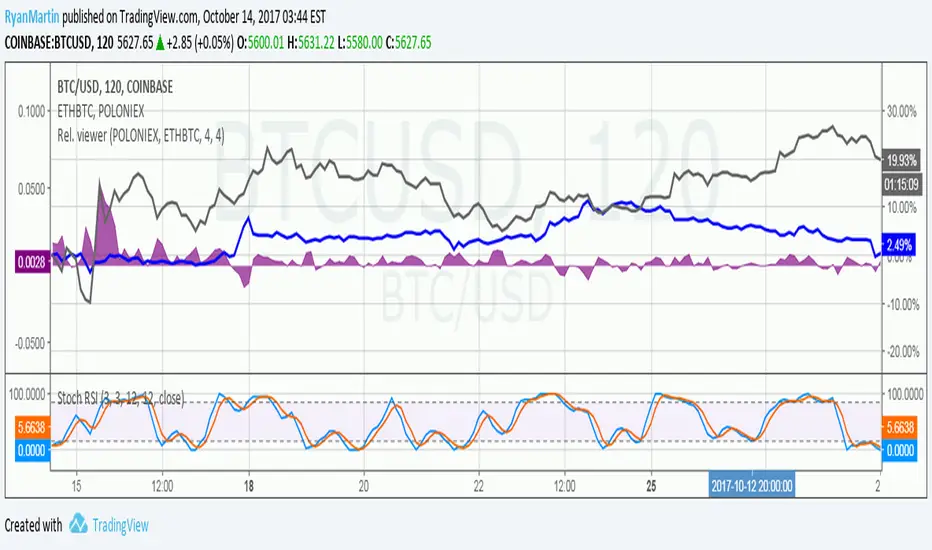
Price relation viewer - add percent change of two symbols (BETA)This script is very much beta!
This is a simple script to visualize how two symbols move in relation to each other. For example if the underlying symbol is a 2x Gold ETF (meaning the ticker moves at 2x the spot price of gold---if gold goes up 3% this ticker should go up 6%) and the comparison symbol is an 2x inverse gold ETF (at gold up 3% this should move down 6%). If these ETFs were 100% accurate at tracking the price of gold then this tool would report a value of zero at all times.
Day 1
Ticker - $10
Comparison - $10
Day 2
Ticker - $12
Comp - $11
This tool value - |20%| + -|10%| = 10%
It uses a short simple moving average to smooth things out a bit (see inputs). It is important to keep your axis scale in mind when using this! Two symbols that are always near zero mean they are offsetting each other very well but the value displayed might range from 0 to 0.005, but the graphed area can make it look extreme if autoscaled.
This is a tool with very specific uses : comparing how one digital currency moves in relation to bitcoin's price, comparing how gold moves in relation to silver, etc.
[INDICATOR]Renko Emulator OCC v1 by JustUncleLThis "Study" project has been created by request and is used in conjunction with the "Strategy" version.
*** EXPERIMENTAL ***
*** USE AT YOUR OWN RISK ***
Description:
Indicator based around Renko Bar Chart emulator (ATR) with direction change used to signal buy/sell trades.
I have generally found that setting the strategy ATR resolution to 3-5x that of the chart you are viewing tends to yield the good results, regardless of which chart time used. Positions get taken automatically following THE Renko Bar after a crossover.

Directional Movement Index 4 colors (DMI 4c)It is a normal Directional Movement Index, but instead of using lines for +DI and -DI it uses histogram and 4 colors. It also contains an horizontal line (default value @20) to indicate when a trend is confirmed or not.

Kay_BBandsV3This is the 3rd version of Kay_BBands.
When +DI (Directional Index ) is above -DI , then Upper band will be visible and vice-versa.
This is when the ADX is above the threshold. 28 is the default in this version. I found its more appealing in 5M time frame.
BLUE - ADX under 10
GREEN - Uptrend, ADX over 10
RED - Downtrend, ADX over 10
Use it with another band with setting 20, 0.6 deviation. Prices keeping above or below the 2nd bands upper or lower bounds shows trending conditions.
I didn't know how to update the old script so published it again.
Changes - :
1) Updated default settings for the indicator
2) ADX setting are now DI (28), ADX (10), adx level to check is 10.
3) IMPORTANT one - When DI is up/down, lower/upper band will also have color (more visible that way.)
Play around the settings.. It really eliminates extra indicator checking visually... Please like if you think idea is good.

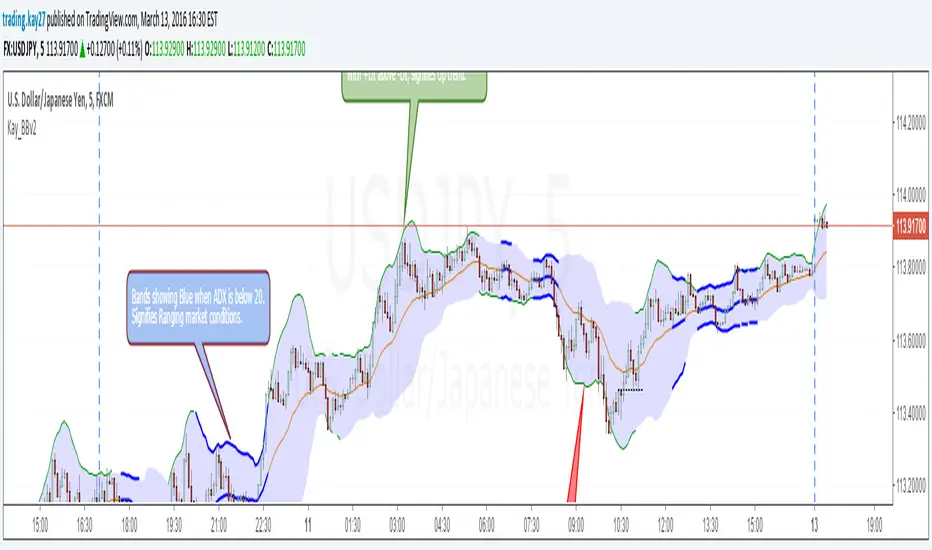
Kay_BBands v2This is the second version of Kay_BBands. But this is infused with ADX.
When +DI (Directional Index) is above -DI, then Upper band will be visible and vice-versa.
This is when the ADX is above the threshold. 20 is the default but can be set to 25.
When the ADX is below the specified threshold, both bands gets visible, showing no trending conditions.
Use it with another band with setting 20/21, 0.6 deviation. Prices keeping above or below the 2nd bands upper or lower bounds shows trending conditions.
Directional Movement Index + ADX & Keylevel SupportADX and DMI oscillator with the keylevel coded in to the script, set for 23, suggested settings is 23 - 25 any trade with the ADX above the keylevel is a strong indicator that it is trending.

Directional Movement (DMI)Directional Movement indicator implemented in Pine script. Use it to customize ADX behavior.

TheLark: Directional Movement Index StochasticThere is a nice writeup about a system that uses DMISTO here, which includes decent statistics:
traderedge.net
I have not yet done any back testing on the system as a whole myself, but thought the DMISTO was an interesting indicator, so ported it over for those who might want to play with it and create their own systems. I added dots that denote signals similar to the system described above, which can be turned off if desired.
