Bagheri IG Ether v2In this version, the winning ratio has been decreased, but the Risk to Reward Ratio (RRR) has been set to be better than the previous version.
This is a technical trading strategy for Ethereum ( BINANCE:ETHUSDT ). We built and developed it on MetaEditor and optimized it with MetaTrader optimizer.
The main indicators are Donchian Channel, Oscillator of ROC , Bears Power, Balance of Power , and Simple Moving Average ( SMA ). Default values in the input panel are the best combination of these indicators, but you can change any of them and try it for better results.
Please notice that this strategy has been optimized on the 1-minute chart of Ethereum .
For each position, you can see the Take Profit (TP) and Stop Loss (SL) levels. Also, you can find the values of mentioned TP and SL in points from the input panel of the script.
Attention: The price of Ethereum has 2 decimal places.
Therefore, 3000 points for TP means 30 USDT for trading 1 BINANCE:ETHUSDT .
Donchian Channels (DC)

Keltner Center Of Gravity Channel ( KeltCOG )I have the ambition to create a ‘landscape’ which enables the user to see the ‘mood’ of the market about the price of an instrument, simply by looking where the candles go. Prices are a simple phenomenon , they go up or down or stay the same. This is represented quite well for the short term by a candle. I recommend to study candle patterns. Prices not only fluctuate but also trend up, down or go sideways. The user should analyze this by determining the COG (Center Of Gravity) and the ‘normal’ current range by using the historical data in a lookback period.
As a COG the center line of a Donchian Channel is often used. I.m.o. a COG should be a zone, in this channel I use the gray zone of my Donchian Fibonacci Channel, The ‘normal’ range is a multiple of Average True Range, as used in a Keltner Channel. Combining the two can give a cumbersome result, as one can see in my Keltner Fibonacci Channel. In this KeltCOG channel I solved this by not using all Fibonacci levels and by making the Keltner lines strictly parallel to the nearest COG line. To do this, I use the fact that the COG lines have horizontal stretches, there I make the Keltner lines horizontal too. Only where the COG lines change value, the Keltner lines are recalculated. This way the channel gets a very regular shape with three clear zones.
Interpretation of a chart by using the KeltCOG channel.
Overbought: If the candles go higher then the blue zone, the market is hyper enthusiast, creating an overbought situation. This is often followed by a reversion to the COG.
Uptrend: If the candles form in the blue zone, the market is enthusiast and willing to pay more.
Hopeful: If the candles form in or near the upper uncolored zone, the market is hopeful and is thinking about paying more. Sometimes prices go a little up.
Content: If the candles form in the gray zone, which represents COG, the market is happy with the current prices, so these move sideways
Disappointed: If the candles form in or near the lower uncolored zone, the market is disappointed and contemplates paying less, sometimes prices go a little down.
Downtrend: If the candles form in red zone, the market doesn’t like the instrument at all, rejects the current price and is only prepared to pay less.
Oversold: If the candles form below the red zone, the market overdoes its disgust, creating an oversold situation, often followed by a reversion to the COG.

Strategy Template - V2This is an educational script created to demonstrate few basic building blocks of a trend based strategy and how to achieve different entry and exit types. My initial intention was to create a comprehensive strategy template which covers all the aspects of strategy. But, ended up creating fully fledged strategy based on trend following.
This is an enhancement on Strategy-Template But this script is comparitively more complex. Hence I decided to create new version instead of updating the existing one.
Lets dive deep.
SIMPLE COMPONENTS OF TREND FOLLOWING STRATEGY
TREND BIAS - This defines the direction of trend. Idea is not to trade against the trend direction. If the bias is bullish, look for long opportunities and if bias is bearish, look for short opportunities. Stay out of the market when the bias is neutral.
Often, trend bias is determined based on longer timeframe conditions. Example - 200 Moving Average, Higher timeframe moving averages, Higher timeframe high-lows etc. can be used for determining the trend bias.
In this script, I am using Weekly donchian channels combined with daily donchian channels to define trend bias.
Long Bias - 40 Day donchian channel sits completely in upper portion of 40 Week dochnial channel.
Short Bias - 40 Day donchian channel sits completely in lower portion of 40 Week donchian channel.
ENTRY CONDITION - Entry signals are generated only in the direction of bias. Hence, when in LongBias, we only get Long signals and when in short bias, we only get short signals.
In our case, when in Long Bias - if price hits 40 day high for the first time, this creates our long entry signal. Similarly when in Short Bias , price hitting 40 day low will create signal for going short. Since we do not take trades opposite to trend, no entry conditions are formed when price hits 40 day high in Short Bias or 40 day low in Long Bias.
EXIT CONDITION - Exit conditions are formed when we get signals of trend failure.
In our case, when in long trade, price hitting 40 day low creates exit signal. Similarly when in short trade price hitting 40 day high creates exit signal for short trade.
DIFFERENT TYPES OF ENTRY AND EXIT
In this script, I have tried to demonstrate different entry and exit types.
Entry types
Market - Enter immediately when entry signal is received. That is, in this case when price crossover over high in long bias and crosses under low in short bias
Stop - This method includes estimating at what level new highs are made and creating a stop buy order at that level. This way, we do not miss if the break out is stronger. But, susciptible to fail during fakeouts.
Limit - This method includes executing a limit order to buy at lower price or sell at higher price. In trend following methods, downside of limit order is when there is genuine breakout, these limit orders may not hit and during trend failures the limit orders are likely to hit and go straight to stop.
Stop-Limit - this is same as stop order but will also place a limit condition to avoid buying on overextended breakout or with lots of slippage.
Exit types
Market - whether to keep the existing trade running or whether to close it is determined after close of each bar and exit orders are executed manually upon receiving exit signal.
Stop - We place stop loss orders beforehand when there is a trade in place. This can help in avoiding big movements against trade within bar. But, this may also stop on false signals or fakeouts.
Take profit
Stop - No take profits are configured.
Target - 30% of the positions are closed when take profit levels are hit. Take profit levels are defined by risk reward.
USING THE CODE AS TEMPLATE
As mentioned earlier, I intended to create a fully fledged strategy template. But, ended up creating a fully fledged stratgy. However, you can take some part of this code and use it to start your own strategy. Will explain what all things can be adopted without worrying about the strategy implementation within
Strategy definition : This can be copied as is and just change the title of strategy. This defines some of the commonly used parameters of strategy which can help with close to realistic backtesting results for your coded strategy and comparison with buy and hold.
Generic Strategy Parameters : The parameter which defines controlling alllowed trade direction and trading window are present here. This again can be copied as is and variable inDateRange can be directly used in entry conditions.
Generic Methods : f_getMovingAverage and f_secureSecurity are handy and can be used as is. atr method provideded by pine gives you ATR based on RMA. If you want SMA or any other moving average based ATR, you can use the method f_getCustomAtr
Trade Statements : This section has all types of trading instructions which includes market/stop/limit/stop-limit type of entries and exits and take profit statements. You can adopt the type of entry you are interested in and change when condition to suit your strategy.
Trade conditions and levels : This section is required. But, cannot be copied. All the trade logic goes here which also sets parameters which are used in when of Trade Statements.
Hope this helps.

Bagheri IG EtherThis is a technical trading strategy for Ethereum ( BINANCE:ETHUSDT ). We built and developed it on MetaEditor and optimized it with MetaTrader optimizer.
The main indicators are Donchian Channel, Oscillator of ROC, Bears Power, Balance of Power, and Simple Moving Average (SMA). Default values in the input panel are the best combination of these indicators, but you can change any of them and try it for better results.
Please notice that this strategy has been optimized on the 1-minute chart of Ethereum.
For each position, you can see the Take Profit (TP) and Stop Loss (SL) levels. Also, you can find the values of mentioned TP and SL in points from the input panel of the script.
Attention: The price of Ethereum has 2 decimal places.
Therefore, 3000 points for TP means 30 USDT for trading 1 BINANCE:ETHUSDT .

Current to BTC [Morty]This indicator helps you find strong bull altcoin, it shows the ratio of the current symbol to BTC.
Donchian Channels help to identify trends.
Alts Bull coins:
When BTC goes sideway, they pump first.
Alts Bear coins:
When BTC goes sideway, they move sideway.
When BTC goes down, they go down harder.

Donchian Channels strategy with backtestHere's another trading strategy for you. This one is based on the standard Donchian Channels.
This one will - by default - wait for 2 consecutive higher highs (or lower lows) before taking a position. This can be disabled so the script will take a new trade without waiting for the 2nd high or low.
This is useful to avoid getting into a trade when market makers are aiming for a swing-failure pattern (= taking out stop/losses below the last low or above the last high)
For people who don't like to short, there's also the option to exclude shorts.
Enjoy!
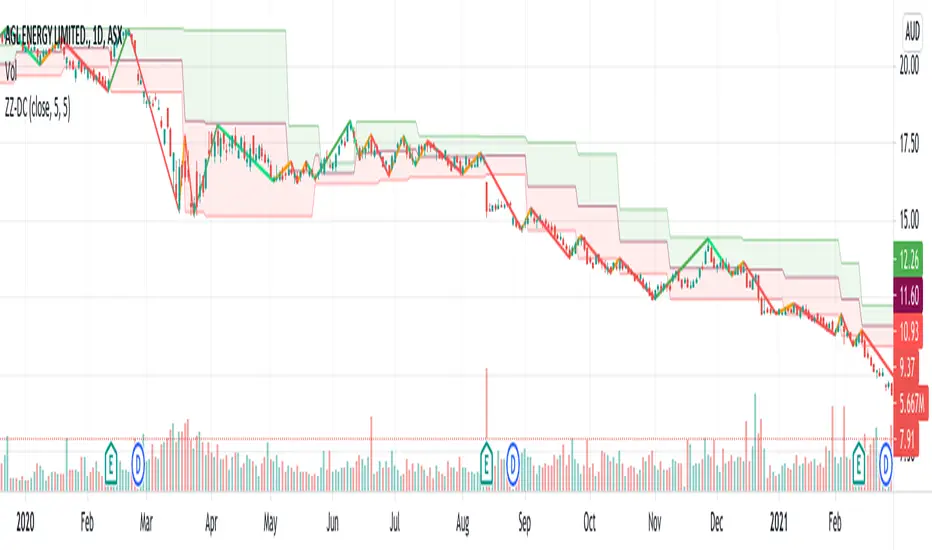
ZigZag ChannelThis is recreation of Donchian Channel - Pivot High Low indicator present here:
But, instead of traditional pivot high lows, this is based on pivots created from zigzag indicator.
This indicator is created on top of existing Zigzag indicator using lines array:
Parameter HighLowLength refers to number of zigzag lines back which can be used to calculate top and bottom of donchian channel.
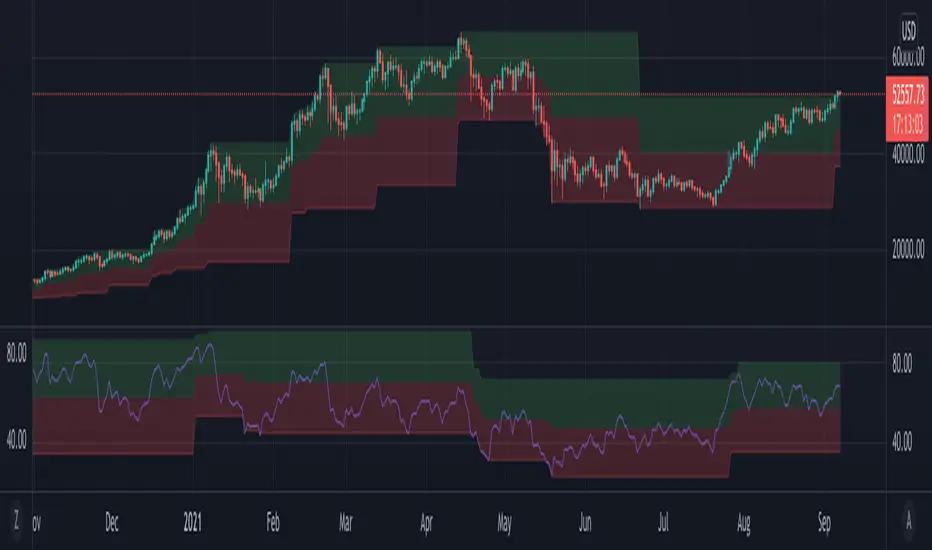
RSI+ChannelbandsThis Indicator displays a normal RSI with overbought/-sold lines which is calculated with donchian channels, pivot channel, bollinger bands and three horizontal lines.
You can averaged the channels, bands and h-lines in any combination or you can use just one of them for calculating the overbought/-sold lines.
The midline is colored in default settings in yellow for upptrending and blue for downtrending.

Adaptive Donchian ChannelThis is Slight modified version of Donchian channel. Only change here is, channels update only when there is breakout. If price keeps ranging within channel, it will not contract based on new highest and lowest range.
This can be used for identifying powerful breakouts post long consolidation and filter out fakeouts.
Value RangeHere is another attempt to chase value based on technical analysis.
This is extended version of PE range script published earlier.
Instead of just PE, this script contains several other factors which defines value. You can chose which factor to look at from input dialog:
Possible value factors included in this script are:
Price to Earnings
Price to Sales
Price to Book
PE - Forwarding
PS - Forwarding
Price to Cashflow
Enterprise Value to EBITDA
Enterprise Value to Cashflow
Some of these can be added to chart directly from financials. But, the script also calculate range based on donchian channel or bollinger bands. Instead of short periods, we are looking for periods in terms of years. Rest of things remain same.

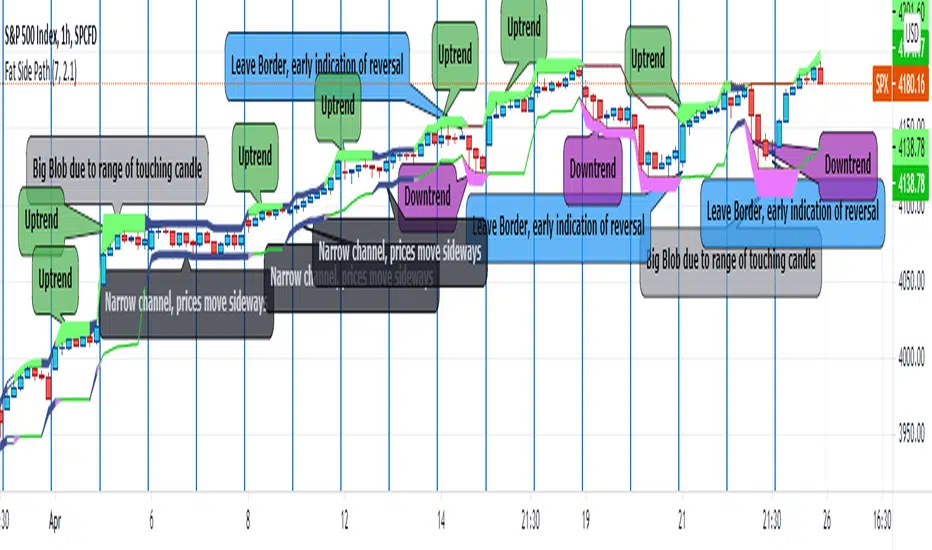
Fat Side PathI got the idea for a narrow Donchian Channel with a short lookback period which closely follows the price fluctuation in which the sides of the channel have a thickness according to the range of the last touching candle.
Any channel, be it Donchian, Keltner, Bollinger Bands or Parallel, has an upside and a downside, touching the upside is a buy signal as this may initiate an uptrend, the downside a sell signal because a down trend may come.
This gave me the idea to make only the last touched side fat, thus creating visible switching between uptrend and downtrend. However this is ‘too digital’, as in practice also periods of no trend occur in which signaling a trend would give a false signal. In a Donchian channel (and also Bollinger Bands) such periods are marked by narrowing the channel. So I gave a no trend signal to the sides when the channel is narrower than a minimum width to call a trend. I gave the thing nice colours and proper default settings.
Use of the channel in trading.
I think this thing can be useful for swing trading. In channels two typical things may happen that should be noted by the trader, these are LB, Leaving the Border, which signals a trend reversal and FTT, Failure To Traverse, i.e. the price doesn’t manage to cross the channel to the other side. This affirms the trend. FTT’s are not expected in short lookback channels like this path (Sidenote: Fibonacci levels can be regarded as predictions where FTT’s may occur). The fat side indicates direction. Because somehow trends seem to end with a notable range extension, this channel sometimes produces a “Big Blob” where the trend reverses.
I intend to use this thing together with my Keltner Fibzones channel, where the zones serve as a ‘landscape’ in which the Fat Side Path meanders providing ‘comments’ on the short term price movements.
Donchian Channel - trend filterStrategy based on Donchian Trend filter indicator:
Which in turn is derived from custom Donchian Channel indicator:
Few extra paremters added:
EntryType
Breakout : Entry on first confirmation of trend.
Pullback : After confirmation of trend, wait till price comes back to mid band before entry.
Combined : Prefer pullback entry. But, if price breaks higher band more often, then go long on breakout. Parameter EntryBreakoutStrength + TrendCountLimit is used for measuring repeated breakout and possibility of not getting pullback signal.
ExitType
Reversal : Exit upon complete trend reversal
Choppy : Exit when trend becomes neutral and candles are colored in silver
Midband : Exit when price hits midband. Please note, this option should not be used in conjunction with EntryType - Pullback or Combined
Combined : Uses UpCount / DownCount along with ExitMidBandRange and ExitChoppyRange values to determine where to exit. High UpCount or DownCount means, instrument has trended for long - in this case early exit is favourable. If TrendCount is higher than ExitMidBandRange, then exit upon touching MidBand. If TrendCount is higher than ExitChoppyRange, then exit when trend becomes choppy. If not, wait till reversal.

Donchian Channel - trend filterTrend filter created based on donchian channel. I am using my custom donchian channel as base for this indicator:
Concept is simple.
We count how many times price is hitting donchian channel top or bottom without hitting the other side and keep counter for both. Thus:
upCount is the number of times price hits donchian channel top without hitting bottom
downCount is the number of times price hits donchian channel bottom without hittin top
trendCountLimit is the minimum value of upCount or downCount to call it uptrend or downtrend.

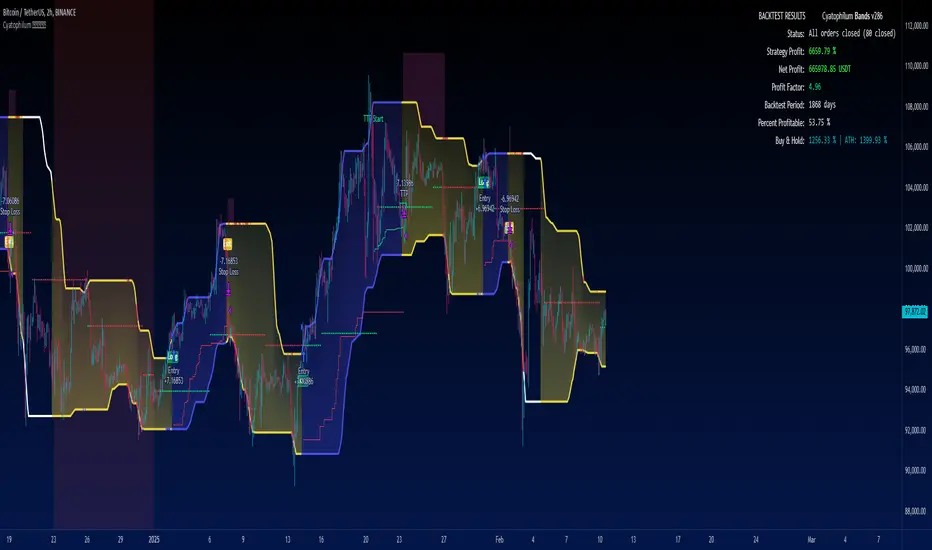
Cyatophilum Bands Definitive Edition█ OVERVIEW
A Swing Trade indicator providing backtest and alerts which can be used as a long, short or reversal strategy.
Its main goal is to catch breakouts and huge moves, and to try and beat the Buy & Hold Return.
█ CONCEPTS
The strategy consists of a unique custom indicator that works like this:
A Smoothed Donchian Channel combined with a consolidation check will trigger an entry.
The entry is then guided by a faster channel used as a trailing stop.
█ HOW TO USE
The most effective way to use this indicator is on high timeframes, from 2H to 1D.
The recommended pairs are trending pairs with consolidation areas. Yes, I'm especially looking at crypto.
The first appproach would be to catch long and short breakouts, and ride the trend using the trailing stop.
Adjust the Bands wisely to trigger entries at the right time.
The second approach is to go longs only, and try to beat the Buy & Hold return.
For this, click "Go long" and use an order size of 100% equity. Then adjust the Bands, trailing stop and chart timeframe.
The Buy & Hold comparator will come handy when backtesting.
█ INDICATOR SETTINGS
Strategy Direction
Choose wether to go long only, short only or both directions.
Bands Configuration
The bands lookback, smoothing and consolidation % are used to change the behavior of the bands. More info in the settings tooltips.
Trailing Stop
The "speed" of the trailing stop can be configured, allowing more or less room for the price to move before exiting.
Volume Condition
In addition to the consolidation condition, you can add a volume check to your entry. Is the volume rising or not? Useful in most scenarios.
Exit Alert Type
If you want to receive alerts during bars or prefer to ignore wicks.
Backtest Settings
This is where you choose the backtest period which is also used to calculate the B&H return.
Graphics
The configuration panel with all the indicator settings backtest info.
The buy & Hold Comparator is an additional panel that turns green when the strategy's return is greater than the Buy & Hold return.
Note: The Strategy Return is the strategy netprofit + the strategy openprofit.
█ ALERTS
Configure your alert messages for all events in the indicator settings.
Then click "Add Alert". In the popup window, select the option "alert() function calls only", give the alert a name and you are good to go!
█ BACKTEST RESULTS
The backtest settings used in this snapshot are the following:
Initial Capital: 10 000$
Order size: 100% equity (It indeed compounds and this is intended since the main goal of the strategy is to compare to Buy & Hold return)
Commission: 0.1%
Slippage : 10 ticks
The Indicator settings used for this are shown in the main chart above.
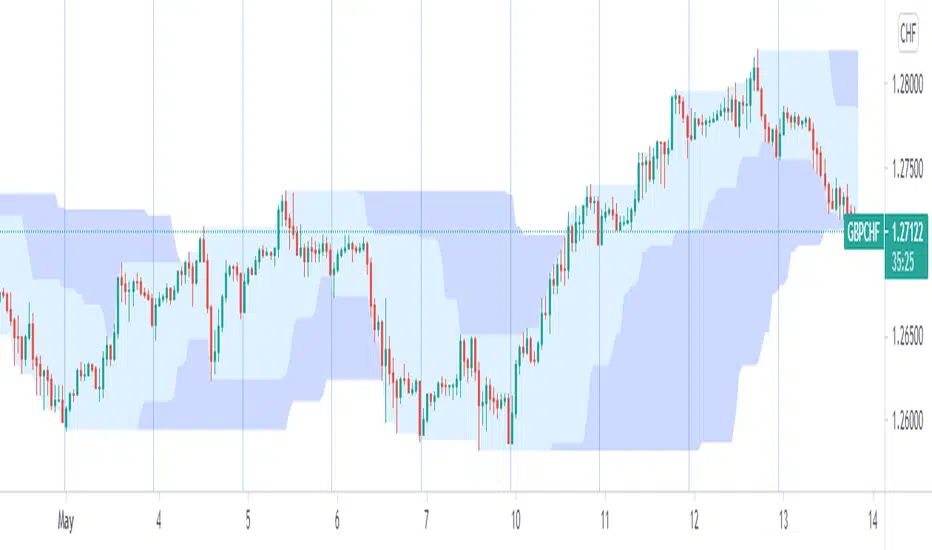
donchain support&resistance levels [LM]Hello Traders,
I would like to introduce you donchain support&resistance levels. The idea is to look for important levels that are identified by donchain line, where donchain usualy spents a lot of time without any move usualy turns out to be good level for bounces.
Also note that when there is a big spread between first line and second line it usually leads to some pullback.
Here you have an example of big spread:
You are also able to show donchain lines and not only horizontals this you can find in settings:
Enjoy!

Fixed price Stop Loss [Takazudo]This strategy is a demo for fixed price stop loss.
This strategy enables you to specify fixed price stop loss. Let's say your deposit is USD. When you trade EURCAD, you need to specify the quantity for trade. Here comes three chances for trade.
A: SL pips: 500
B: SL pips: 200
C: SL pips: 100
In these trade, the risk is different for each. ABC risk ratio is 5:2:1. And, you cannot know how much to lose if the price hits the stop loss. This is a huge problem.
With this strategy, You can specify the fixed risk price for each trade. If you specify 100 USD for the risk, this strategy calculates how much quantity to buy or sell for each entry. In the case above, this strategy guides you how much quantity to buy or sell like below.
A: 2,000 qty (SL: 500pips)
B: 5,000 qty (SL: 200pips)
C: 10,000 qty (SL: 100pips)
If you make entries with those quantity and the price hits the stop loss, You will lose the money like below.
A: 100 USD
B: 100 USD
C: 100 USD
This is what this script does. Fixed price SL.
I tested this caliculation for OANDA's main 28 currency pairs forex listed below.
AUDUSD, EURUSD, GBPUSD, NZDUSD, USDCAD, USDCHF, USDJPY, AUDCAD, AUDCHF, AUDJPY, AUDNZD, CADCHF, CADJPY, CHFJPY, EURAUD, EURCAD, EURCHF, EURGBP, EURJPY, EURNZD, GBPAUD, GBPCAD, GBPCHF, GBPJPY, GBPNZD, NZDCAD, NZDCHF, NZDJPY
I may add more pairs later.
Note: The entry strategy in this script is not intented to win. Check the result. Be careful.

Custom FIBOThis script shows 3 Donchian Channel 78.6% and 21.4% intermediary level lines to perform trade analysis. Besides those 6 lines it also optionally shows Fibonacci's retracements with 100%, 127%, 162%, 200% and 262% for one of the Donchian channels.
The 3 Donchian Channels used have default lengths 72, 305 and 1292, calculated after the first length default value of 72. For each of the 3 Donchian Channels only an upper line, set by default at 78.6%, is plotted in green and its complement, set to 21.4%, is plotted in red. When the closing price is above 3 green lines, we say it is Forbidden to Sell ( PV ), and when the closing price is below 3 red lines, we say it is Forbidden to Buy ( PC ). Those conditions are flagged on the chart. These PV-PC conditions were, up to my knowledge, first proposed by Bo Williams.
Fibonacci's retracements are show for the Donchian Channel with length 72 by default, but it can be changed to any length. They are colored as fuchsia (100%), blue (127%), orange (162%), yellow (200%) and navy (262%).

CCT - CryptoCoin TraderEnglish:
------------------
Mostly tested on Crypto Currencies
2 different usages for 2 different situations
For high volatity, use light color thick lines. Ignore the dark ones.
For standard, use dark and thick lines.Ignore the light ones.
When price bar's high hits the red line = sell
When price bar's lowhits the green line = buy
Wait for the lines keep horizontal before use it for signal.
Türkçe:
Çoğunlukla kripto para grafiklerinde test edilmiştir.
2 tip kullanımı vardır.
Volatil piyasa için açık renkli kalın çizgileri kullanın.
Normal piyasa için için koyu renkli ince çizgileri kullanın.
Fiyat barının yüksek değeri kırmızı çizgiye değdiğinde = sat
Fiyat barının düşük değeri yeşil çizgiye değdiğinde = al
Sinyal olarak kullanmak için, Çizgiler yataya bağlayana kadar bekleyin.

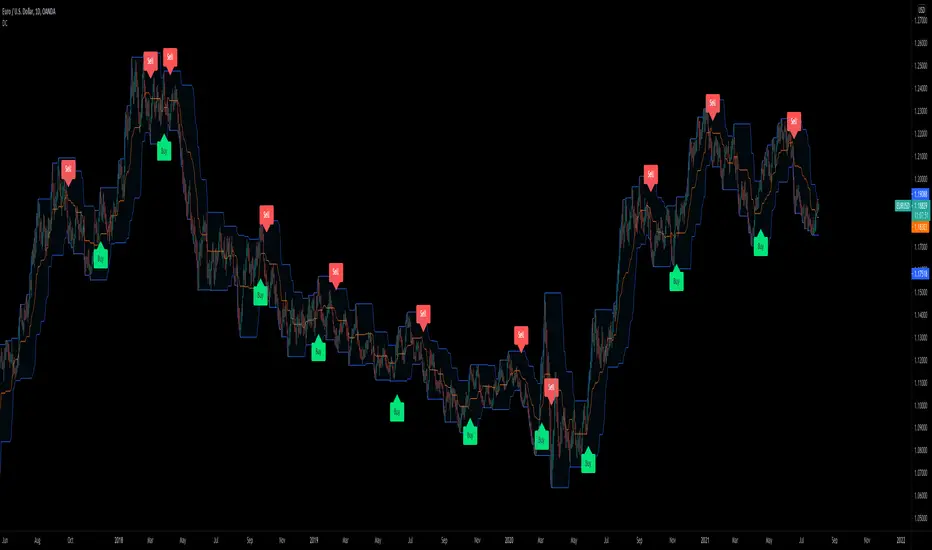
Donchian Channels Trending Breakout StrategyThis script looks for two entry signals. Long is when the previous breakout of the donchian channels was a low, price is above the input EMA, current price is equal or higher than the upper band and we're not in a position yet. Short is the other way around, so previous breakout of the donchian channels was a high, price is below the input EMA, current price is equal or lower than the lower band.
I haven't found a script that does take the previous highs and lows into consideration. Works for any markets in any conditions because the stop loss and profit targets are based on the upper and lower band of the donchian channels, which means the stop loss and profit targets move with the trend.
For more details see the script itself, I wrote a ton of comments.

HiLo Extension This Strategy is finding high and low breaks of the day and enter into the trader based on RSI value and time value
1) This strategy is created for Indian Index like Nifty, Bank Nifty and so...
2) Trades are initiate only after 10:15 AM and before 3:10PM
3) High and Low of the day break will be check during the above time frame
4) RSI value will be check (RSI 50)
5) and trade will be initiate
6) Stop loss set as vwma 20...
Note: This Script will work fine in Index future chart not index spot chart...
This is just my idea only... Please back test yourselve, before using it..
Your comments are welcome!

MACD Crossover trend strategy, Long and ShortHey everybody,
This is my first strategy and script I wrote mostly myself. There's tons of content out there to learn how to code in Pinescript and it's exactly what I wanted and needed in this time of my life.
In any case, I made a rather simple MACD crossover strategy that only takes trades in the direction of both EMA and SMA (there are inputs to change the length of the moving averages and lots of other stuff too).
If the MACD line crosses upwards on the signal line, while above the zero point of the histogram and the price is above EMA + SMA , it's a long signal.
If the MACD line cosses downards on the signal line, while below zero on the histogram and the price is below EMA + SMA , it's a short signal.
There are a lot of default variables that make no sense, for basically any symbol you're going to be looking at. You're going to have to adjust the EMA , SMA , backtest date, take profit, stop loss and all that good stuff yourself to find decently profitable parameters.
I made this myself because I couldn't really find a strategy out there that allowed for so much customizing and it's an easy way to get started in Pinescript.
If you have any suggestions, tips or you see a flatout mistake in my code, please let me know. I'm still learning, everyday and I'm enjoying every second of it.

hamster-bot PDD Pump and Dump DetectorPump and Dump detector by hamster-bot
strategy author: foresterufa
Pump and Dump detector (PDD)
This is a trend strategy, with a unique mechanism of multi-stage re-entry into a position (Take Profit-Entry) when a significant trend develops, based on our HiDeep indicator.
Positions are opened by the HiDeep indicator signal with trend direction filtering and volatility filtering. Positions are closed by a HiDeep indicator signal or a change in the trend direction.
The position can be accompanied by a unique Stoploss trailing MA.
