RSI K-Means Clustering [UAlgo]The "RSI K-Means Clustering " indicator is a technical analysis tool that combines the Relative Strength Index (RSI) with K-means clustering techniques. This approach aims to provide more nuanced insights into market conditions by categorizing RSI values into overbought, neutral, and oversold clusters.
The indicator adjusts these clusters dynamically based on historical RSI data, allowing for more adaptive and responsive thresholds compared to traditional fixed levels. By leveraging K-means clustering, the indicator identifies patterns in RSI behavior, which can help traders make more informed decisions regarding market trends and potential reversals.
🔶 Key Features
K-means Clustering: The indicator employs K-means clustering, an unsupervised machine learning technique, to dynamically determine overbought, neutral, and oversold levels based on historical RSI data.
User-Defined Inputs: You can customize various aspects of the indicator's behavior, including:
RSI Source: Select the data source used for RSI calculation (e.g., closing price).
RSI Length: Define the period length for RSI calculation.
Training Data Size: Specify the number of historical RSI values used for K-means clustering.
Number of K-means Iterations: Set the number of iterations performed by the K-means algorithm to refine cluster centers.
Overbought/Neutral/Oversold Levels: You can define initial values for these levels, which will be further optimized through K-means clustering.
Alerts: The indicator can generate alerts for various events, including:
Trend Crossovers: Alerts for when the RSI crosses above/below the neutral zone, signaling potential trend changes.
Overbought/Oversold: Alerts when the RSI reaches the dynamically determined overbought or oversold thresholds.
Reversals: Alerts for potential trend reversals based on RSI crossing above/below the calculated overbought/oversold levels.
RSI Classification: Alerts based on the current RSI classification (ranging, uptrend, downtrend).
🔶 Interpreting Indicator
Adjusted RSI Value: The primary plot represents the adjusted RSI value, calculated based on the relative position of the current RSI compared to dynamically adjusted overbought and oversold levels. This value provides an intuitive measure of the market's momentum. The final overbought, neutral, and oversold levels are determined by K-means clustering and are displayed as horizontal lines. These levels serve as dynamic support and resistance points, indicating potential reversal zones.
Classification Symbols : The "RSI K-Means Clustering " indicator uses specific symbols to classify the current market condition based on the position of the RSI value relative to dynamically determined clusters. These symbols provide a quick visual reference to help traders understand the prevailing market sentiment. Here's a detailed explanation of each classification symbol:
Ranging Classification ("R")
This symbol appears when the RSI value is closest to the neutral threshold compared to the overbought or oversold thresholds. It indicates a ranging market, where the price is moving sideways without a clear trend direction. In this state, neither buyers nor sellers are in control, suggesting a period of consolidation or indecision. This is often seen as a time to wait for a breakout or reversal signal before taking a position.
Up-Trend Classification ("↑")
The up-trend symbol, represented by an upward arrow, is displayed when the RSI value is closer to the overbought threshold than to the neutral or oversold thresholds. This classification suggests that the market is in a bullish phase, with buying pressure outweighing selling pressure. Traders may consider this as a signal to enter or hold long positions, as the price is likely to continue rising until the market reaches an overbought condition.
Down-Trend Classification ("↓")
The down-trend symbol, depicted by a downward arrow, appears when the RSI value is nearest to the oversold threshold. This indicates a bearish market condition, where selling pressure dominates. The market is likely experiencing a downward movement, and traders might view this as an opportunity to enter or hold short positions. This symbol serves as a warning of potential further declines, especially if the RSI continues to move toward the oversold level.
Bullish Reversal ("▲")
This signal occurs when the RSI value crosses above the oversold threshold. It indicates a potential shift from a downtrend to an uptrend, suggesting that the market may start to move higher. Traders might use this signal as an opportunity to enter long positions.
Bearish Reversal ("▼")
This signal appears when the RSI value crosses below the overbought threshold. It suggests a possible transition from an uptrend to a downtrend, indicating that the market may begin to decline. This signal can alert traders to consider entering short positions or taking profits on long positions.
These classification symbols are plotted near the adjusted RSI line, with their positions adjusted based on the standard deviation and a distance multiplier. This placement helps in visualizing the classification's strength and ensuring clarity in the indicator's presentation. By monitoring these symbols, traders can quickly assess the market's state and make more informed trading decisions.
🔶 Disclaimer
Use with Caution: This indicator is provided for educational and informational purposes only and should not be considered as financial advice. Users should exercise caution and perform their own analysis before making trading decisions based on the indicator's signals.
Not Financial Advice: The information provided by this indicator does not constitute financial advice, and the creator (UAlgo) shall not be held responsible for any trading losses incurred as a result of using this indicator.
Backtesting Recommended: Traders are encouraged to backtest the indicator thoroughly on historical data before using it in live trading to assess its performance and suitability for their trading strategies.
Risk Management: Trading involves inherent risks, and users should implement proper risk management strategies, including but not limited to stop-loss orders and position sizing, to mitigate potential losses.
No Guarantees: The accuracy and reliability of the indicator's signals cannot be guaranteed, as they are based on historical price data and past performance may not be indicative of future results.
Downtrend

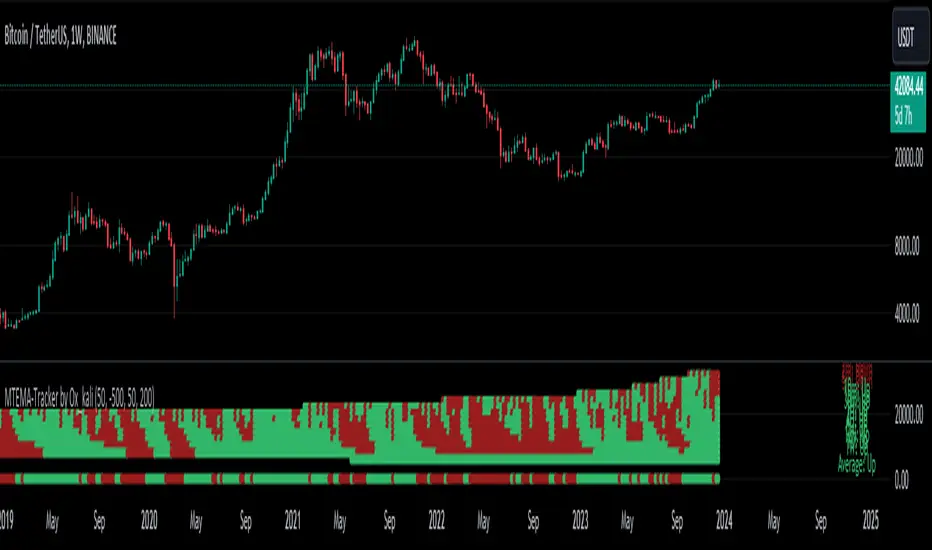
Multi-Timeframe EMA Tracker by Ox_kaliThis script is an advanced trend analysis indicator crafted for traders who seek a detailed and customizable view of market trends across multiple timeframes. This tool utilizes exponential moving averages (EMAs) to offer insights into market direction and momentum.
Key Features:
Multi-Timeframe Analysis: MTEMA-Tracker covers a wide range of timeframes, including 1, 2, 3, 5, 10, 15, 30 minutes; 1, 2, 4, 6, 12 hours; 1 day; and 1 week. This allows traders to analyze market trends from various perspectives, from short-term fluctuations to longer-term movements.
EMA-Based Trend Determination: The indicator employs two EMAs (50 and 200 periods) for each timeframe to ascertain the market trend. A higher EMA50 compared to EMA200 indicates an uptrend, while the opposite scenario suggests a downtrend.
User-Defined Trend Colors: Traders can personalize the appearance of the trend lines with custom colors for upward and downward trends, enhancing visual clarity and quick interpretation.
Selectable Timeframe Display: MTEMA-Tracker by Ox_kali offers the flexibility to choose which timeframes to display, enabling traders to focus on the most relevant data for their trading strategy.
Average Trend Calculation: A unique feature of MTEMA-Tracker is its ability to compute the average trend across all selected timeframes, providing a holistic view of the market's general direction.
List of Parameters:
Color of the trend: Customizable color settings for both upward and downward trends.
Settings for the Lengths of the EMAs: Options to set the lengths of the short and long-term EMAs.
Display Options for Each Timeframe's EMA Trend: Ability to activate or deactivate the display of EMAs for each selected timeframe.
Indicators and Financial Name Label settings: To ensure maximum clarity and understanding of the displayed trends, users should not hesitate to use the function to display "indicators and financial name labels" in their settings. This feature will help in identifying the legends for each trend, making it easier to interpret the market direction for the selected timeframes.
Please note that the MTEMA-Tracker is not a guarantee of future market performance and should be used in conjunction with proper risk management. Always ensure that you have a thorough understanding of the indicator’s methodology and its limitations before making any investment decisions. Additionally, past performance is not indicative of future results.
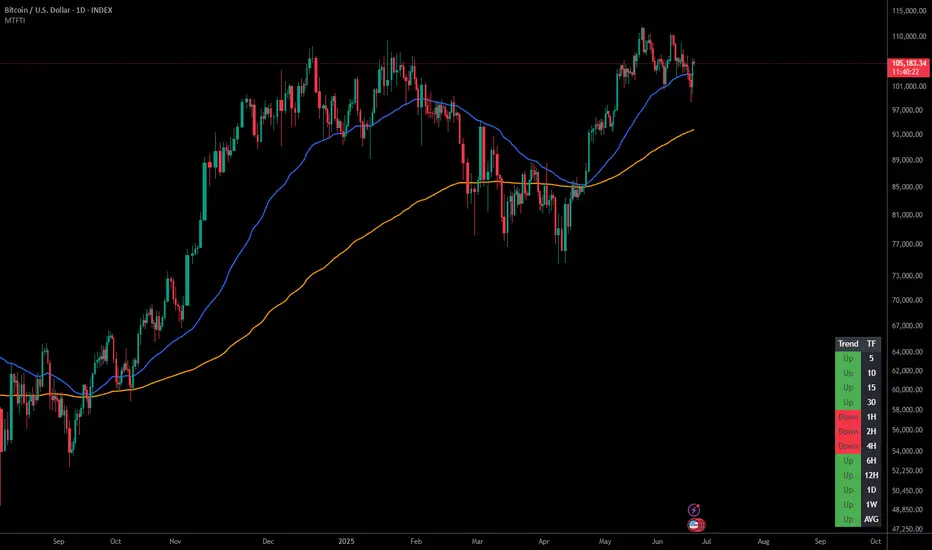
Multi-Timeframe Trend IndicatorThe Multi-Timeframe Trend Indicator (MTFTI) is a trend analysis tool designed to help traders quickly and easily assess the market direction across multiple timeframes. With the help of a table to visualize the trends on different timeframes.
Key features:
Multi-timeframe trend indicator for the following timeframes: 5 minutes, 15 minutes, 30 minutes, 1 hour, 2 hours, 4 hours, 6 hours, 12 hours, 1 day, and 1 week and average.
Displays trends for selected timeframes in a table.
Considers short and long-term exponential moving averages (EMAs) to determine trends.
Calculation of the average trend for all timeframes.
Display of trends with appropriate coloring for better readability (green for "Up", red for "Down", and intermediate shades for neutral or strong trends).
List of Parameters
Customization of the table's position on the screen (top-left, top-right, middle-left, middle-right, bottom-left, bottom-right).
Setting the lengths of the short and long-term exponential moving averages.
Option to activate or deactivate the display of EMAs for better customization (true by default).
Please note that the MTFTI is not a guarantee of future market performance and should be used in conjunction with proper risk management. Always ensure that you have a thorough understanding of the indicator’s methodology and its limitations before making any investment decisions. Additionally, past performance is not indicative of future results.
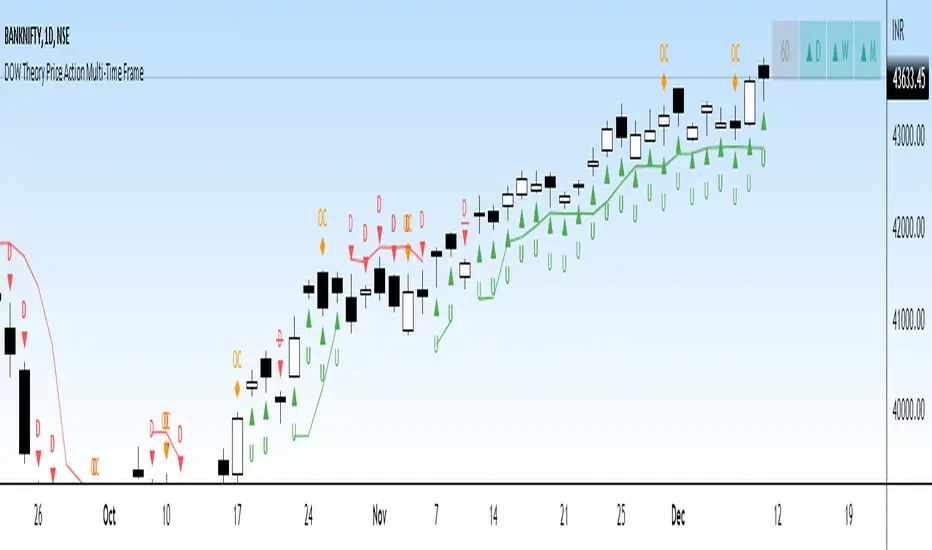
DOW Theory Price Action Multi-Time FrameThis indicator gives a visual representation of Dow Theory Price action based trend analysis and provides trader a table with 4 different timeframe to align with the trend.
It will help traders identify if it is an ongoing Impulse Wave or a Corrective Wave.
3 rules for Bullish Price Action setup (Uptrend or continuation of existing UpTrend): Denoted by 'U' below the candlestic
HH - Higher High
HL - Higher Low
CAH - Close above prior High
3 rules for Bearish Price Action setup (Downtrend or continuation of existing DownTrend): Denoted by 'D' below the candlestic
LH - Lower High
HL - LowerLow
CAH - Close below prior Low
Exception - Outside Candle: Denoted by 'OC' above the candlestic
Outside reversal is a two-day price pattern that shows when a candle or bar on a candlestick or bar chart falls “outside” of the previous day's candle or bar.
The table posistion can be set be user from the input settings as per his screen setting / resolution.
The trailing line can is also customizable from inputs, recomended value is 3-4.
Ideation Credits: Mr. Vineet Jain
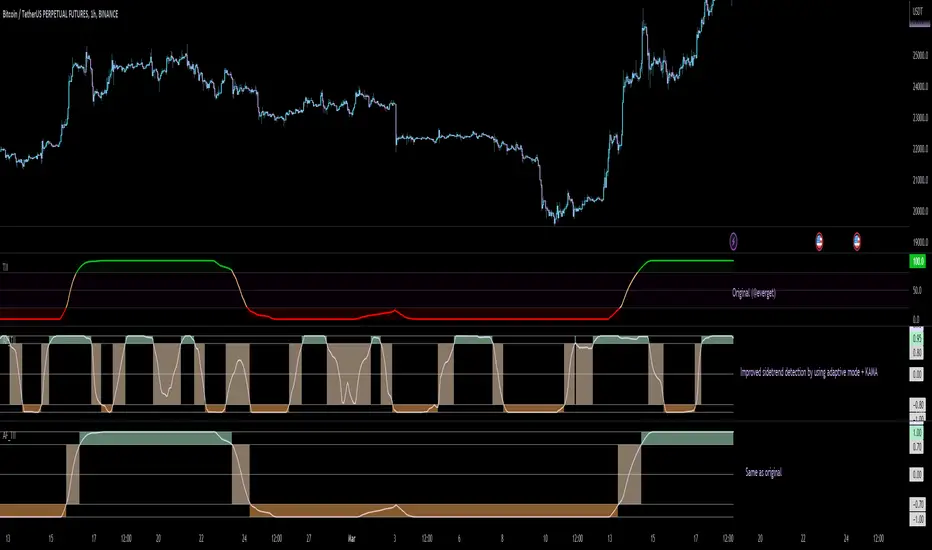
Adaptive Fisherized Trend Intensity Index Introduction
Here, I modified the script "Trend Intensity Index" (TII) of @everyget.
TTI was developed by M.H. Pee, who also published other trend analysis indicators like the Trend Trigger/Continuation Factor
It helps to determine how strong the current trend is.
The stronger the trend, the higher the chance the price may continue moving in the current direction.
Features
Adaptive mode (based on Ehlers dominant cycle determination) => automatically determines the length
Inverse Fisher Transform => gives sharper signals
Customizable MA Types => discover the impact of different ma bases
Hann Window and NET smoothing => state-of-the-art smoothing
Trend Visualization => shows you the up/down/side trend
Usage
This indicator here offers a perfect trend filtering system. It is capable of up/down/side trend detection.
There are a lot of trend indicators which don't respect sidetrends, which makes this indicator pretty useful.
A lot of traders use trend-following trading systems.
A trader will usually make his/her entry in the market during a strong trend and ride it, until the TII provides an indication of a reversal.
For mean-revertive trading systems, you could use TII to just trade in side trend.
A lot of mean-revertive signal emitters like Bollinger Bands or RSI work most of the times better in side trend.
Furthermore, every timeframe could be used, but higher timeframes have more impact because trends are stronger there.
Signals
Green zone (Top) => Etablished bullish trend
"Peachy" Zone (Middle) => Sidetrend/flat market
Red Zone (Bottom) => Etablished bearish trend
Enjoy guys!
(Let me know your opinions!)
--
Credits to:
@blackcat1402
@DasanC
@cheatcountry
@everget
Moving Averages With Cross AlertsA simple way to add up to 5 moving averages with optional crossover/crossunder alerts.
Available options for Moving Average Type are:
SMA
EMA (default)
HMA
RMA
WMA
VWMA
VWAP
ALMA
By default, 5 moving averages are enabled and set to the following:
MA1 set to 5
MA2 set to 13
MA3 set to 50
MA4 set to 200
MA5 set to 800
Each moving average has the following options:
Enable/Disable
Source (default is close)
Length
Color
4-Way EMA Trend4 separate EMAs that are used to determine trend, colored appropriately to reflect the trend to make it easy to tell what the trend is. All 4 EMAs are not needed, you can turn each one on and off individually and the indicator will adjust itself accordingly. Having a single EMA will use the closing price to determine the trend. There are 2 different types of trend detection; EMA Flip and EMA Confluence. EMA Flip is dependent on all active EMAs rising or falling in the correct hierarchical order. The EMA Confluence option is if all EMAs are moving in the same direction. I've found that this second option, EMA Confluence, is more accurate in getting in early before strong movements because the EMAs will more often move in the same direction before they "flip".

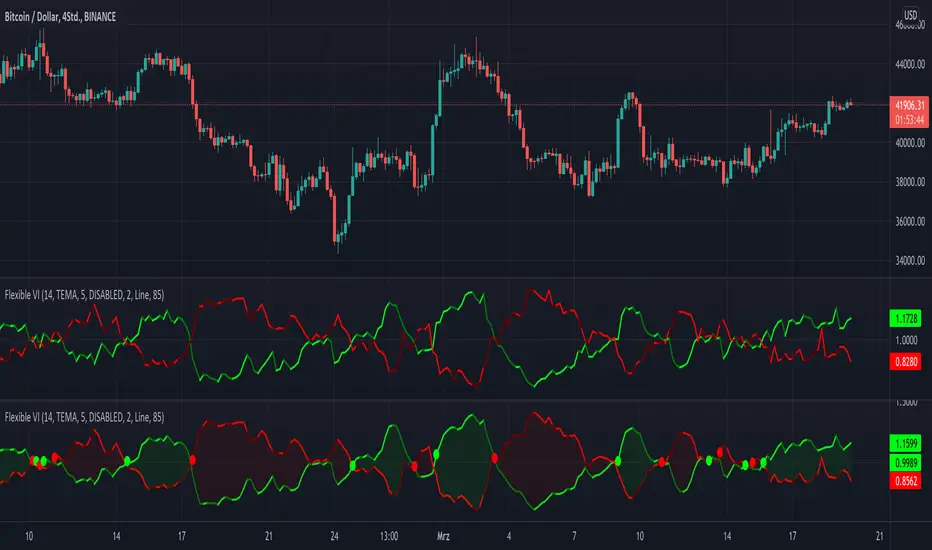
KINSKI Flexible Vortex IndicatorThe Vortex indicator is based on two trend lines that indicate an uptrend (VI+) or a downtrend (VI-) in the current market. This can be used to determine trend reversals or confirmations of current trends and directions. The number of periods is usually between 10 and 25. This indicator has 14 periods as its default value. You can adjust this value in the settings according to your needs.
A buy signal can be interpreted when VI+ is greater than VI-. Conversely, a sell signal exists when VI+ is smaller than VI-. Whenever a "crossing point" occurs, an imminent trend change can also be anticipated. If the differences from the highs and lows become larger and larger, a breakout is to be expected.
When using this indicator, please note that VI+ and VI crossings, especially during choppy price movements, can trigger false trading signals.
What distinguishes this Vortex indicator from others of this type?
Possibility to choose between different template templates that influence the display
Extensive setting options to emphasize upward and downward movements and cross points
The following settings are possible:
"Length": Adjustable period / default value = 14
"Template": "DISABLED", "Clear", "Informative" / Default value = DISABLED
"Line: Size": Thickness of the vortex lines / default value = 2
"Line: Style Type": Display variants (options: "Line", "Stepline") / default value = "Line".
"Line: Up/Down Movements": Up and down movements are highlighted in color / default value = AN
"Cross Points: On/Off": Cross points are displayed / default value = OFF
"Bands: On/Off": Vortex lines are connected as a band / default value = OFF
"Bands: Transparency": Strength of transparency / default value = 85
Color codes: The color codes are explained in the settings
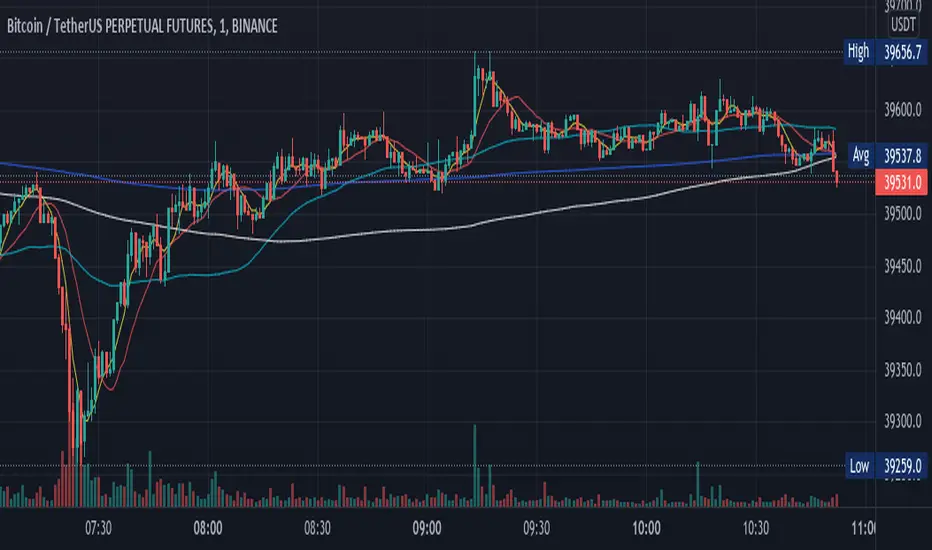
Up/Down Indicator - DurbtradeA simple but unique indicator to show ONLY whether there is an increase or a decrease in price compared to the previous value.
Also includes a customizable SMA or EMA based "Smoothing Length" variable,
allowing the indicator to show whether the SMA or the EMA of the price
is up or down compared to the previous value.
An offset option is also included if you need it.
Settings :
Personal thoughts :
I wanted to have an indicator that showed ONLY whether the price is UP or DOWN from the previous value.
My logic was that I could have a more accurate perception of general up or down trend direction
if I removed the AMOUNT of increase or decrease happening from moment to moment over time.
From there, I added the SMA/EMA "Smoothing Length" and "Smoothing Type" variables into the script.
By increasing the value of the smoothing length above 1,
the indicator act as a color-changing moving average, except without showing an actual value.
"Smooth Length" acts just like the length of any other moving average...
When the value of the "Smooth Length" is = 1, the indicator shows whether PRICE is up or down.
When the value of the "Smooth Length" is = 50, the indicator shows whether the MOVING AVERAGE with a length of 50 is up or down.
When the value of the "Smooth Type" is = 1, the indicator is SMA based.
When the value of the "Smooth Type" is = 2, the indicator is EMA based.
As you can see in the main chart above, or in the picture below, I show the indicator in 2 different ways...
The indicator on the top shows price up/down action,
and the indicator on the bottom shows the 50 SMA up/down action :
Other key points :
The indicator height can be smashed down as small as possible and still remain 100% functional...
which is very important when chart real-estate is limited.
Here is an example of my main layout setup, with the Up/Down indicator on the top left :
As you can see, it takes up very little space, but still remains fully functional.
In the example above, I have it overlayed on the left chart price panel,
with the price visibility turned off.
If it is overlayed on the price panel like so, and you want to see both the indicator and price,
simply turn the price visibility on to see both.
Since the indicator displays itself merely by changing the color of the background,
layer order has no effect, and the indicator is always drawn in the background.
The Up/Down indicator can also be used in conjunction with other candle types
that sometimes display candle color differently than standard candles, such as heikin-ashi candles.
Just take note that the colors of the indicator may not match the colors of the heikin-ashi candles.
Finally, I looked very hard to find an indicator like this on TradingView, and found absolutely nothing.
I know that it is a simple concept, but I'm honestly surprised I couldn't find anything like it.
I have been using it for awhile now, and I'm proud of the results...
therefore, I'd like to share it with the community, along with my previously published indicators,
in the hope that you find it useful!
Outro :
A) As with my previous indicators,
this one was written while keeping information, color, clarity, chart real-estate, and customization in mind.
B) It is optimized to be displayed on all display setups...
for use on your own personal television, laptop, or cellular phone screen...
and on all chart zoom levels and layout styles.
C) Please feel free to comment your thoughts, critiques, or suggestions. They are all very helpful!
D) Check out my previous pine script indicators if you like this one. They work really well together.
E) I hope that you find this script useful.
F) Enjoy!
// Durbtrade

Tipsy EMA Tipsy EMA
v0.2a
Coded by vaidab.
A simple strategy to buy dips in an uptrend.
How to use:
- buy on trend when price retraces to the orange "buy" line and compound orders
- sell when price reaches red line (stop loss) or at 💰 (take profit)
Note that you can reverse trade on the 💰 sign for a short scalp / day trade.
Uptrend: green/red background. Danger zone: orange bg. No go zone: no bg.
Potential buys (in a clear trend): 55, 100, 200 EMA touches and
fibo retracements to .382 and .618.
Potential stop loss: when price breaks the 200 EMA (marked by a red line).
Exit signs: opposite trend divergences (RSI).
Take profit: EMA 55 crossing down EMA 100.
Use it in confluence with market structure. E.g. If 200 EMA ligns up with
past market structure, if there are whole numbers or if there's a monthly level.
Tested BTCUSDT D, 4H

KINSKI ADXThis ADX indicator (Average Directional Index) tries to estimate the strength of a trend. The Average Directional Index is derived from the positive (+DI) and the negative directional indicator (-DI). The direction of movement is determined by comparing the highs and lows of the current and past periods.
As soon as the indicator determines a trend strength for upward or downward trend, a label is displayed. An upward trend is labelled "Bullish Trend". The downward trend bears the label "Bearish Trend".
The clouds in the background represent the movements of the Average Directional Index High/Low:
Color orange: neutral, uncertain in which direction it is going.
Color green: upward trend
Color red: downward trend
The line represents the average value of the ADX signal:
Color orange: neutral: still uncertain in which direction it is going
Color green / outgoing line: upward trend
Color green / descending line: weakening upward trend
Color red / exiting line: downward trend
Color red / descending line: weakening downward trend
The following configurable options are possible:
"ADX Smoothing
Directional Index Length
Level Range
Level Trend

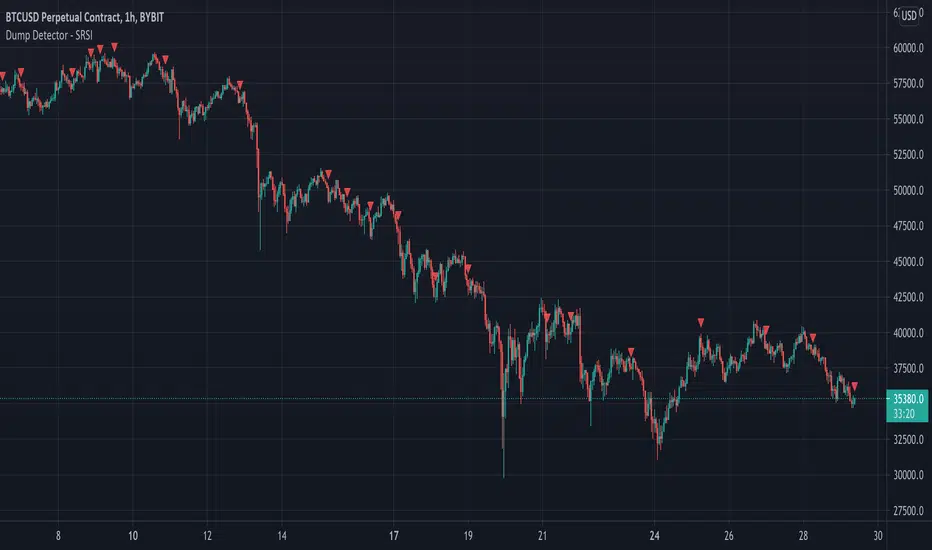
Dump Detector - Stochastic RSIDump Detecter uses Stochastic RSI to detect dumps/downtrends. Can be used as an exit trigger for long bots or an entry trigger for short bots. Change settings to lower timeframe for scalping. Pump signals can be turned on with tickbox.
Default Settings are not the usual Stochastic RSI setup and have been tuned to bitcoin 3hr chart:
Timeframe = 3hrs
smoothK = 3
smoothD = 3
lengthRSI = 6
lengthStoch = 27
src = close
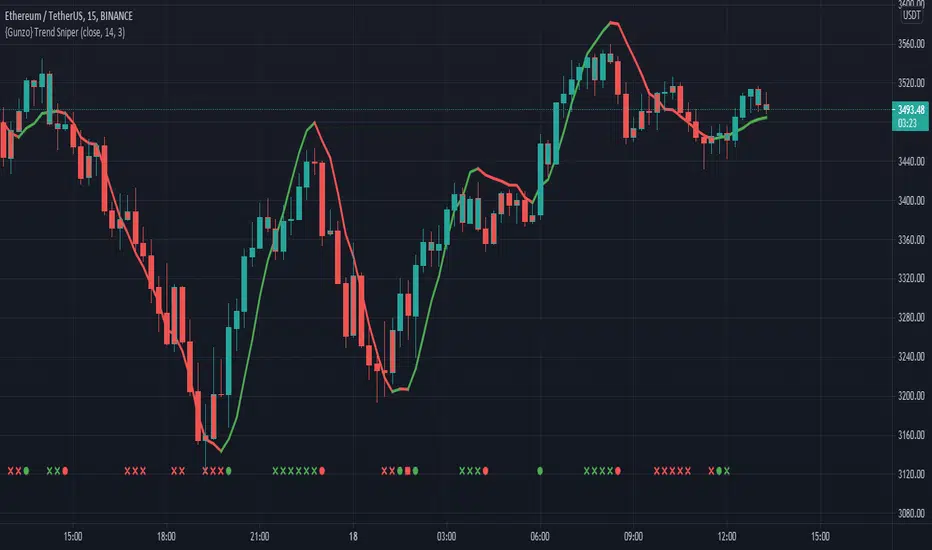
{Gunzo} Trend Sniper (WMA with coefficient)Trend Sniper is a trend-following indicator that sticks closer to the trend than others moving averages as it is using an upgraded weighted moving average implementation.
OVERVIEW :
It is typical to use a moving average indicator (SMA, EMA, WMA or TMA) to identify the trend of an asset. Standard moving averages indicators smooth the price and doesn’t stick very closely to the actual price, showing potential lagging information.
CALCULATION :
In order to have a trendline that sticks to the price, we are going to use a weighted moving average as it puts more weight on recent candles and less on past candles. The weight is usually calculated using the distance from current candle to the other candles used in the calculation. We have the following formula for the standard calculation as implemented in TradingView :
WMA_standard = (Price1 * Weight1 + …… + PriceN * WeightN)) / (Weight1 + …… + WeightN)
This “Trend Sniper” indicator uses an additional coefficient to alter even more the weight of each candle.
WMA_with_coefficient = (Price1 * (Weight1 - Coefficient) + …… + PriceN * (WeightN - Coefficient)) / ((Weight1 - Coefficient) + …… + (WeightN - Coefficient))
SETTINGS :
MA source : Source used for moving average calculation (ex : “close”)
MA length : Length of the moving average. Higher values will give a smoother line, lower values will give a more reactive line.
Use extra smoothing : Enable/disable usage of a EMA to extra smooth the line curve. If activated the indicator may be lagging, but it will also avoid many false buy/sell signals.
MA extra smoothing length : Length of the moving average of the extra smoothing.
Change candle colors : Enable/disable painting the candles of the chart with the colors of the weighted moving average.
Display buy/sell signals : Display buy/sell signals (circles) when the moving average is changing direction
VISUALIZATIONS :
This indicator has 3 possible visualizations :
Moving Average line : the line represents the weighted moving average that is following the price of the asset, when the line goes up we are in a uptrend (green line) when the line goes down we are in a downtrend (red line).
Candle coloring : the color of the moving average line can be applied to the candles of the chart for better readability.
Signals : Buy/Sell signals can be displayed at the bottom of the chart
USAGE :
This indicator can help analyze the trend directional changes :
First of all, if the moving average line is under the price (or above the price), then we can assume that the uptrend is strong (or downtrend is strong).
If the current candle crosses the moving average line, it is the first sign that the trend is weakening and possibly starting to revert.
If the weighted moving average is changing direction, then the trend change is confirmed and the color of the line changes
Trend Type Indicator by BobRivera990Usage:
The purpose of this indicator is to programmatically determine the type of price trend using technical analysis tools.
You can do a quick check on the asset’s higher and lower time frames. For example, if you are trading on an H1 chart, you can check the m5 chart to ensure that the trend is in the same direction and similarly check the H4 chart to ensure that the higher time frame price is also moving in the same direction.
If multiple time frame charts confirm a similar trend, then it is considered a very strong trend and ideal for Trend trading.
Remarks:
By default, the last status is related to 8 periods before the latest closing price.
Related definitions:
The three basic types of trends are up, down, and sideways.
1. Uptrend
An uptrend describes the price movement of a financial asset when the overall direction is upward. The uptrend is composed of higher swing lows and higher swing highs.
Some market participants ("long" trend traders) only choose to trade during uptrends.
2. Downtrend
A downtrend refers to the price action of a security that moves lower in price as it fluctuates over time.
The downtrend is composed of lower swing lows and lower swing highs.
3. Sideways
A sideways trend is the horizontal price movement that occurs when the forces of supply and demand are nearly equal. This typically occurs during a period of consolidation before the price continues a prior trend or reverses into a new trend.
How it works:
Step 1: Sideways Trend Detection
In this step we want to distinguish the sideways trend from uptrend and downtrend. For this purpose, we use two common technical analysis tools: ATR and ADX
1. Average True Range (ATR)
The average true range (ATR) is a technical analysis indicator that measures market volatility.
We also use a 20-period moving average of the ATR.
When the ATR is below the average of its last 20-periods, it means that the rate of price volatility has decreased and we conclude that the current trend is sideways
2. Average Directional Index (ADX)
The average directional index (ADX) is a technical analysis indicator used by some traders to determine the strength of a trend.
The trend has strength when ADX is above 25.
So when the ADX is less than or equal to 25, there is no strong trend, and we conclude that the current type of trend is sideways.
Step 2: Detect uptrend from downtrend
If it turns out that the current price trend is not sideways, then it is either uptrend or downtrend.
For this purpose, we use plus and minus directional Indicators (+ DI & -DI).
A general interpretation would be that during a strong trend, when +DI is higher than -DI, it is an uptrend. When -DI is higher than +DI, it is a downtrend.
Parameters:
"Use ATR …" ________________________// Use Average True Range (ATR) to detect Sideways Movements
"ATR Length"_______________________ // length of the Average True Range (ATR) used to detect Sideways Movements
"ATR Moving Average Type" ___________// Type of the moving average of the ATR used to detect Sideways Movements
"ATR MA Length" ____________________// length of the moving average of the ATR used to detect Sideways Movements
"Use ADX ..."_______________________ // Use Average Directional Index (ADX) to detect Sideways Movements
"ADX Smoothing”____________________// length of the Average Directional Index (ADX) used to detect Sideways Movements
"DI Length"_________________________// length of the Plus and Minus Directional Indicators (+DI & -DI) used to determine the direction of the trend
"ADX Limit" ________________________// A level of ADX used as the boundary between Trend Market and Sideways Market
"Smoothing Factor"__________________// Factor used for smoothing the oscillator
"Lag"______________________________// lag used to match indicator and chart
Resources:
www.investopedia.com

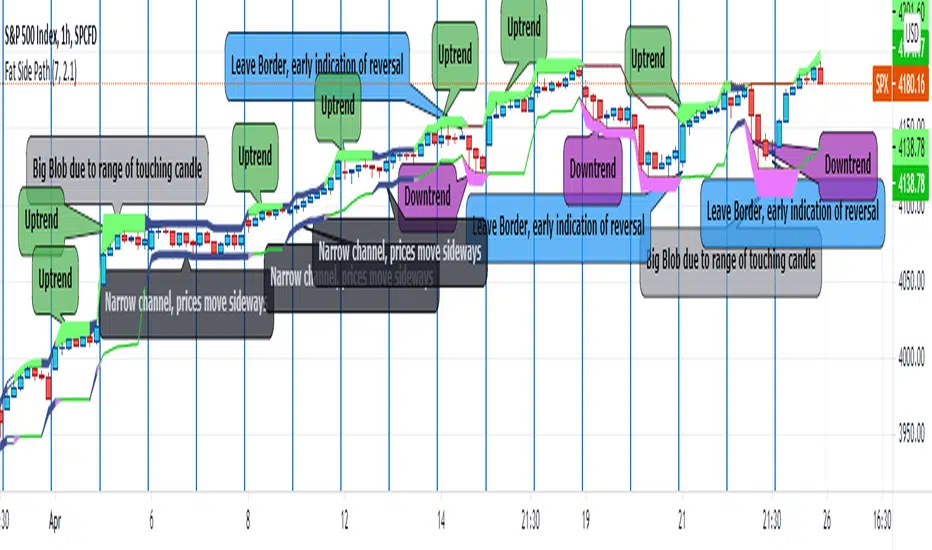
Fat Side PathI got the idea for a narrow Donchian Channel with a short lookback period which closely follows the price fluctuation in which the sides of the channel have a thickness according to the range of the last touching candle.
Any channel, be it Donchian, Keltner, Bollinger Bands or Parallel, has an upside and a downside, touching the upside is a buy signal as this may initiate an uptrend, the downside a sell signal because a down trend may come.
This gave me the idea to make only the last touched side fat, thus creating visible switching between uptrend and downtrend. However this is ‘too digital’, as in practice also periods of no trend occur in which signaling a trend would give a false signal. In a Donchian channel (and also Bollinger Bands) such periods are marked by narrowing the channel. So I gave a no trend signal to the sides when the channel is narrower than a minimum width to call a trend. I gave the thing nice colours and proper default settings.
Use of the channel in trading.
I think this thing can be useful for swing trading. In channels two typical things may happen that should be noted by the trader, these are LB, Leaving the Border, which signals a trend reversal and FTT, Failure To Traverse, i.e. the price doesn’t manage to cross the channel to the other side. This affirms the trend. FTT’s are not expected in short lookback channels like this path (Sidenote: Fibonacci levels can be regarded as predictions where FTT’s may occur). The fat side indicates direction. Because somehow trends seem to end with a notable range extension, this channel sometimes produces a “Big Blob” where the trend reverses.
I intend to use this thing together with my Keltner Fibzones channel, where the zones serve as a ‘landscape’ in which the Fat Side Path meanders providing ‘comments’ on the short term price movements.
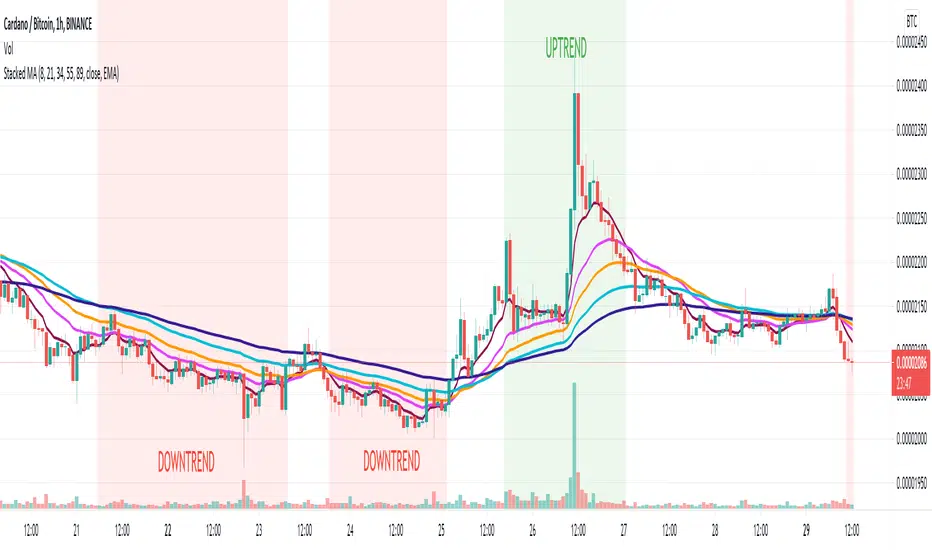
Stacked Moving AveragesThe Stacked Moving Averages indicator lets you see if a ticker is in an uptrend, downtrend, or no trend based on the condition of the moving averages. If the moving averages are stacked such that MA1>MA2>MA3>MA4>MA5, then that is described as an uptrend. If the moving averages are stacked such that MA5>MA4>MA3>MA2>MA1, then that is defined as a downtrend.
The moving averages can be SMA, EMA, or DEMA, and it’s possible to view all the moving average series in the chart or hide all series and only see if there is an uptrend or downtrend according to the condition.
Note: If length 4 OR length 5 is zero the MA4 OR MA5 will be ignored.
EMA CrossoversUseful for identifying and receiving alerts about uptrends and downtrends.
This script uses two Exponential Moving Averages (EMAs) to find price uptrends and downtrends. An Exponential Moving Average (EMA) is a type of moving average that places a greater weight and significance on the most recent data points. The script produces uptrend and downtrend signals based on crossovers and divergences between the two EMAs, the user will be able to spot a trend change (when the EMAs crossover) and to determine the strength of the current trend (when the EMAs diverge). It is also posible to get alerts for uptrends and downtrends on the web and mobile app with sound and pop-ups as well as via email. The optimal time to enter and exit the market can be concluded from this trend changes.
The user can set their own EMAs, by default they are set to 21 and 55 periods for medium and long term respectively. When the medium term EMA crosses below the long term EMA the asset is in a downtrend and the price will decline, and when the medium term EMA crosses above the long term EMA the asset is in an uptrend and price will increase.
This scripts plots the following indicators and signals on the chart to help the user to identify trends:
1.- Medium and long term EMAs as lines overlaid on the price chart.
2.- Up green triangles above bars when the price is on an uptrend and down red triangles below bars when the price is on a downtrend.
3.- Arrows with text to indicate the start of an uptrend or downtrend.
The user can enable and disable the indicators and signals as well as set colors and shapes to their liking.
This script also lets the user create alerts for uptrends and downtrends. To create a new alert using this script follow this instructions:
1.- Once you added this script to your chart, go to the alerts panel (right on web or bottom tool bar on the mobile app) and add a new alert (alarm clock icon with a plus sign).
2.- A modal window will open. On the “Condition” dropdown menu select “EMA Crossovers”.
3.- On the next dropdown menu (right below the “Condition” one) you can select from two types of alerts “Uptrend started” and “Downtrend started”.
4.- Lastly you can set all the normal alert options and create the alert.

Doble stochastic oscillator fast and slowThis is a two stochastic in one indicator :
We have a normal stochastic, and a slower one in order to identify changes in the price movement.
At the same time I added more levels, so its easier visually to identify in each scenario we are.
The slower oscillator, also change color based on direction it has.
Green color = long direction - > buy
Red color = short direction - > sell

Improved On balance volume with BB channel and double MAThis is an improved version of the on balance volume indicator.
I made it inside a bollinger band channel, so we can define better the zones. At the same time I applied 2 moving averages on OBV, to get a better idea of the trend and at same time that change direction of the trend.
Green - > uptrend - > we look for buy positions
Red - > downtrend -> we look for sell positions.
At the same time we have to be aware of crosses on bollinger bands, which can indicate a change in the trend .

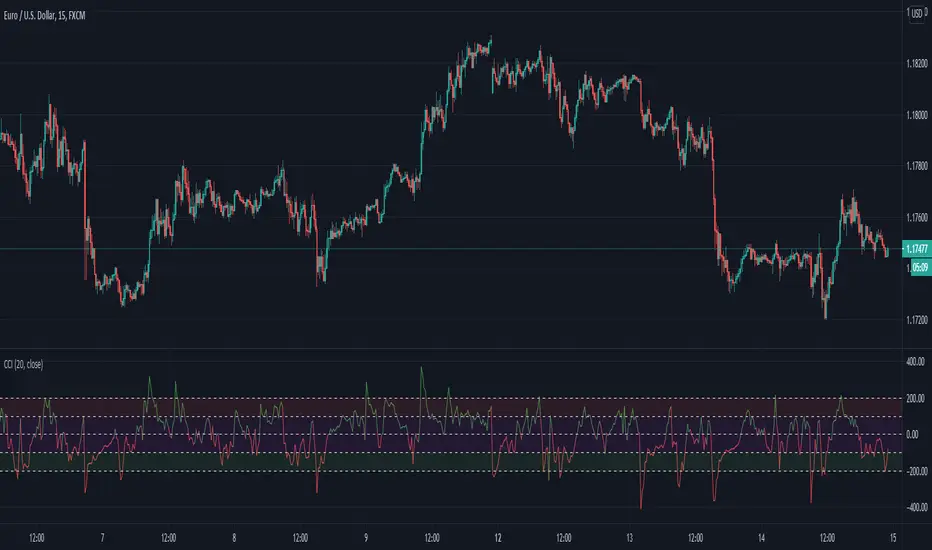
Improved Commodity Channel IndexI took the normal CCI version and I made it better and more pleasantly visual.
At the same time now the CCI changes color based on the direction is going to take
We also have more levels, to define even better the current situation.
Details are simple :
green color cci = uptrend - > buy
red color cci = downtrend - > sell
RSI TrendsRSI is a momentum indicator, however most people seem to be using it to go against the momentum by trying to identify tops/bottoms using it. Its in my opinion the wrong way to be using it. It can be easily used for trend following which seems like a better use for it.
Uptrend - RSI > 60
Downtrend - RSI < 40
Sideways - RSI between 40 and 60
If however not interested in filtering for sideways trends and convert it to a long-short only strategy that stays in market all the time then it can be simply modified by setting both overbought/oversold thresholds to 50. In such a case uptrend will be above 50 and downtrend will be less than 50.
Note: wait for close for current bar to be confirmed as RSI is calculated at close

Y&J BOOMERANG EMA x3Basic EMA scalping strategy . HFX Short time frames, using candlestick patterns to find Exponential Moving Highs and Low to Indicate Active Trends

Volume Divergence by MMIt's a simply volume indicator. You should watch for breaks on both volume uptrend and volume downtrend. It uses fibonacci numbers to build smoothed moving average of volume.
Also you can check divergences for trend reversal and momentum loss.
