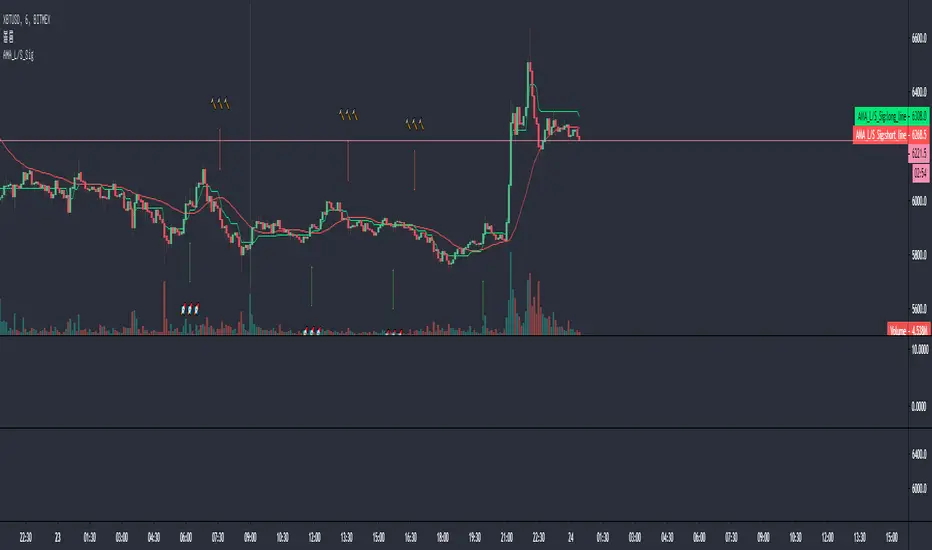
AMA_L/S_Sig- Fast EMA, Slow EMA Cross Strategy
- Use AMA for Slow
- Fast is expressed in some smoothing ways
- Hyper parameters not tuned
- For reference purposes
Emacross
EMAsCross_byAJSThis custom indicator can help you to see whether a stock is following or losing it's currently tendency, as also a buying/selling signal.

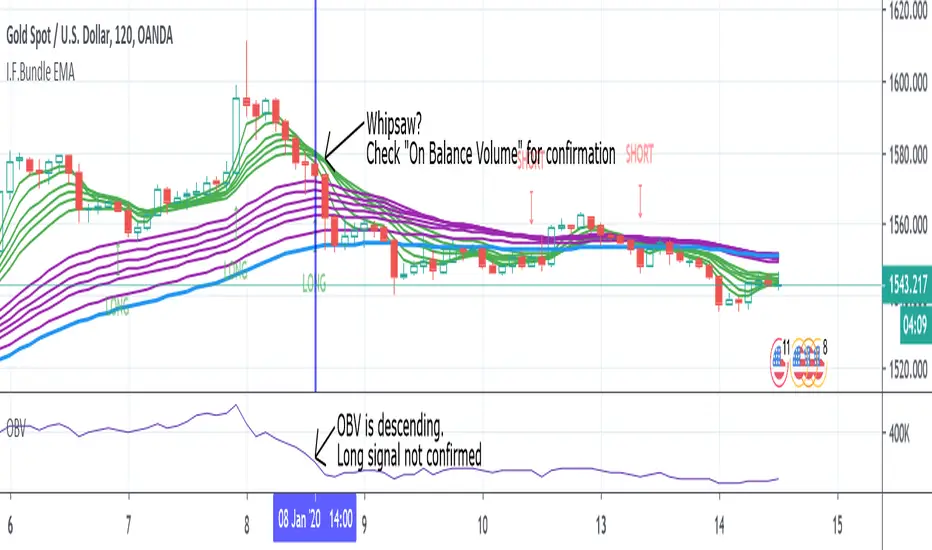
Investing Fellow Bundle EMAThis script uses the Bundle EMA to signal possible entry points for Long or Short positions. Bundle EMA could be used in Forex, Commodities, and other markets (e.g., Crypto), and it is not influenced by seasonality. I'm personally using it also on stocks.
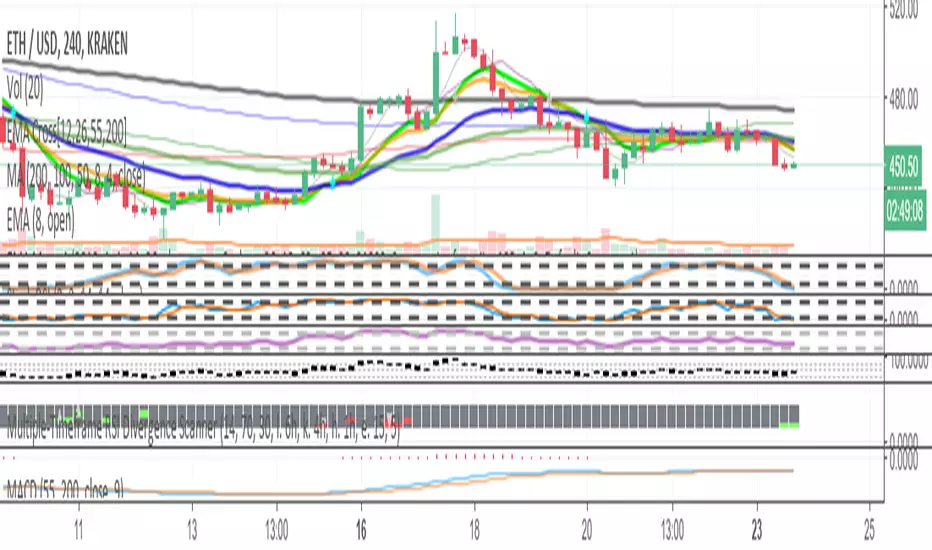
The script is built over the theory of Daryl Guppy, and it has been manipulated to have good reliability on all timeframes, even if I prefer to use it with D, H1, H2, H4. The Investing Fellow Bundle EMA is set to give trading signals when the opportunity is still forming (be aware because this could generate many whipsaws). I preferred it to be faster, and you can experiment it on lower timeframes. In addition to the fast (green) and slow (purple) Bundle EMA, I plotted a further EMA (70 EMA - in blue) to be used as the signal line. 70 EMA is useful to better analyze script signals and to weigh the importance of them. A Long signal on a candle under the 70 EMA and a Short signal on a candle above 70 EMA are strong signals. Furthermore, signals that form around the 70 EMA tend to be stronger (possible trend reversal) than signals that form far away from that line.
I use the script together with On Balance Volume "OBV" (strongly suggested) to confirm signals and avoid whipsaws. OBV relies on the theory that volume precedes prices. Divergences are seen as an important confirmation of trend reversal with this indicator.
In case of no divergence on a Bearish/Bullish market, a Long/Short signal could be generated by the Investing Fellow Bundle EMA in the opposite direction of the market. Check the OBV to verify if the signal is matching increasing/decreasing volume (the chart shows an example).
Don't forget to like this script if you find it useful!
You are always welcome to follow me here on TradingView.
Investing Fellow
Disclosure: My ideas contain statements and projections based on assumptions on capital markets, and therefore inherently subject to numerous risks and uncertainties.
Before buying or selling any stock you should do your own research and reach your own conclusion or consult a financial advisor. Investing includes risks, including loss of principal.
I am not a financial advisor.
BUY and SELL - Backtest single EMA cross By che_traderHi, I hope you're well!
At the request of my friend @jansrbtc I'm going to publish a simple emas crossing strategy.
We will do long or short at the cross of the two ema.
Good strategy for when an asset is in trend.
Warm: In choppy periods this indicator can be very affected by large drawdowns.
Enjoy!

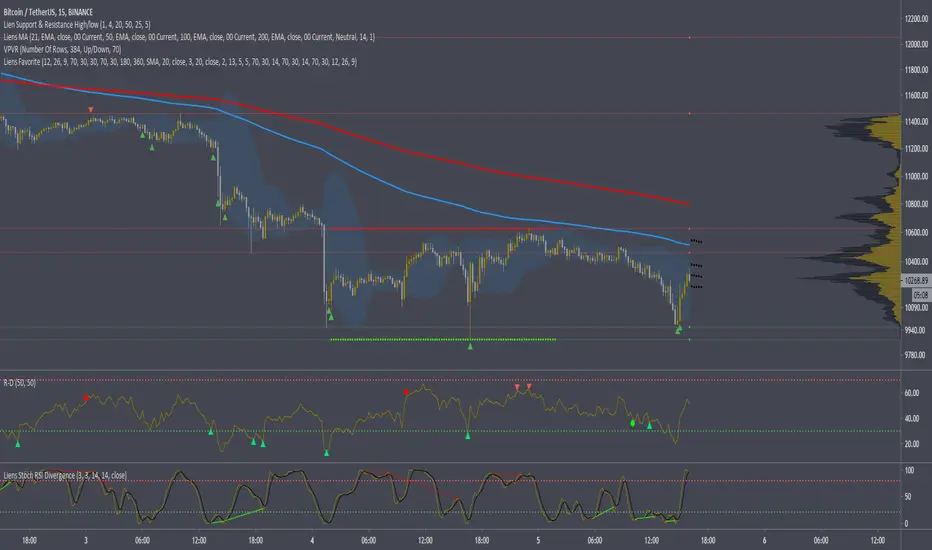
Liens FavoriteMy favorite scripts togheter.
1. Long / M/S-R.Trend changing direction. This is best on higher tf, but can be used on lower aswell. It gives signals when stochastic is overbought/oversold and the macd is crossing the 0 line.
2. This script got 2 ema lines ( Buy/Sell crosses )
3. MA line that changes color. Options - SMA", "EMA", "WMA", "VWMA", "SMMA", "DEMA", "TEMA", "HullMA", "ZEMA", "TMA", "SSMA". Sometimes i use this(ma) insdead of the bb center line.
4. Standar Bollinger bands with buy and sell signals - also added a function so buy and sell signals only show when stochastic is overbought/oversold for less false signals.
5. Stochastic Oversold/overbought on chart.
6. Macd Bearish and bullish crosses on chart.
Alerts for all functions.
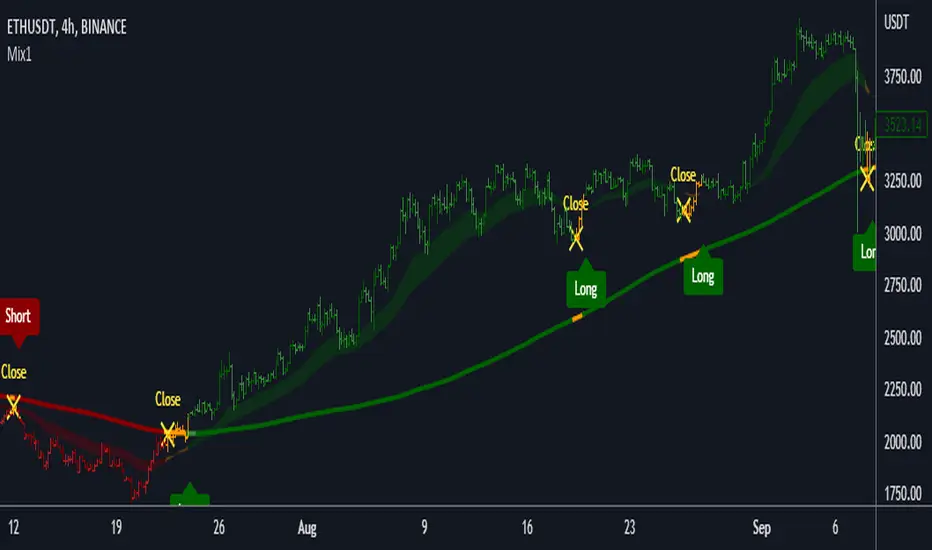
Mix1 : Ema Cross + Trend Channel [Gu5]Based on Trend Channel
Ema-crossover is added
Crossing alerts, only on trend
Basado en mi anterior indicador, Trend Channel
Se agrega Cruce de Medias Moviles (Ema-crossover)
Las alertas solo son en favor a la tendencia
El valor de SMA Range es arbitrario (No Backtesting). Cambia la amplitud de canal que determina cuando es rango (barras amarillas por estar muy cerca del SMA200, sin tendencia definida)
Range Multiplier adapta el indicador a distintos mercados
//Setting recommended for SMA Range
//BTCUSD = 100
//EURUSD = 1000
//SPX = 100
//ETHUSD = 10
Si te fue útil este indicador, puedes comprarme una cerveza ;)
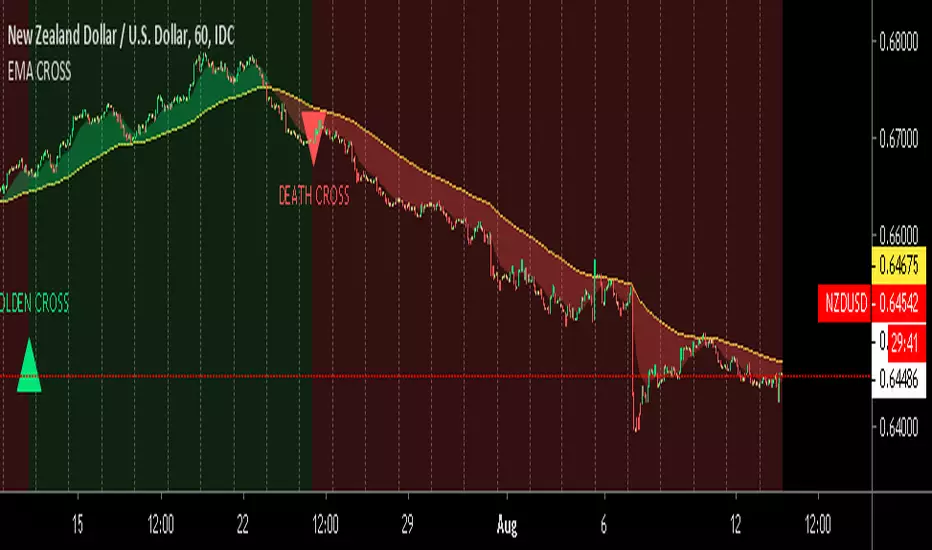
EMA GOLDEN & DEATH CROSSGolden Cross And Death Cross
A golden cross and a death cross are exact opposites. A golden cross indicates a long-term bull market going forward, while death cross signals a long-term bear market. Both refer to the solid confirmation of a long-term trend by the occurrence of a short-term moving average crossing over a major long-term moving average. (source: investopedia)
----
In this indicator we are using Exponential Moving Averages. Use this indicator with TradingView black template chart for a better view
EMA ClusterPlots 4 EMAs of your chosen length. Easy to manage multiple EMAs and saves on your allotted indicators for smaller tradingview plans.

EMA Bot Trigger - 14,26,55Work In Progress - Currently will send Long/Short triggers when EMA 14 Crosses EMA 26 - whether the cross is above the EMA 55 determines whether to Long or Short.
Pullback Trading [Fhenry0331]The indicator is taken from Alexander Elders "Triple Screen System," minus using the Weekly MACD as a filter/trend. I believe waiting for the force index and the weekly MACD histogram to line-up is uber conservative and a trader will miss too many signals (In my opinion).
The indicator is for a pullback trader. A trader that waits for a trend to develop then enters on a pullback.
The indicator defines an uptrend start: as the 13 ema crossing above the 26 ema. It defines a downtrend start: as the 13 ema crossing below the 26 ema.
The pullback in an uptrend: 13 ema is above the 26 ema. Elders-Force-Index is below the zero line. Price low has crossed below the 13 ema (one can also say price closes below the 13 ema if they so wish).
The pullback in a downtrend: 13 ema is below the 26 ema. Elders-Force-Index is above the zero line. Price high has also crossed above the 13 ema.
Please note that the pullback signals do not necessitate an automatic buy or sell (the instrument can be still pulling back deeper and not ready to resume it's trend.) One should place orders above (long) or below (short) bars with the pullback signals. Do so on signals until orders are filled.
Although the indicator is meant for pullbacks one can make an aggressive entry at the onset of a crossover of ema's.
For clarity background colors has been added to the indicator.
works well on daily time frame. Also look at intraday (5) minute time frame on trending stocks (news, earnings, volume, etc.)
Keep It Simple.
Enjoy!

Add MA Crossing Method (short, medium, long) (D)Add three EMAs that are usually used in crossing tactics and alerts to signal buy/sell

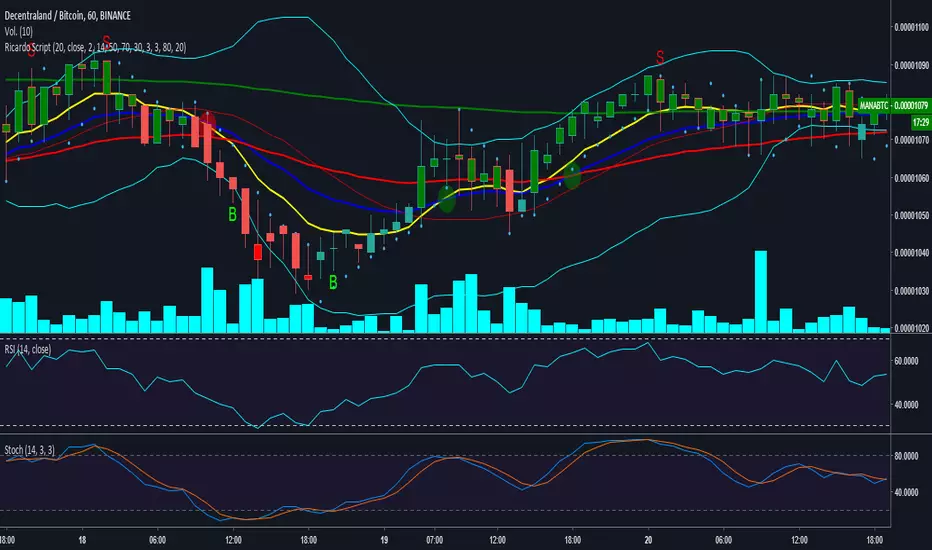
Ricardo Script Ver. 1* It is possible to create alarms with all the indicators
- ema10
- ema20
- ema50
- ema200
- Bollinger Bands
- Parabolic Sar
- Stochastic signal Overbought and Oversold
* Display the Rsi in the candles By green or red color, you can change the color from the panel, they will be highlighted in the candles above the RSI of 50 or you can activate it only when it is over bought and over sold in the range "70 and 30 "from the RSI
* Enables or disables the signs of purchase or sale of the Stochastic "RECOMMENDED FOR SCALPING WITH BOLLINGER BANDS"
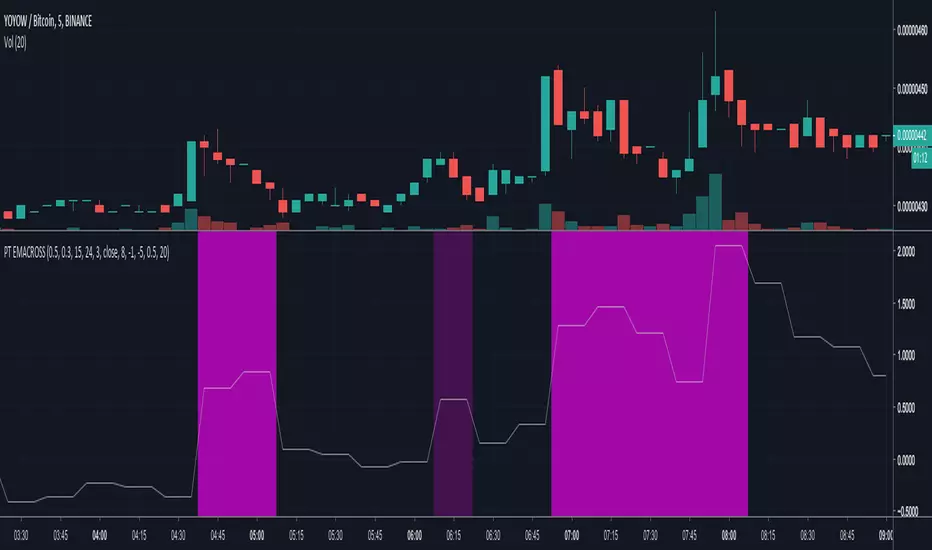
[ProfitTrailer] EMA Cross StudySupport buy/sell parameters for EMACROSS strategy.
The script highlights the regions where trailing is most likely to be successful.
CryptoGuru Signals [v2018-08-25]Built an all in one indicator providing buy / sell signals for CryptoGuru
from the ProfitTrailer trading bot discord as a Birthday Present for him.
Others on the discord seemed to like it so I am publishing it here for general use.
He made a request in our TradingView channel:
I'm looking to put together a buy signal for a 5 min time
frame that shows alerts me when a coin in BTC pairs. Is at
the lower of B.B. band or below the lower B.B. band combined
with RSI 30, and a 8/13 cross with the cross showing the coin
moving in up trend.
I made the indicator generic so it will work with any market, trading pair and timeframe.
You can select between ticker price / period or closing price.
The script uses multiple indicators including an EMA cross as its main signal and then optionally
makes use of RSI and Bollinger Bands to support the cross.
These individual indicators parameters can all be configured via the input screen and their colours
changed to suit your preference.
The display of the EMA lines is optional as is the display of the RSI and Bollinger Bands. The
signals will always display based on whatever input criteria you provide. If your input values
don't produce any signals then adjust them until they do.
Copyright (c) 2018, Grant Cause / CryptoCoyns

Junkie EMA Cross[26,12]Guys use this wisely and you can get good profit.
You can use this in 15 min. chart But you have to take care about volume.
If volume is good then no problem you can trust this indicator blindly.
I am Strongly Recommending Use this Indicator in Day Candle and Both Long and Short call is good.
Note:- This Indicator for Entry in Trade(Both Long or Short). You have to make your own Exit plan.
Thank you

EMA Mega Cross Strategy v2vastly improved and tuned. Million+% return from 2016. 2000+% return from 2018.
[AGHYAD]EMA-CROSS+CCI_BASED_ON_RENKO////////////////////////////////////////////
// 4 HOURS
// -------------------------- BUY --------------------------
// 1. MUST: Set Time_Frame To 1D
// 2. STRONG: Any Green Signal!!
////////////////////////////////////////////
EMA-CROSS + CCI SIGNALS BASED ON RENKO WITH CUSTOM TIME-FRAME

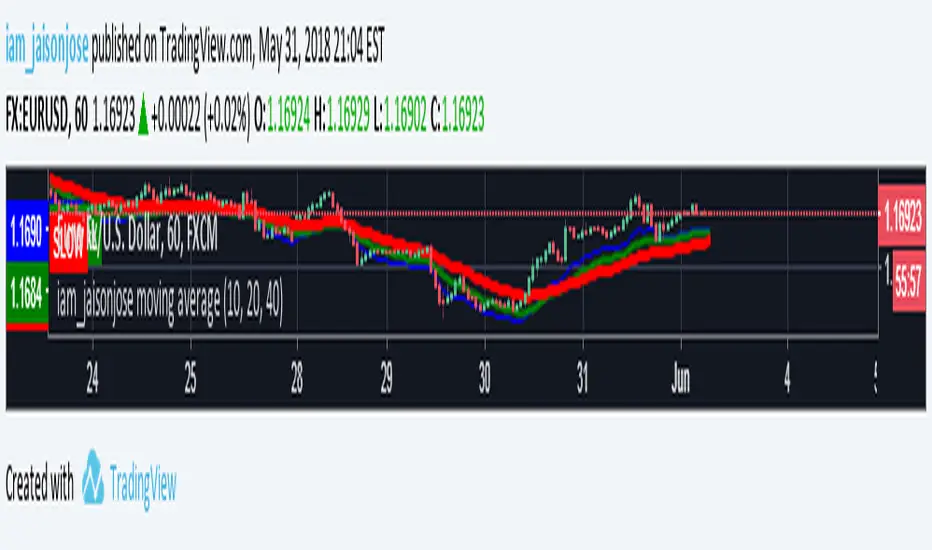
iam_jaisonjose 3 Moving Average (Exponential)This Indicator is a combination of 10, 20 & 40 EMA, which is very useful for determining the current trend.
MACD+EMA crossovers Strategy customIt is a Strategy to use EMA crossover and MACD to decide when "buy" and when "sell", the key is spend some time "tuning" the parameters and using the simulation tool to find the best parameters for EMA and MACD there are 6 parameters, but with Excel and patience you could find the best configuration for the past and apply it to the future and see.
