The Mechanical Trader - IndicatorThe Mechanical Trader — Indicator
The Mechanical Trader — Indicator is the visual companion to The Mechanical Trader — Strategy. It plots the same backtested confluences and conditions from the strategy directly on your chart — so you can more easily execute the same framework manually when those conditions appear.
On its own, it can also highlight potential discretionary setups such as breakouts, Fair Value Gaps (FVGs), and engulfing-based signals with optional bar-trend coloring — via on-chart visuals and optional alerts.
It visualizes:
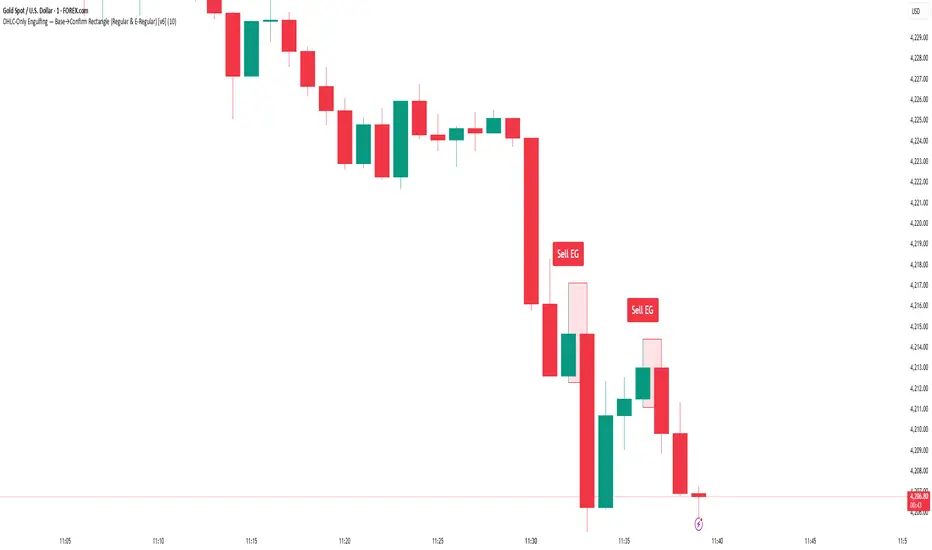
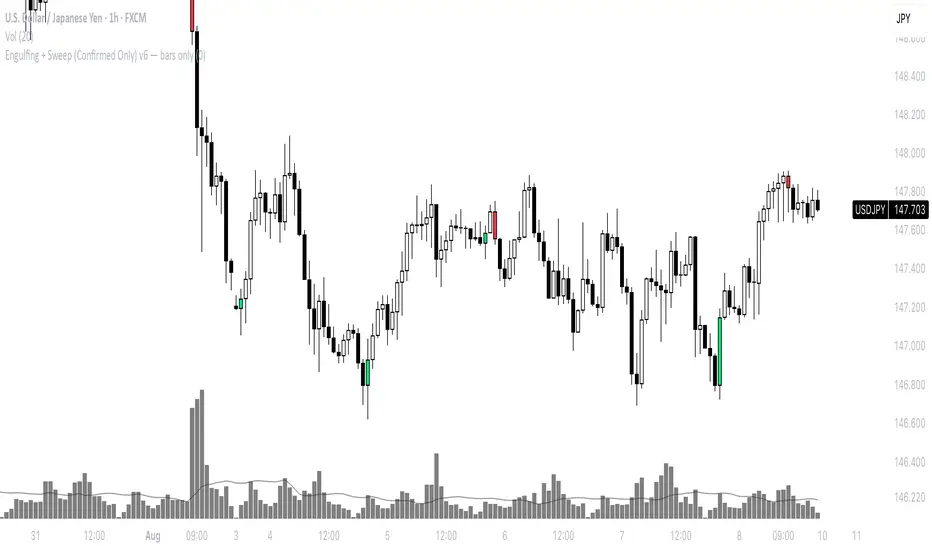
- Engulfing structure (optional bar coloring + markers)
- Fair Value Gaps (FVGs) with mitigation handling
- Liquidity levels (HTF: previous D/W/M highs/lows + D/W/M opens)
- Session liquidity (Asia, London, NY AM, NY PM) and a custom liquidity window (e.g., first 5/15/30 minutes of a session or any custom high/low window)
- LTF EMA and HTF EMA
- Bias framework (D/W/M)
- High Volatility (HV) marker and Range/Compression highlighting
Suggested workflow:
- Enable liquidity plots + sessions to frame context (sweeps / key levels).
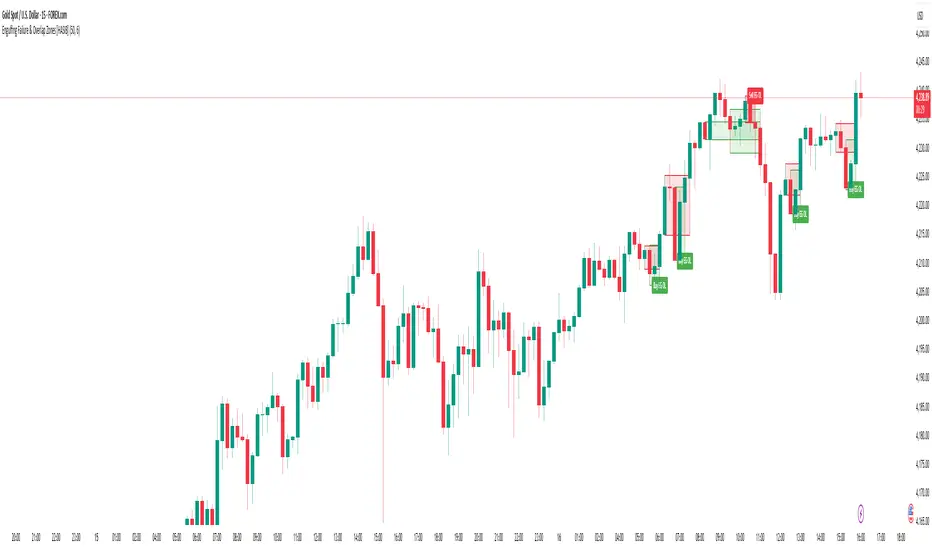
- Use FVGs + engulfing / bar-trend coloring (as shown in the chart example) to identify actionable areas and confirmation.
- Use EMA/Bias filters if you want stricter alignment.
- For risk management, consider using ATR, % bands, or structure for stop placement (your responsibility).
- Keep the chart clean by disabling anything you don’t use.
Alerts:
This indicator includes alert conditions for key events (e.g., breakouts/trailing triggers, engulfing signals, FVG detection, liquidity sweeps, bias target hits, and HV bars). Configure alerts from TradingView’s alert dialog after adding the indicator to your chart.
Note:
This indicator does not place trades or manage positions. It is intended for visualization, manual execution support, and alerts.
How to access:
See the Author’s Instructions.
Disclaimer:
Not financial advice. Trading involves risk.
Penunjuk Pine Script®